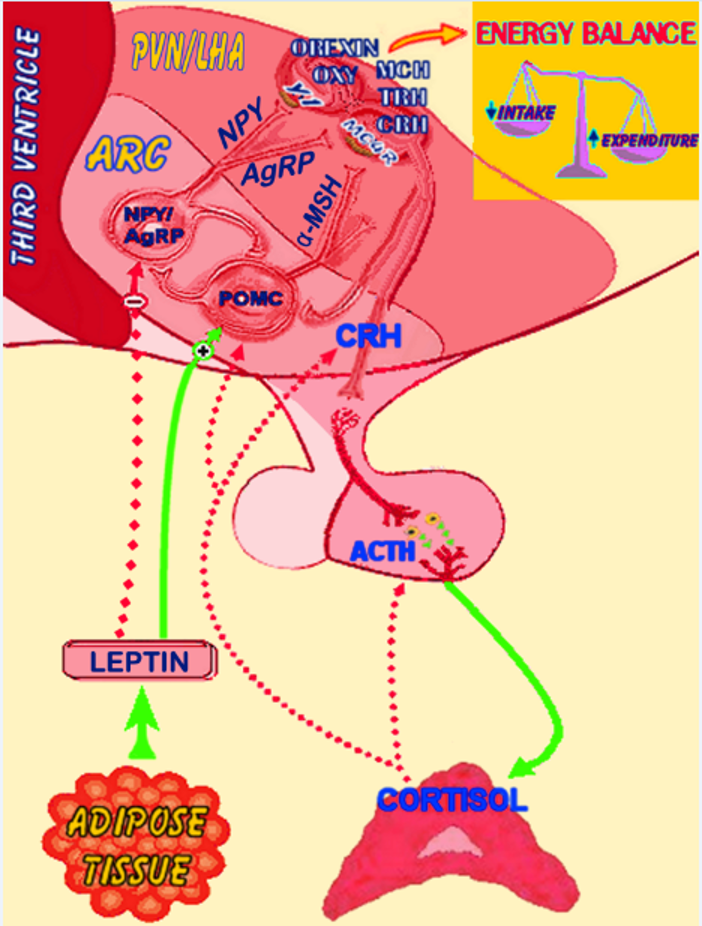
Figure 3. Schematic representation of interactions between the hypothalamic-pituitary-adrenal (HPA) axis, adipose tissue and hypothalamic appetite-satiety centers. ARC: arcuate nucleus; PVN: paraventricular nucleus; LHA: lateral hypothalamic area; CRH: corticotropin-releasing hormone; ACTH: adrenocorticotropic hormone (corticotrophin); POMC: proopiomelanocortin; NPY: neuropeptide Y; AgRP: agouti related peptide; α-MSH: α-melanocyte-stimulating hormone; Y1: neuropeptide Y receptor type 1; MC4R: melanocortin receptor type 4; TRH: thyrotropin-releasing hormone; MCH: melanin concentrating hormone; OXY: oxytocin. Activation is represented by solid green lines and inhibition by dashed red lines.