ABSTRACT
Hypocalcemia is an electrolyte derangement commonly encountered on surgical and medical services. This derangement can result from a vast spectrum of disorders. The condition may be transient, reversing with addressing the underlying cause expeditiously, or chronic and even lifelong, when due to a genetic disorder or the result of irreversible damage to the parathyroid glands after surgery or secondary to autoimmune destruction. Adult and pediatric endocrinologists must carefully assess patients with hypocalcemia, factoring into that assessment clinical presentation and symptomatology, concomitant laboratory abnormalities, past medical and family histories, recent medications, and even genetic sequencing analysis on the patient or affected family members. Critical initial laboratory testing involves measuring serum phosphate, magnesium, intact parathyroid hormone (PTH), 25-hydroxyvitamin D, and 1,25-dihydroxyvitamin D levels. Further evaluation is directed by the clinical and laboratory profiles that emerge. Significant fundamental insights into the molecular pathogenesis of several disorders that cause hypocalcemia have been made. These insights involve the molecular etiologies for PTH resistance (i.e., the different subtypes of pseudohypoparathyroidism); the role of the AIRE (autoimmune regulator) protein in autoimmune hypoparathyroidism and in mediating central tolerance to self-antigens; and the molecular bases for different genetic forms of magnesium wasting (that in turn causes hypocalcemia) and hypoparathyroidism. Genetic etiologies for hypoparathyroidism involve mutations in the calcium-sensing receptor, the G protein subunit alpha 11 that couples the receptor to downstream signaling molecules in parathyroid cells, transcription factors essential for parathyroid gland development, and the PTH molecule itself. Treatment of hypocalcemia depends on severity and chronicity. A calcium infusion is indicated for severe acute and or symptomatic hypocalcemia, while the standard mainstays of oral therapy are calcium supplements and activated vitamin D metabolites. Finally, and importantly, despite the rarity of chronic hypoparathyroidism, there have been several clinical trials supporting the use of recombinant human PTH (1-84) in the management of patients not well controlled on standard treatment. These trials have led to the approval of PTH (1-84) by the US Food and Drug Administration for adults with this disorder not well regulated on the usual therapy. Future research is being directed toward designing ideal treatment regimens with PTH (1-84) as well as developing a better understanding of the risks for post-surgical hypoparathyroidism, the most common etiology of hypoparathyroidism in adult patients. For complete coverage of this and all related ares of Endocrinology, please see our FREE web-book www.endotext.org.
CLINICAL PRESENTATION OF HYPOCALCEMIA
Hypocalcemia can present as an asymptomatic laboratory finding or as a severe, life-threatening condition (Table 1). Distinguishing acute from chronic hypocalcemia and asymptomatic from severely symptomatic hypocalcemia is critical for determining appropriate therapy. In the setting of acute hypocalcemia, rapid treatment may be necessary. In contrast, chronic hypocalcemia may be well tolerated, but treatment is necessary to prevent long-term complications.
Table 1. Clinical Features Associated With Hypocalcemia |
Neuromuscular irritability
|
Neurological signs and symptoms
|
Mental status
|
Ectodermal changes
|
Smooth muscle involvement
|
Ophthalmologic manifestations
|
Cardiac
|
| Adapted from Schafer AL and Shoback D: Hypocalcemia: definition, etiology, pathogenesis, diagnosis and management. Primer on the Metabolic Bone Diseases and Disorders of Mineral Metabolism, C. J. Rosen (ed), John Wiley and Sons, Eighth Edition. pp 572-578, 2013. |
Acute hypocalcemia may have cardiac manifestations. Prolongation of the QT-interval due to lengthening of the ST-segment on electrocardiogram is fairly common in hypocalcemic patients. T-waves are abnormal in approximately 50% of patients (1). A pattern of acute anteroseptal injury on EKG without infarction has been associated with hypocalcemia and other electrolyte abnormalities (2). Hypomagnesemia in concert with hypocalcemia may magnify the EKG abnormalities. Rarely, congestive heart failure may occur (1,3,4). Reversible cardiomyopathy due to hypocalcemia has been reported (5). In patients with mild, asymptomatic hypocalcemia, calcium replacement can result in improved cardiac output, and exercise tolerance (6).
Chronic hypocalcemia may have an entirely different presentation (7,8). Patients with idiopathic hypoparathyroidism or pseudohypoparathyroidism may develop neurological complications, including calcifications of the basal ganglia and other areas of the brain (9,10), and extrapyramidal symptoms. Grand mal, petit mal, or focal seizures have been described. Increased intracranial pressure and papilledema may be present. If the patient has pre-existing subclinical epilepsy, hypocalcemia may lower the excitation threshold for seizures (11). Electroencephalographic changes may be acute and nonspecific or present with distinct changes in the electroencephalogram (EEG). EEG changes may be present with or without symptoms of hypocalcemia. The relationship between calcification of basal ganglia (9,10-12), cerebral cortex, or cerebellum with pre-existing epileptic or convulsive disorders is not well understood.
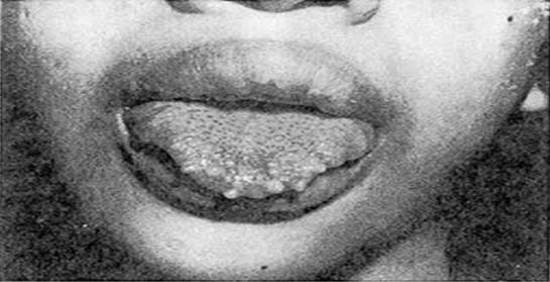
Epidermal changes are frequently found in patients with chronic hypocalcemia. These include dry skin, coarse hair, and brittle nails. If hypocalcemia has occurred prior to the age of 5, dental abnormalities may be present. Dental abnormalities include enamel hypoplasia, defects in dentin, shortened premolar roots, thickened lamina dura, delayed tooth eruption, and an increase in the number of dental caries. Alopecia has been noted following surgically-induced hypoparathyroidism and is also associated with autoimmune hypoparathyroidism. Other skin lesions reported in patients with hypoparathyroidism include atopic eczema, exfoliative dermatitis, impetigo herpetiformis, and psoriasis. Restoration of normocalcemia is reported to improve these skin disorders.
Changes in smooth muscle function with low serum levels of calcium may cause irritability of the autonomic ganglia and can result in dysphagia, abdominal pain, biliary colic, wheezing, and dyspnea. Subscapular cataracts occur in chronic, longstanding hypocalcemia (12) and with treatment, especially when the calcium x phosphate product is chronically elevated. Paravertebral ligamentous ossification has been noted in 50% of cases with hypoparathyroidism, and antalgic gait may be noted. In some cases of chronic hypoparathyroidism, psychoses, organic brain syndrome, and subnormal intelligence have been noted. Treatment of the hypocalcemia may improve mental functioning and personality, but amelioration of psychiatric symptoms is inconsistent. Delayed development, subnormal IQ, and poor cognitive function could also be a component of a syndrome that includes hypoparathyroidism as one of its features (7,8). This is critically important to consider in young patients being evaluated for the condition. In the elderly population, disorientation or confusion may be manifestations of hypocalcemia.
ETIOLOGY OF HYPOCALCEMIA
Hypocalcemia can result from disorders of vitamin D metabolism and action, hypoparathyroidism, resistance to parathyroid hormone (PTH), or a number of other conditions (Table 2) (13,14). These topics are discussed in separate sections below.
Table 2. Causes of Hypocalcemia |
Inadequate vitamin D production and action
|
| Inadequate PTH production/Hypoparathyroidism—see Table 3 |
Functional hypoparathyroidism
|
| PTH resistance - Pseudohypoparathyroidism |
| Miscellaneous etiologies
Neonatal hypocalcemia Hyperphosphatemia
Drugs
Rapid transfusion of large volumes of citrate-containing blood Acute critical illness “Hungry bone syndrome”
Osteoblastic metastases Acute pancreatitis Rhabdomyolysis Mitochondrial gene defects |
| Adapted from: Schafer AL, Shoback, D: Hypocalcemia: definition, etiology, pathogenesis, diagnosis and management. Primer on the Metabolic Bone Diseases and Disorders of Mineral Metabolism, C. J. Rosen (ed), John Wiley and Sons, Eighth edition, pp 572-578, 2013. |
VITAMIN D DISORDERS RESULTING IN HYPOCALCEMIA
Both inherited and acquired disorders of vitamin D and its metabolism may be associated with hypocalcemia (15,16). Data from the 2005-2006 National Health and Nutrition Examination Survey (NHANES) estimates that the true prevalence of vitamin D deficiency (25-hydroxy vitamin D level ≤20 ng/mL [50 nmol/L]) is 41.5% (17).
Nutritional Vitamin D Deficiency
The fortification of milk, cereals, breads, and other foods with vitamin D and the use of supplements are why there are so few cases of vitamin D deficiency in children in the United States. Vitamin D deficiency has been recognized in the United States in children who have restricted diets or specialized diets (18). In countries that do not fortify foods, childhood vitamin D deficiency is more common. Vitamin D deficiency is recognized as a worldwide problem in older adults as well (15,16). Exclusively breastfed infants are at high risk for vitamin D deficiency, as there is little vitamin D in human milk.
Lack of Sunlight Absorption
Decreased synthesis of vitamin D in the skin is not uncommon and may be due to the lack of sun exposure due to excessive sunscreen usage, skin pigmentation, protective clothing, winter season, increased latitude or aging. Patients who are unable to be exposed to solar ultraviolet B radiation are at risk for vitamin D deficiency. In cultures where traditional dress includes long garments, hoods or veils, this may result in reduced sun exposure and vitamin D deficiency (19,20).
Malabsorption
Fat malabsorption accompanying hepatic dysfunction, sprue, Whipple's disease, Crohn's disease, and gastric bypass surgery may result in intestinal malabsorption of vitamin D and result in lower concentrations of circulating 25-hydroxy (25[OH]) vitamin D (21).
Liver Disease
Liver disease is not a common cause of inadequate 25(OH) vitamin D levels, as over 90% of the liver has to be dysfunctional before the 25(OH) vitamin D drops to subnormal levels. However, intestinal fat malabsorption occurs in both parenchymal and cholestatic liver disease, and this may cause vitamin D deficiency. Certain anticonvulsant drugs can alter the kinetics and hepatic metabolism of 25(OH) vitamin D. Vitamin D deficiency is usually easily corrected by additional vitamin D administration.
Renal Disease
Nephrotic syndrome with excretion of large amounts of protein has also been associated with lower levels of 25(OH) vitamin D and may be due to excretion of vitamin D binding protein. Chronic renal failure with a reduction in glomerular filtration rate to <30% of normal may present with decreased production of 1,25-(OH)2 vitamin D. In the setting of chronic renal failure, hyperphosphatemia and secondary hyperparathyroidism occur. Serum calcium tends to be in the low normal range. Hypocalcemia is usually not observed in the presence of low levels of 25(OH) vitamin D due to the compensatory rise of PTH, which will mobilize the calcium from skeletal stores. Hypocalcemia only occurs when these stores are severely depleted.
Inherited Disorders of Vitamin D Metabolism and Action
Inherited disorders can result from the deficiency in the renal production of 1,25-(OH)2 vitamin D (vitamin D-dependent rickets type 1) or a defect in the vitamin D receptor (VDR) (vitamin D-dependent rickets type 2). Both disorders are exceedingly rare. Patients with vitamin D-dependent rickets (VDDR) type 1 usually present with rickets, hypocalcemia, hypophosphatemia, elevated alkaline phosphatase, and as a result of their hypocalcemia, secondary hyperparathyroidism. Because type 1 VDDR results from a defect in the renal production of 1-alpha-hydroxylase (15,16), 1,25-(OH)2 vitamin D levels are decreased or undetectable. In contrast, patients with VDDR type 2 have disrupted production or impaired function of the VDR, resulting in end-organ resistance to 1,25-(OH)2 vitamin D. The clinical presentation includes severe hypocalcemia, hypophosphatemia, and resultant secondary hyperparathyroidism with elevated alkaline phosphatase and rickets. In this disorder, however, the constant stimulation of renal 1-alpha-hydroxylase from the chronic hypocalcemia, hypophosphatemia, and increased PTH levels results in elevated serum levels of 1,25-(OH)2 vitamin D (15,16).
HYPOPARATHYROIDISM
The causes of hypoparathyroidism are summarized in Table 3 (7,8,22).
Postsurgical Hypoparathyroidism and Hypocalcemia
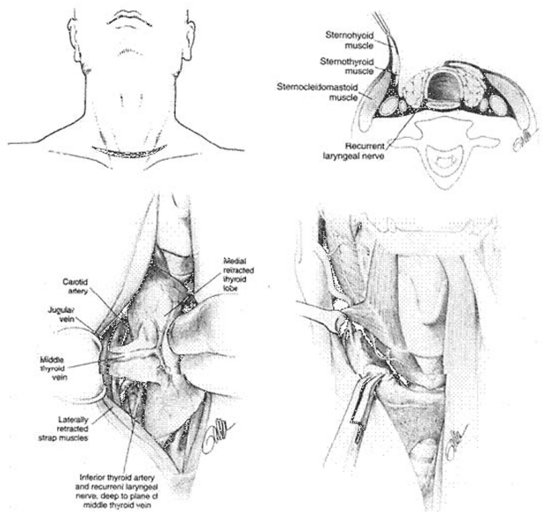
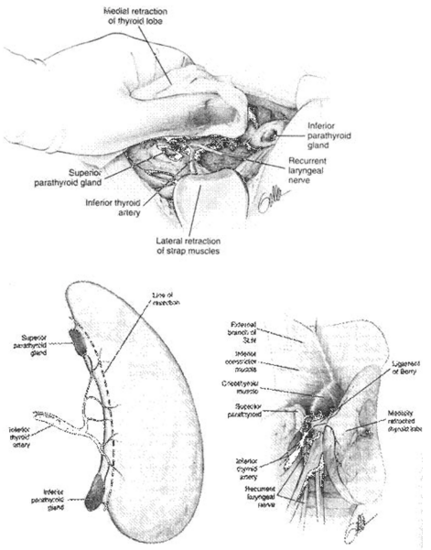
One of the most common causes of hypocalcemia is inadvertent removal of, damage to, or inadvertent devascularization of the parathyroid glands during surgery for parathyroid or thyroid disease. This may be short-term, in which case it is parathyroid gland “stunning.” If persistent (beyond 6 months), postoperative permanent hypoparathyroidism is the diagnosis. Other causes of postoperative hypocalcemia include the “hungry bone syndrome” with low serum calcium levels resulting from remineralization of the bone, as the stimulus for high bone turnover (e.g., high PTH or thyroid hormone levels) is removed are discussed below. There may be edema in the surgical field resulting in hypocalcemia due to the surgery itself, which may remit as the swelling subsides. The vascular supply to the remaining parathyroid glands may be compromised resulting in hypocalcemia. In chronic hyperparathyroidism, the dominant hyperactive parathyroid adenoma may have suppressed the remaining normal parathyroid glands. After removal of the adenoma, the remaining suppressed parathyroid glands will eventually regain their functional capacity, although this may take time.
After surgery for primary hyperparathyroidism, hypocalcemia can be a significant source of morbidity. Risk factors for the development of early post-operative hypocalcemia have been assessed by several groups (23-27). In one study, patients with hypocalcemia within the 4 days after surgery were more likely to have had higher pre-operative levels of serum osteocalcin, bilateral (as opposed to unilateral) surgery, and a history of cardiovascular disease (23). Other studies have identified pre-operative vitamin D deficiency [25 (OH) vitamin D level <20 ng/mL] (24) and a drop in intraoperative PTH level of >80% (25) as significant risk factors for post-operative hypocalcemia. Employing more specific case definitions, one group classified cases of post-operative hypocalcemia as either “hungry bone syndrome” (hypocalcemia and hypophosphatemia) or hypoparathyroidism (hypocalcemia and hyperphosphatemia). Independent risk factors for the development of hungry bone syndrome were pre-operative alkaline phosphatase level, blood urea nitrogen level, age, and parathyroid adenoma volume (26,27). Additional research is needed to understand better the risks for post-surgical hypoparathyroidism.
While the gold standard for the surgical treatment of primary hyperparathyroidism was once bilateral neck exploration, advances in surgical technique, pre-operative localization capabilities, and intra-operative PTH monitoring have allowed for more limited parathyroid surgical approaches, including unilateral neck exploration and minimally invasive parathyroidectomy with a high degree of success. Unilateral neck exploration was shown to cause less early severe symptomatic hypocalcemia than bilateral neck exploration in a randomized controlled trial (28). Intraoperative PTH monitoring has also been shown to reduce the rate of complications (including hypoparathyroidism) in patients undergoing reoperations for primary hyperparathyroidism (29).
Neck explorations for reasons other than hyperparathyroidism are associated with hypocalcemia. Thyroid surgery, for example, is associated with hypocalcemia, presumably due to surgical disruption or vascular compromise of the parathyroid glands. Transient hypocalcemia is observed in 16-55% of total thyroidectomy cases (30,31). One group recently reported that of the 50% of patients who developed post-operative hypocalcemia, hypoparathyroidism persisted beyond one month in 38% (30). In another retrospective study, transient hypocalcemia was observed in 35% of patients undergoing total thyroidectomy, 3% had chronic hypocalcemia 6 months post-operatively, and 1.4% had permanent hypoparathyroidism 2 years post-operatively (31). The type of surgery performed is associated with the risk of developing hypocalcemia. For example, risk of hypocalcemia is higher after completion thyroidectomy or total thyroidectomy with node dissection (30). Transient hypocalcemia was observed more frequently after thyroidectomy for Graves’ disease than for nontoxic multinodular goiter, although incidence of permanent hypoparathyroidism was not different between groups (32).
With hospital stays after surgery typically short, it is important to know how long to monitor a postoperative thyroid or parathyroid surgical patient for hypocalcemia. Bentrem et al. performed a chart review of 120 patients undergoing total/near-total thyroidectomy and/or parathyroidectomy, and they found that a low ionized calcium level 16 hours post-operatively was sufficient to identify patients at risk for post-operative hypoparathyroidism (33). Another review of outcomes following thyroidectomy reported that a low intact PTH level 1 hour post-operatively predicted symptomatic hypocalcemia with an 80-87% diagnostic accuracy, and none of the patients studied experienced symptomatic hypocalcemia when the 1-hour post-op PTH level was greater than 10 pg/mL. In the same study, a low ionized calcium level the morning after surgery predicted biochemical hypocalcemia with 78-95% diagnostic accuracy (34).
Another study attempted to use both perioperative PTH levels and serum calcium levels to predict hypocalcemia after total or near-total thyroidectomy (31). PTH levels after surgical resection of the second thyroid lobe, age, and number of parathyroid glands identified intraoperatively were independently associated with decreased serum calcium levels measured at the nadir on postoperative day 1 or 2. Low levels of intraoperative PTH and serum calcium less than 2.00 mmol/L predicted biochemical hypocalcemia with a similar sensitivity (90% vs 90%) and specificity (75% vs 82%).
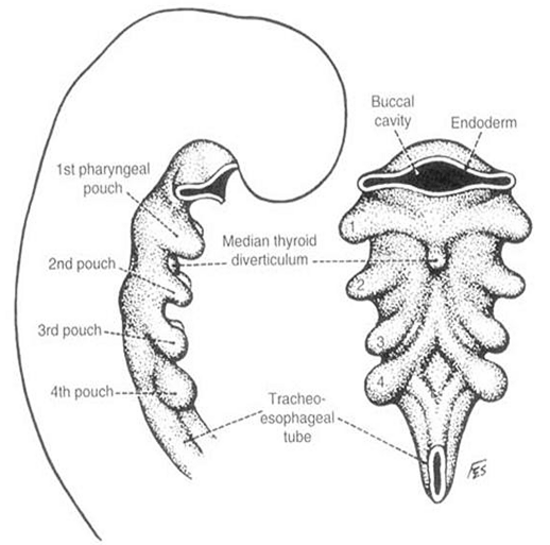
Developmental Disorders of the Parathyroid Gland
Developmental abnormalities in the third and fourth pharyngeal pouches result in the DiGeorge syndrome (35,36). Aplasia or hyperplasia of the thymus, aplasia or hypoplasia of the parathyroid glands and associated conotruncal cardiac malformation are hallmarks of this disorder. Severe hypocalcemia resulting in seizures and tetany can occur. Immunodeficiency due to thymic defects and hypoplasia can lead to recurrent infections. Other common associated cardiac defects include tetralogy of Fallot and truncus arteriosus. Abnormal patterns of aortic arch arteries, improper alignment of the aortic pulmonary outflow vessels, and defects in septation of the ventricles can occur. Occasionally, partial forms of the DiGeorge syndrome occur, and an EDTA challenge test may be necessary to confirm the diagnosis and unmask the hypoparathyroidism. Fluorescence in situ hybridization is one test that can be used to make the diagnosis.
DiGeorge syndrome is the most frequent contiguous gene deletion syndrome in humans and occurs in 1 in 4000 live births. The microdeletion is found in chromosome 22q11.2. The phenotypic presentation is variable. In a small cohort of 16 patients who met clinical criteria for DiGeorge syndrome, correlation was made with a microdeletion on chromosome 22q11.2 and immunodeficiency characterized by recurrent respiratory infections and absent thymus gland. Cell-mediated immunodeficiency and infections characterize this disorder (37). Other studies suggest that newborns with DiGeorge syndrome have preserved T-cell function, but the numbers of T cells are decreased. There is variable improvement in peripheral blood T-cell counts as the patients increase in age. A gene involved in the the features of the DiGeorge syndrome or sequence is the transcription factor TBX1 (35,38-40). Transgenic mice haploinsufficient for TBX1 demonstate some components of the DiGeorge syndrome (41). Complete knockout of the gene is lethal in mice and results in a high incidence of cardiac outflow tract abnormalities (42).
Table 3. Differential Diagnosis of Hypoparathyroidism |
Iatrogenic
|
Infiltrative/Destructive Diseases
|
Neonatal
|
Autoimmune
|
Genetic or developmental disorders
|
| Adapted from Schafer AL and Shoback D: Hypocalcemia: definition, etiology, pathogenesis, diagnosis and management. Primer on the Metabolic Bone Diseases and Disorders of Mineral Metabolism, C. J. Rosen (ed), John Wiley and Sons, Eighth Edition, pp 572-578, 2013. |
Genetic Etiologies of Hypoparathyroidism
Hypoparathyroidism in Association with Syndromes
Hypoparathyroidism has been described in association with specific disorders such as the Kearns-Sayre syndrome, which presents with heart block, retinitis pigmentosa and ophthalmoplegia. The Kenny-Caffey syndrome has also been associated with hypoparathyroidism and includes medullary stenosis of the long bones and growth retardation (43).
Familial Isolated Hypoparathyroidism
A few rare cases of familial isolated hypoparathyroidism have been described and are heterogeneous in their modes of inheritance: X-linked recessive, autosomal recessive, and autosomal dominant (7,8,44-51).
X-linked recessive idiopathic hypoparathyroidism was reported in 2 related kindreds from Missouri, USA (47). Epilepsy and hypocalcemia were discovered in affected males during infancy. The disorder appears to be due to an isolated congenital defect of the parathyroid gland development, and linkage studies established this recessive idiopathic hypoparathyroidism was linked to a gene Xq26-q27 (44).
In one kindred of autosomal dominant isolated hypoparathyroidism, the primary molecular defect was a mutation in the prepro-PTH gene (48). A highly charged arginine residue replaced cysteine within the hydrophobic core of the prepro-PTH signal peptide sequence. This sequence is critical for the movement of newly formed prepro-PTH through the endoplastic reticulum. The inability to progress through the cell secretory pathway could explain why these patients lacked expression of bioactive PTH. Other mutations in the signal peptide of prepro-PTH gene have also been reported (49). Another example leading to apoptosis in the affected cells was also described.
An autosomal recessive mode of inheritance has been described in isolated hypoparathyroidism in a Bangladesh-Asian kindred (50). The prepro-PTH gene mutation resulted in a substitution of G to C in the first nucleotide position of the prepro-PTH intron 2. This mutation resulted in an aberrant prepro-PTH mRNA so that the entire signal sequence would be absent preventing PTH secretion. The patients were homozygous for the mutant allele and were the product of a consanguineous marriage.
A recent case of hypoparathyroidism was described in which the affected patient was found to have a homozygous mutation in PTH at residue 25 (arginine substituted with cysteine). The proband (from among 3 affected siblings in the same family) produced very high or frankly low levels of PTH, depending on the immunoassay used to measure the hormone (51). This made the diagnosis confusing as the possibility of pseudohypoparathyroidism was raised because the patient had both hypocalcemia and hyperphosphatemia. The circulating hormone displayed dramatically impaired ability to activate the PTH/PTH-related protein (PTHrP) type 1 receptor (PTH/PTHrP-R1) in transfected cells.
Ding and coworkers described a large kindred with hypoparathyroidism due to a homozygous mutation in the glial cells missing-2 (GCM2) transcription factor mapped to 6p23-24 (52). GCM2 is expressed in parathyroid cells, and its expression is essential to the development of a PTH-secreting cell. Additional kindreds with other loss of function mutations in GCM2 have been described (53-56), further supporting the importance of this molecule in parathyroid gland development and in considering it diagnostically in kindreds affected by autosomal recessive hypoparathyroidism. There have been additional patients with GCM2 mutations in which the mutant transcription factor behaves as a dominant negative and the disease is inherited in an autosomal dominant manner (54).
Mutations Affecting the Extracellular Calcium-Sensing Receptor and Other Molecules in Its Signaling Pathway
The calcium-sensing receptor (CaSR) is critical to the regulation of PTH secretion and parathyroid cell function. This receptor is a member of the G-protein coupled receptor superfamily and is strongly expressed in the kidney and parathyroid gland as well as other tissues. If hypercalcemia occurs, the CaSR activates the G-protein signaling pathway, resulting in increased intracellular calcium levels and the suppression of PTH gene transcription. Heterozygous inactivating mutations of Casr result in familial benign hypocalciuric hypercalcemia. Homozygous inactivating mutations cause neonatal severe hyperparathyroidism. Autosomal dominant and sporadic hypoparathyroidism can result from gain of function mutations of the Casr (57). The clinical presentation in these patients ranges from asymptomatic to life-threatening hypocalcemia. PTH levels are frankly low to low normal, and hypercalciuria may be present out of proportion to the degree of hypocalcemia. Activating mutations typically are in the amino-terminal extracellular domain of the receptor. Hypercalciuria can be exacerbated resulting in nephrocalcinosis and impairment of renal function if patients are treated with vitamin D or its analogues. Casr mutations are considered to be second to post-surgical hypoparathyroidism in frequency as a cause of hypoparathyroidism in the adult.
Recently mutations have been described in the gene encoding the G protein alpha subunit (Ga11 or GNA11) that couples the CaSR to downstream signaling molecules and specifically to activation of intracellular calcium mobilization (58,59). The patients described have heterozygous point mutations in Ga11 with these substitutions (Arg181Gln; Phe341Leu, Arg60Cys, and Ser211Trp), and they demonstrate mild hypocalcemia clinically. When these mutant G-protein alpha subunits are expressed in transfected cells, there is an apparent gain of function in extracellular calcium-activated signal transduction compatible with the suppression of PTH secretion in vivo.
Hypoparathyroidism, Sensory Neural Deafness, Renal Dysplasia Syndrome
The HDR (hypoparathyroidism, sensory neural deafness and renal dysplasia) syndrome is a rare autosomal dominant inherited syndrome which includes a variety of renal anomalies and varying degrees of hearing deficits as well as hypoparathyroidism (60-65). Linkage and mutational analysis have identified the gene responsible for the syndrome as GATA3, which encodes a zinc finger transcription factor involved in embryonic development of the parathyroid glands, kidney and otic vesicle (60). Patients are usually asymptomatic with inappropriately normal, given their level of hypocalcemia, or frankly low PTH levels.
Autoimmune Hypoparathyroidism
The classic association of autoimmune parathyroid disease, adrenal disease and mucocutaneous candidiasis is termed autoimmune polyendocrine syndrome type 1 (APS-1) (66-69) (Table 4). The presence of 2 of the 3 classic endocrine features of the disease establishes the diagnosis. APS-1 is typically inherited in an autosomal recessive pattern, and most cases are due to mutations in AIRE (autoimmune regulator of endocrine function), a gene located on chromosome 21q22.3. This gene encodes a transcription factor which is involved in the mechanisms of central tolerance to self-antigens in the thymus. APS-1 has also been reported in association with the presence of a thymoma (70). APS-1 has the onset of at least one disease component typically in early childhood with almost 100% penetrance. There are other autoimmune disorders associated with this syndrome including gonadal failure, hepatitis, malabsorption, type 1 diabetes, alopecia (totalis or aerata) and vitiligo.
Table 4. Features of Autoimmune Polyendocrine Syndrome Type I |
Classic Triad
|
Associated with 2 or 3 of the following
|
| Bilezikian J et al: Hypoparathyroidism in the adult: epidemiology, diagnosis, pathophysiology, target organ involvement, treatment and challenges for future research. J Bone Min Res 26: 2317-37, 2011; and Betterle C, Garelli S, Presotto F: Diagnosis and classification of autoimmune parathyroid disease. Autoimm Rev 13: 417-22, 2014. |
The most common age of onset of APS-1 is 8 years, and it occurs equally in males and females. There is a temporal sequence of development of APS-1 with chronic cutaneous candidiasis frequently the herald event. Hypoparathyroidism may occur next and may present as a seizure during an acute illness. Addison's disease (adrenal insufficiency) follows. These disorders occur at the average of 5, 9 and 14 years of age, respectively (71). There may be variation within individual families in the clinical presentation.
As many as 50% of patients with APS-1 experience keratoconjunctivitis (72). Keratoconjunctivitis can intermittently recur but also can be chronic and disabling. Some propose that this is a hypersensitivity response to the candidiasis as opposed to a component of APS-1 per se. Histopathological features have been evaluated in corneal buttons obtained at keratoplasties. Severe atrophy of the corneal epithelium was evident. The anterior corneal layers, epithelium, the Bowman's membrane and anterior corneal stoma only are affected. The anterior corneal stroma is replaced by scar tissue with features of chronic inflammation consisting of lymphocytes and plasma cells (73). There are reported cases of keratoconjunctivitis in the absence of a candida infection. Other ocular abnormalities include retinitis pigmentosa, exotropia, pseudo-optosis, cataracts, papilledema, strabismus, recurrent blepharitis, and loss of eyebrows and eyelashes (74).
In children with APS-1, other ectodermal disorders have been described, but they are also found in patients with non-autoimmune mediated hypocalcemia. These include alopecia totalis or areata, piebaldism, vitiligo, cataracts and papilledema. In APS-1, approximately 20 to 30% of individuals have some form of alopecia. Vitiligo has been reported in 10% of affected individuals (66-69).
Another immune problem associated with APS-1 is delayed sensitivity due to T-cell abnormalities. Dental dysplasia, including enamel hypoplasia, may predate the onset of hypoparathyroidism. Fifteen percent of affected individuals have gastric atrophy and pernicious anemia. Ten percent of APS-1 individuals develop chronic active hepatitis with cirrhosis which may be a significant cause of mortality. Due to intestinal malabsorption, management may be difficult due to malabsorption of calcium and vitamin D.
Autoantibodies occur routinely in APS-1 and are its hallmark. One group studied individuals with hypoparathyroidism and APS-1 and showed that >50% of these patients demonstrated antibodies to NALP5 (nacht leucine repeat protein 5), a molecule potentially involved in signal transduction in parathyroid cells (75,76). One of the strongest markers for the presence of APS-1, in patients with one or more features of the disease and even prior to disease onset in high-risk individuals, is the presence of neutralizing anti-interferon alpha or omega antibodies (69,77,78). These antibodies are thought to play a pathogenic role in the disease features including impaired mucosal immune responses and recognition of self by the thymus based on findings in mouse models (79,80).
Treatment of patients with hypoparathyroidism due to an autoimmune mechanism can be difficult. In children with autoimmune hypoparathyroidism, the symptoms of Addison's disease can be masked, and lack of glucocorticoid therapy can result in a fatal outcome. In adrenocortical insufficiency, serum calcium concentrations may be elevated and decrease rapidly to hypocalcemic levels after the introduction of corticosteroid replacement therapy. The introduction of hormone replacement therapy for premature ovarian failure can also lead to a diminution in serum calcium levels. Vitamin D malabsorption can occur secondary to diarrhea due to intestinal malabsorption. Patients with features of APS-1 should be screened regularly for associated autoimmune abnormalities. It is recommended that healthy siblings be screened in the first decade of life biochemically or preferable with genetic testing or testing for the presence of autoantibodies. Several forms of autoimmune hypoparathyroidism can occur either with or without other endocrinopathies (i.e., as isolated hypoparathyroidism) (69).
PSEUDOHYPOPARATHYROIDISM
Pathophysiology
Pseudohypoparathyroidism (PHP) was initially described by Dr. Fuller Albright and colleagues in 1942, and the disorders involved according to current classification are shown in Table 5. These patients have clinical and biochemical features consistent with hypoparathyroidism but have neither a hypercalcemic nor phosphaturic response to exogenous parathyroid extract. PTH resistance is the biochemical hallmark of PHP, and in untreated patients, serum levels of PTH are elevated sometimes very markedly so. Biological resistance to PTH causes inadequate flow of calcium into extracellular fluids and deficient phosphate excretion by the kidney. Hypocalcemia is due to impaired mobilization of calcium from bone, reduced intestinal absorption of calcium, and increased urinary losses.
Table 5. Comparison of Features of Pseudohypoparathyroidism (PHP) and Pseudopseudohypoparathyroidism (PPHP) |
||||
| PHP 1a | PHP 1b | PHP 2 | PPHP | |
| AHO | + | - | - | + |
| Serum calcium | ↓ | ↓ | ↓ | NL |
| cAMP Response to PTH | ↓ | ↓ | ↓ | NL |
| Urinary Phosphate | ↓ | ↓ | ( ↓ ) NL | NL |
| Response to PTH | ||||
| Hormone Resistance | PTH, TSH and other Gs-alpha coupled hormones | PTH target tissues only | PTH target tissues only | None |
| Molecular defect | Reduced functional Gs-alpha levels | Abnormalities in Gs-alpha gene transcription | Unknown | Gs-alpha |
| AHO = Albright’s hereditary osteodystrophy
PTH = parathyroid hormone Adapted from Juppner H and Bastepe M: Pseudohypoparathyroidism. Primer on the Metabolic Bone Diseases and Disorders of Mineral Metabolism, C. J. Rosen (ed), John Wiley and Sons, Eighth Edition, pp 590-600, 2013. |
||||
In PHP 1, there is autosomal dominant inheritance of the mutation. However, there is imprinting of the GNAS locus with silencing of the paternal allele, which influences the expression of the phenotype. In PHP 1a, if the mutation is inherited from the mother, the disease in the offspring manifests as PHP 1a with low serum calcium, high serum phosphate and high PTH levels plus the presence of features of Albright’s hereditary osteodystrophy (AHO) (described below). If the mutation is passed down from the father, that allele is silenced in the proximal tubules of the kidney (through imprinting). The normal sequence from the maternal allele is expressed, and the biochemical and mineral abnormalities are absent. Only the AHO phenotype is present in such an individual. This is called pseudopseudohypoparathyroidism (PPHP).
The hallmark of the diagnosis of PHP 1a is a markedly attenuated urinary cyclic AMP response to exogenous administration of PTH. The resistance to PTH is caused by a defect in the PTH hormone receptor-adenylate cyclase complex that produces cyclic AMP. Receptors communicate with the catalytic unit of adenylate cyclase through guanyl nucleotide binding regulatory proteins (G-proteins). There are many G-proteins, some of which are stimulatory (Gs) or inhibitory (Gi) to receptor dependent activation of adenylate cyclase.
The original description by Albright of PHP focused on PTH resistance. However, patients with PHP 1a may display partial resistance to other hormones and present with short stature, hypothyroidism, hypogonadism, and mental retardation (81-84). Patients with PHP 1a also can have ovulatory, gustatory and auditory dysfunction. The defect is in Gs alpha, a ubiquitous protein required for functional cyclic AMP production and the amounts of G-protein present can be measured in plasma membrane of accessible cells. Patients with PHP 1a have an ~50% reduction in Gs alpha in all tissues studied. A variety of mutations in the Gs alpha gene (GNAS) have been identified by sequencing analysis.
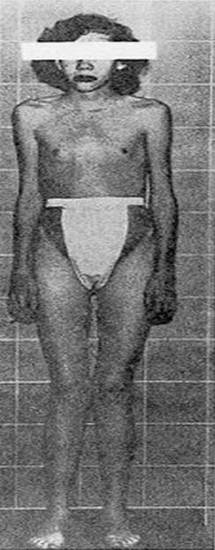
Patients with PHP also have a constellation of developmental and somatic defects that are referred to as AHO. Short stature, round facies, brachydactyly (Figure), obesity, and subcutaneous calcifications are classic features of AHO (81-84). Phenotypes can vary and presentations may be subtle. A variant phenotype of patients with features of AHO but lacking hormone resistance is considered to have PPHP. These patients have normal serum calcium levels.
 |
| Figure. X-rays demonstrate congenital shortening of the third, fourth and fifth metacarpals on the right hand. This patient was a 40-year-old female with normal serum calcium, phosphate and alkaline phosphatase. Her findings are consistent with pseudopseudohypoparathyroidism. |
Individuals classified as PHP 1b typically lack features of AHO. Typically patients with PHP1b have the same biochemical presentation with hypocalcemia and hyperphosphatemia with elevated levels of PTH. They lack the appropriate increase in urinary cyclic AMP in response to PTH infusion. These patients have been studied extensively and in affected kindreds the disorder has been mapped to the GNAS1 locus (81-84). The disease is thought to be due to abnormalities in DNA methylation of the GNAS1 promoter, altering levels of Gs alpha expression in key target tissues. There is also a group with specific promoter DNA methylation defects which lead to a reduction in GNAS1 transcription due to the loss of methylation.
In PHP 2, there is reduced phosphaturic response to administration of exogenous PTH, but a normal increase in urinary cyclic AMP excretion. PHP 2 is a clinically heterogenous syndrome. The molecular pathophysiology is poorly understood. These patients may demonstrate normal cyclic AMP but absent phosphaturic responses to PTH. Hypocalcemia, decreased calcium mobilization from bone in response to PTH, and decreased serum 1,25-(OH)2 vitamin D are the prominent features of PTH resistance.
Signs and Symptoms
Patients with PHP can present with signs and symptoms of hypocalcemia. Neuromuscular irritability, with an onset in mid childhood (average age ~8 years), has been described. Other patients may remain asymptomatic and not be diagnosed with PHP until adulthood. Symptoms of hypocalcemia such as carpopedal spasms, paresthesias, convulsions, muscle cramps and stridor can all be found in PHP. In some severe cases, life-threatening laryngeal spasm has been reported in children. Posterior subscapular cataracts can occur in patients with longstanding untreated hypocalcemia. Basal ganglia calcifications have been found in 50% of patients with PHP and may produce extrapyramidal movement disorders. In some patients with PHP, normal serum calcium levels may be present. Hypocalcemia may develop insidiously and be preceded by increasing levels of serum PTH. Psychiatric problems such as depression, paranoia, psychosis and delusions have been described in the presence of hypocalcemia. Cognitive defects such as mental retardation and memory impairment have been encountered. Dental defects include dental and enamel hypoplasia, blunted tooth root development, and delay of tooth eruption.
In patients with radiographic evidence of osteitis fibrosis cystica, there is clearly skeletal sensitivity to PTH. In such individuals, serum alkaline phosphatase levels and biochemical markers of bone turnover, especially of bone resorption, may be increased. Bone mineral density (BMD) may be normal or decreased. Especially in those with skeletal sensitivity to PTH, there may be decreased BMD, especially at cortical sites.
Reproductive abnormalities have been described. In patients with AHO and PHP, 76% of patients were oligomenorrheic or amenorrheic, had delayed sexual development, and only 2 of 17 patients had a history of pregnancy. All of these patients had typical PTH resistance and a 50% reduction in Gs alpha activity. These patients were mildly hypoestrogenemic with normal to slightly elevated serum gonadotropin levels. It was proposed that the reproductive dysfunction was due to partial resistance to gonadotropins since administration of the synthetic GnRH analogue produced normal FSH and LH responses (85).
Phenotypic variability is another problem with the diagnosis of AHO even among affected individuals in a kindred. Nonspecific physical characteristics include short stature and obesity. Brachydactyly is a more specific criterion and can be diagnosed by physical or radiographic examination. In AHO, the most commonly shortened bones are the distal phalanx of the thumb and the fourth metacarpal. On a radiograph of a normal hand, a line drawn tangential to the distal ends of the fourth and fifth metacarpals passes distal to the head of the third metacarpal. Archibald’s sign is present if the line instead runs through the distal end of the third metacarpal (86). Heterotopic ossification can also occur, but little is known about the cause.
Diagnosis and Management of Pseudohypoparathyroidism
Patients who present with hypoparathyroidism and an elevated serum level of PTH should be suspected for possible PHP. The typical phenotype of AHO (short stature, brachydactyly of the hands and feet, subcutaneous calcifications) should suggest PHP 1a or PPHP. Hypocalcemia, hyperphosphatemia, elevated levels of PTH and normal renal function lead one to be highly suspicious of the diagnosis. A positive family history lends further support.
The biochemical hallmark is failure of bone and kidney to respond adequately to PTH. The classic tests of Ellsworth and Howard and of Chase, Melson, and Aurbach (87) involved administration of 200 to 300 USP units of bovine parathyroid extract with measurements of urinary cyclic AMP and phosphate. The test hormone is now synthetic human PTH (1-34). After administration of human PTH (1-34), normal subjects and patients with hypoparathyroidism display 10- to 20-fold increases in urinary cyclic AMP. Patients with PHP 1a and 1b have markedly blunted responses. The definitive test for the diagnosis of PHP 1 is the analysis of the Gs-alpha protein levels or sequencing of GNAS1, which can be done in reference laboratories.
Treatment of hypocalcemia in patients with PHP is the same as for other types of hypoparathyroidism. However, patients with AHO may require specific therapies related to skeletal abnormalities. Approximately 30% of patients with AHO have ectopic calcification and occasionally, large extraskeletal osteomas require surgical removal to relieve symptoms (88). Ossification of ligaments may also require surgery to relieve neurological problems (89).
Pseudopseudohypoparathyroidism
Patients who express only the AHO phenotype are described as having PPHP (Table 5). These subjects have normal serum calcium levels and have no other evidence of hormone resistance. These patients have the same mutant allele that can cause Gs alpha deficiency in other affected family members who have hormone resistance (81-84). Tissue-specific imprinting of GNAS1 in the proximal tubules of the kidney and in the thyroid gland occurs, for example in this disease, such that the paternal allele (if it is non-mutant) is silenced and allows for the expression of only one mutant maternal allele of GNAS1 in those tissues, producing the phenotype of hormonal resistance.
OTHER CAUSES OF HYPOCALCEMIA
Neonatal Hypocalcemia
Skeletal mineralization of the fetus is due to active calcium transport from the mother across the placenta. At term, the fetus is hypercalcemic relative to the mother and may have suppressed PTH levels. Over the first 4 days of life, PTH levels fall first and then rise to normal adult levels by 2 weeks after birth (90).
In the first 24-48 days of life, “early” neonatal hypocalcemia may occur. It is more common in premature infants, infants of diabetic mothers, and infants who have suffered asphyxia. The proportional drop in ionized calcium may be less than the drop in total calcium, so those symptoms may not be manifest. Hypocalcemia in premature infants is not unusual, but the reason is not understood. One proposal is that an exaggerated rise in calcitonin occurs that provokes hypercalcemia. Other hypotheses include the fact that PTH secretion may be impaired in the premature infant. Infants of diabetic mothers have an exaggerated postnatal drop in circulating calcium levels, and strict maternal glycemic control during pregnancy reduces the incidence of hypocalcemia in these infants.
Between 5 and 10 days of life, "late" neonatal hypocalcemia may result in tetany and seizures. This disorder is more common in full-term infants than in premature infants. One risk factor is hyperphosphatemia due to administration of cow's milk, which may reflect an inability of the immature kidney to secrete phosphate. Magnesium deficiency may also masquerade as hypocalcemia in an infant. Congenital defects of intestinal magnesium absorption or renal tubular absorption can occur resulting in severe hypocalcemia.
Hyperparathyroidism during pregnancy is unusual but can result in hypocalcemia in the newborn (91). Atrophy of the fetal parathyroid glands can occur during intrauterine life due to the increased calcium delivery to the fetus. The infant's parathyroid glands are not able to respond to the hypocalcemic stimulus after birth and maintain normal serum calcium levels.
A typically benign autosomal dominant disorder, familial hypocalciuric hypercalcemia (FHH), can paradoxically produce neonatal hypocalcemia. FHH is usually due to heterozygous inactivating mutations in the Casr. There is a report of an infant with late onset life-threatening hypocalcemia secondary to relative hyperparathyroidism. The hypoparathyroidism was thought to be due to fetal parathyroid suppression secondary to high maternal calcium levels in a mother with FHH due to a heterozygous Casr mutation (92).
Factitious Hypocalcemia Due to Hypoalbuminemia
In patients with chronic illness, malnutrition, cirrhosis, or volume over-expansion, serum albumin may fall with a reduction in the total, but generally not the ionized, fraction of serum calcium. This is referred to as "factitious" hypocalcemia. Patients do not have any of the signs or symptoms listed above of hypocalcemia. There is a correlation between the extent of hypoalbuminemia and hypocalcemia such that one can calculate the corrected total serum calcium. If the serum albumin levels fall to <4.0 g/dL, the usual correction is to add 0.8 mg/dL to the measured total serum calcium for every 1.0 g/dL by which the serum albumin is lowered. This is not a completely precise method, and serum ionized calcium measurements can confirm whether true hypocalcemia is present.
Hypomagnesemia
Magnesium depletion is relatively common in the hospitalized patient, occurring in 10% of this population. Hypocalcemia is commonly associated with magnesium depletion. Hypomagnesemia may be caused by excessive losses through the gastrointestinal tract. Chronic diarrhea of essentially any etiology can cause hypomagnesemia. Non-tropical sprue, radiation therapy, bacterial and viral dysentery, and severe pancreatitis can cause hypomagnesemia. Bypass or resection of the small bowel may also result in intestinal magnesium loss. Mutations in several genes important in magnesium conservation may also cause intestinal magnesium loss (93,94).
Loss of magnesium through renal mechanisms may be due to osmotic diuresis or glycosuria, and it may also occur in hypoparathyroidism. Many drugs cause renal magnesium wasting such as diuretics, aminoglycosides, amphotericin B, cisplatinum, cyclosporin, and pentamidine (7,8).
A rare etiology is primary familial hypomagnesemia, which usually is diagnosed at a very young age. Hypomagnesemia with secondary hypocalcemia, due to a mutation in TRPM6, was described simultaneously by two groups (95,96). TRPM6 is a protein of the long transient receptor potential channel (TRPM) family. It is highly similar to TRPM7, a bifunctional protein combining calcium- and magnesium-permeable cation channel activities with protein kinase activity. TRPM6 is present in both kidney tubules and intestinal epithelia and maps to chromosome 9q. This autosomal recessive disorder can sometimes present with the triad of hypomagnesemia, hypokalemia, and hypocalcemia. It is treatable with life-long magnesium supplementation. Recognition and treatment can prevent long-term neurological defects. Several other inherited disorders causing hypomagnesemia have been elucidated and are described in recent reviews (93,94).
Patients with severe hypocalcemia due to magnesium depletion should be treated with intravenous magnesium at a dose of 48 mEq over 24 hours. Although magnesium can be administered intramuscularly, these injections are usually painful. Even though intravenous magnesium administration may result in prompt normalization of magnesium levels, hypocalcemia may not be corrected for 3-7 days. This may be because cellular uptake of magnesium is slow, and magnesium is predominantly an intracellular cation. Repletion of magnesium thus requires sustained correction of the deficiency state. Magnesium therapy may be continued until the biochemical signs of depletion (hypocalcemia and hypokalemia) resolve.
Hyperphosphatemia
Hyperphosphatemia can lower serum calcium. There are many causes of hyperphosphatemia, including increased intake of phosphate, decreased excretion of phosphate or increased translocation of phosphate from tissue breakdown into the extracellular fluid. Renal insufficiency is probably the most common cause of hyperphosphatemia. The use of phosphate-containing enemas or zealous use of oral phosphate may also lead to hyperphosphatemia. Vitamin D administration, especially of vitamin D metabolites like calcitriol, may also cause hyperphosphatemia. The transcellular shift of phosphate from cells into the extracellular fluid compartment is seen in tissue destruction or increased metabolism. Examples of transcellular shifts include changes in phosphate that accompany treatment of acute leukemias or lymphomas or large bulky solid tumors with effective chemotherapy. Rapid release of cellular phosphate may occur causing the tumor lysis syndrome (97). In rhabdomyolysis due to crush injury, hypocalcemia and hyperphosphatemia may occur. Severe intravascular hemolysis may lead to a similar syndrome. In diabetic ketoacidosis, ketone-induced urinary losses of phosphate deplete total body stores, but patients may present with hyperphosphatemia. When the volume shifts during the correction of hyperglycemia and acidosis, the shift of phosphate back into cells can result in mild transient hypophosphatemia.
Hyperphosphatemia alters the calcium-phosphate product and the solubility of these ions. This may lead to calcium salt deposition in soft tissues. Ectopic calcifications in tissues may form, including in blood vessels, heart valves, skin, periarticular tissues, and the cornea (band keratopathy). Hyperphosphatemia inhibits 1-alpha-hydroxylase activity in the kidney. The resulting lower circulating concentrations of 1,25(OH)2 vitamin D may further aggravate the hypocalcemia by impairing intestinal absorption of calcium. Hypocalcemia and tetany may occur if serum phosphate rises rapidly. Treatment should be directed towards reducing the hyperphosphatemia in order to correct the hypocalcemia.
Hyperphosphatemia-induced hypocalcemia inhibits vitamin D bioactivation in the kidney and the resulting low 1,25(OH)2 vitamin D levels may result in increased PTH secretion. Secondary hyperparathyroidism from long-term hyperphosphatemia has been well described and is usually associated with renal insufficiency. Ectopic calcifications in tissues may occur.
Medications and Toxins
There are many drugs associated with hypocalcemia. One class of such agents is inhibitors of bone resorption. These drugs include bisphosphonates, calcitonin, and denosumab, the neutralizing monoclonal antibody to the receptor activator of nuclear factor kappa B ligand (RANK-L) (98-101). Calcitonin, given in multiple doses daily is a short-term treatment for hypercalcemia, so hypocalcemia is an expected therapeutic outcome with such a dosing regimen. Hypocalcemia after administration of an intravenous bisphosphonate like pamidronate or zoledronic acid is uncommon but if it occurs can be prolonged (99,100). This is especially true in patients with underlying vitamin D deficiency. Patients receiving denosumab for osteoporosis or metastatic cancer to bone are at risk for hypocalcemia, especially if there is underlying chronic kidney disease (101). Oral or parental phosphate preparations can also lower serum calcium. Hypocalcemia and osteomalacia have been described with prolonged therapy with anticonvulsants such as phenytoin (diphenylhydantoin) or phenobarbital. Hypocalcemia has also been found in patients undergoing pheresis and plasmapheresis with citrated blood. Fluid overdoses during dialysis, over-fluorinated public water supplies, and ingestion of fluoride-containing cleaning agents have all been associated with low serum calcium levels. In this case, hypocalcemia is thought to be due to excessive rates of skeletal mineralization secondary to formation of calcium difluoride complexes. Chemotherapeutic agents such as the combined use of 5-fluorouracil and leucovorin, may result in mild hypocalcemia. The hypomagnesemia caused by cisplatinum can induce hypocalcemia.
"Hungry Bone Syndrome"
Rapid remineralization of the bone occurring postoperatively, after thyroidectomy for thyrotoxicosis or parathyroidectomy for hyperparathyroidism, is referred to as "hungry bone syndrome" (26,27,102). It is due to a rapid increase in bone uptake of serum minerals after the removal of a stimulus of high rates of bone remodeling (thyroid hormone or PTH). When the stimulus is removed, there is a dramatic increase in bone formation. Hypocalcemia can occur if the rate of skeletal mineralization exceeds the rate of osteoclast-mediated bone resorption. This syndrome can be associated with severe and diffuse bone pain and tetany.
A similar pathophysiology (net rapid uptake of calcium into bone) is the cause of hypocalcemia due to osteoblastic metastases. This may occur in patients with prostate or breast cancer (7). Acute leukemia or osteosarcoma can also result in hypocalcemia. In patients with vitamin D deficiency and symptoms of osteomalacia, institution of vitamin D therapy can result in hypocalcemia. All these disease states result in hypocalcemia due to rapid mineralization of large amounts of unmineralized osteoid.
Pancreatitis
Pancreatitis can be associated with lipid abnormalities, hypocalcemia, and even tetany. With the development of animal models, the mechanism of hypocalcemia is known (103). When the pancreas is damaged, free fatty acids are generated by the action of pancreatic lipase. There are insoluble calcium salts present in the pancreas, and the free fatty acids avidly chelate the salts resulting in calcium deposition in the retroperitoneum. In addition, hypoalbuminemia may be part of the clinical picture so that there is a reduction in total serum calcium. If there is concomitant alcohol abuse, emesis or poor nutrition, hypomagnesemia may augment the problem. PTH levels can be normal, suppressed or elevated. If PTH levels are normal or suppressed, hypomagnesemia may be present. If PTH levels are elevated, this is a reflection of the hypocalcemia. In the treatment of these patients, parenteral calcium and magnesium replacements are indicated. Vitamin D status should be assessed to rule out malabsorption or nutritional deficiencies.
Hypocalcemia Associated With Critical Illness
There are multiple reasons why a patient with acute illness may experience hypocalcemia. Acute or chronic renal failure, hypomagnesemia, hypoalbuminemia ("factitious hypocalcemia"), medications, or transfusions with citrated blood may all alter levels of serum calcium. Pancreatitis, as stated above, may also result in hypocalcemia. Another setting in which hypocalcemia can occur is sepsis and usually confirms a grave prognosis (104). In gram negative sepsis or in the "toxic shock syndrome", there is a reduction in both total and ionized serum calcium. The mechanism of action remains unknown, but elevated levels of the cytokines IL-6 or TNF-alpha may be mediators of hypocalcemia.
In a study of patients with acute illnesses, the 3 most common factors identified with low calcium levels were hypomagnesemia, presence of acute renal failure, and transfusions. The level of hypocalcemia correlated with patient mortality (105).
To assess the incidence of hypocalcemia in critically ill patients, Zivin and colleagues (105) compared the frequency and degree of hypocalcemia in nonseptic critically ill patients. Three groups of hospitalized patients were studied: critically ill patients admitted to medical, surgical, trauma, neurosurgical, burn, respiratory and coronary intensive care units (ICUs) (n=99); non-critically ill ICU patients discharged from an ICU within 48 hours (n=50) and non-ICU patients (n=50). Incidences of levels of low ionized calcium were 88%, 66% and 26% for the 3 groups, respectively. The occurrence of hypocalcemia correlated with mortality/hazard ratio for death, 1.65 for calcium decrements of 0.1 mmol/L, (p<0.002). No specific illness (renal failure, blood transfusions) was associated with hypocalcemia.
Transfusion-Related Causes of Hypocalcemia
During surgical procedures, hypocalcemia may occur with the rapid infusion of citrated blood, with physiologic increases in serum PTH levels. Symptoms are variable in this setting, and it is thought that the phenomenon is due to acute hemodilution by physiological saline and complexation of calcium by the large amounts of citrate infused. This is noted also during hepatic transplantation when the liver’s capacity for clearance of citrate is interrupted. Hypocalcemia due to hypoparathyroidism is well recognized in transfusion-dependent patients with beta-thalassemia (106-108). It is thought that hypoparathyroidism and the other endocrinopathies seen in patients with thalassemia are due to iron overload. Their presence correlates with disease duration and extent of transfusions.
TREATMENT OF HYPOCALCEMIA
The decision to treat is dependent on presenting symptoms, and the severity and rapidity with which hypocalcemia develops. All treatment requires close monitoring. If intravenous infusions are contemplated, hospitalization in an intensive care unit or specialized unit with access to cardiac monitoring and rapid ionized calcium determinations is ideal for optimal management and safety.
Acute Hypocalcemia
Acute hypocalcemia can be life-threatening, as patients may present with tetany, seizures, cardiac arrhythmias, laryngeal spasm, or altered mental status. Calcium gluconate is the preferred intravenous calcium salt as calcium chloride often causes local irritation. Calcium gluconate contains 90 mg of elemental calcium per 10 mL ampule, and usually 1 to 2 ampules (180 mg of elemental calcium) diluted in 50 to 100 mL of 5% dextrose is infused over 10 minutes. This can be repeated until the patient's symptoms have cleared. With persistent hypocalcemia, administration of a calcium gluconate drip over longer periods of time may be necessary. The goal should be to raise the serum ionized calcium concentration into the low normal range (~1.0 mM), maintain it there, and control the patient’s symptoms. Drip rates of 0.5-2.0 mg/kg/hour are recommended. As soon as possible, oral calcium supplementation should be initiated and, if warranted, therapy with vitamin D or its analogues.
Intravenous administration of calcium is not without problems. Rapid administration could result in arrhythmias so intravenous administration should be carefully monitored. Local vein irritation can occur with solutions >200 mg/100 mL of elemental calcium. If local extravasation into soft tissues occurs, calcifications due to the precipitation of calcium phosphate crystals can occur (109). Calcium phosphate deposition can occur in any organ and is more likely to occur if the calcium-phosphate product exceeds 55. Calcium phosphate deposition in the lungs, kidney or other soft tissue may occur in patients receiving intravenous calcium especially in the presence of high serum phosphate levels.
It is essential to measure serum magnesium in any patient who is hypocalcemic, as correction of hypomagnesemia must occur to overcome PTH resistance before serum calcium will return to normal.
Chronic Hypocalcemia
In chronic hypocalcemia, patients can often tolerate remarkably severe hypocalcemia and remain asymptomatic. For patients who are asymptomatic or with mildly symptomatic hypocalcemia, calcium homeostasis can be restored with oral calcium and vitamin D or an activated vitamin D metabolite such as calcitriol (7,8).
Oral calcium carbonate is often the most commonly administered salt, although many different calcium salts exist. Oral doses calcium should be in the amount of 1 to 3 grams of elemental calcium in 3 to 4 divided doses with meals to ensure optimal absorption. Calcium carbonate contains 40% elemental calcium by weight and is relatively inexpensive. Lower amounts of elemental calcium are present in other types of calcium such as calcium lactate (13%), calcium citrate (21%) and calcium gluconate (9%), requiring a larger number of tablets. There are expensive forms of calcium supplements that have relatively few additional advantages. Liquid calcium supplements are available such as calcium glubionate that contains 230 mg of calcium per 10 mL or liquid forms of calcium carbonate. In patients with achlorhydria, a solution of 10% calcium chloride (1- to 30 ml) every 8 hours can also effectively raise calcium levels. Calcium phosphate salts should be avoided.
The overall goal of therapy is to maintain serum calcium in the low normal range, especially in patients with hypoparathyroidism (7,8,110). Serum calcium should be tested every 3 to 6 months or when any changes in the medical regimen are made. One potential side effect of therapy in patients with hypoparathyroidism is hypercalciuria which can be complicated by nephrocalcinosis, nephrolithiasis, and or renal insufficiency. A 24-hour urine calcium along with creatinine determination should be done at least annually, once stable doses of supplements are established. The target for urinary calcium excretion is <4 mg/kg/24 hr. Serum levels of calcium are poor indicators of the presence of hypercalciuria and nephrocalcinosis (110). The patient should also regularly see an ophthalmologist to screen for cataracts. When treating hypocalcemia in the presence of hyperphosphatemia, special care must be taken (sometimes with the use of a phosphate binder) to avoid soft tissue calcium phosphate precipitation. Soft tissue calcification can occur in any tissue, but involvement of vital organs such as the lungs, kidney, heart, blood vessels, or brain can result in substantial morbidity or mortality (10).
For patients with hypoparathyroidism, vitamin D2 or D3 (ergocalciferol or cholecalciferol, respectively) or vitamin D metabolites [calcitriol or 1,25-(OH)2 vitamin D or 1 alpha-OH vitamin D (not available in the US)] are often required. Calcitriol, the active metabolite of vitamin D, is rapid-acting and physiologic and is often used for initial therapy. Where rapid dose adjustment is necessary, such as growing children, this may be the most convenient approach (111). Most patients require 0.25 mcg twice daily and may require up to 0.5 mcg 4 times a day of calcitriol. Among other options, ergocalciferol is a less expensive choice and has a long duration of action. The usual dose is 50,000 to 100,000 IU/day. When therapy needs to be administered acutely, calcitriol should be given for the first 3 weeks but then tapered off as the dose of ergocalciferol becomes effective. If calcitriol is the vitamin D metabolite administered, then the serum 25 (OH) vitamin D level should be checked periodically to assure that vitamin D sufficiency is maintained. Serum 25 (OH) vitamin D levels should be kept stable at >20 ng/mL.
Thiazide diuretics can increase renal calcium reabsorption in patients with hypoparathyroidism. This approach may be needed to achieve a urinary calcium of <4 mg/kg/day. Furosemide and other loop diuretics can depress serum calcium levels and should be avoided. Other factors that may precipitate hypocalcemia are glucocorticoids since they can antagonize the action of vitamin D and its analogues.
Administration or withdrawal of exogenous estrogen can also influence calcium and vitamin D replacement therapy. Estrogen increases calcium absorption at the level of the intestine and indirectly through stimulation of renal 1-alpha-hydroxylase activity. Dose adjustment may be required after changes in estrogen therapy due to alteration in calcium homeostasis. During the pre- and postpartum period in pregnant patients with hypoparathyroidism, doses of vitamin D often need frequent adjustments. This is due to placental production of 1,25-(OH)2 vitamin D in pregnancy, the increasing levels of PTH-rP from placental, maternal and fetal tissues later in pregnancy, and the high levels of PTH-rP in conjunction with the estrogen-deficient state of lactation (110).
How well current treatment strategies (calcium salts, vitamin D and its metabolites) maintain quality of life in patients with hypoparathyroidism has been assessed to a limited extent (112). In a cross-sectional, controlled study, 25 women with postsurgical hypoparathyroidism on stable calcium and vitamin D treatment were compared to 25 control subjects with a history of thyroid surgery. Quality of life, urinary calcium excretion and renal calcifications, serum creatinine, and the presence of cataracts by slit lamp examination were assessed. Serum calcium was in the therapeutic target range in 18 of 25 hypoparathyroid patients. Urinary calcium was elevated (>8 mmol/day) in 5 of 23 patients. Eleven of 25 hypoparathyroid patients had cataracts, and 2 of 25 had renal stones (112). Compared to the control group, those with hypoparathyroidism had higher global complaint scores with predominant increases in anxiety and phobic anxiety subscores and their physical equivalents using validated questionnaires. Thus, by both physical and psychologic assessments, there were several parameters that were reduced compared to control subjects.
The long-term complications of standard treatment of hypoparathyroidism were recently examined in a cohort of 120 patients (73% women, average age 52 years, 66% post-surgical) followed at a tertiary medical center (10). The time-weighted average for serum calcium (maintained between 7.5 and 9.5 mg/dL) occurred in 88% of patients. Patients were estimated to be in this range ~86% of the time. Just 53 of 120 patients had any 24-hour urine calcium level determined. Of those patients, 38% had at least one elevated measurement (>300 mg/24 hours). Among the 54 of 120 with renal imaging, intrarenal calcifications were detected in 31%. Of those with brain imaging (31/120 patients), 52% had basal ganglia calcifications. Analysis of renal function showed rates of chronic kidney disease (stage 3 or greater) of 2- to 17-fold higher than age-adjusted normal subjects (10). Overall, it was concluded that patients with hypoparathyroidism suffer excess morbidity, especially with regard to renal outcomes.
Underbjerg et al (113,114) examined clinical outcomes in a case-control study of 688 Danish patients with hypoparathyroidism compared to age- and gender-matched controls. Patients with postsurgical hypoparathyroidism demonstrated increased risk of renal complications (hazard ratio [HR], 3.67; 95% confidence interval [CI], 2.41-5.59) and hospitalizations due to seizures (HR, 3.82; 95% CI, 2.15-6.79), compared to controls (113). No increased cardiovascular complications or deaths were seen. Using the same cohort, Underbjerg et al (114) further reported greater risks of hospitalization for infections (HR, 1.42; 95% CI, 1.20-1.67) and of depression/bipolar affective disorder (HR, 1.99; 95% CI, 1.14-3.46). Risks of cataracts, cancers, spinal stenosis, and fractures were not increased.
The same investigators assessed the epidemiologic features of nonsurgical hypoparathyroidism in Danish patients (115). Based on data from 180 patients (collected from 1977 to 2012), these investigators found a marked increased in renal insufficiency (HR, 6.01; 95% CI, 2.45-14.75), as well as almost 2-fold increased risk of cardiovascular disease (HR, 1.91; 95% CI, 1.29-7.81). Neuropsychiatric complications (HR, 2.45; 95% CI, 1.78-3.35) and risks of infections (HR, 1.94; 95% CI, 1.55-2.44), seizures (HR, 10.05; 95% CI, 5.39-18.72), cataracts (HR, 4.21; 95% CI, 2.13-8.34), and upper extremity fractures (HR, 1.93; 95% CI, 1.31-2.85) were also increased. This was thought to be due to the longer duration (lifetime) of the genetic condition responsible for the nonsurgical hypoparathyroidism in these patients.
Replacement with PTH for Hypoparathyroidism
In hypoparathyroidism, ideal treatment would theoretically be to replace the hormone itself in a physiologic manner. Several clinical studies have evaluated PTH (1-34) and PTH (1-84) as replacement therapy for hypoparathyroidism. In a trial of hypoparathyroid patients, once daily administration of PTH (1-34) normalized serum and urine calcium levels, but the action lasted only 12 hours (116). With twice-daily administration of PTH (1-34) compared to twice-daily calcitriol for 3 years in 27 patients, Winer et al (117) reported stabilization of serum calcium levels just below the lower limit of normal and a normalization of urinary calcium excretion (at the target level of 1.25-6.25 mmol/24 hours). Patients on calcitriol in this trial had urinary calcium levels above normal. Serum creatinine levels were stable over time in both groups of patients, and biochemical markers of bone turnover increased with PTH (1-34) treatment compared to control levels at baseline. BMD by dual energy x-ray absorptiometry (DXA) increased slightly but significantly at the lumbar spine and whole body in the calcitriol-treated patients and remained stable over 3 years in the PTH-treated group. These studies in adults (116,117) included patients with a variety of different etiologies for their hypoparathyroidism including patients with activating Casr mutations. Two other studies done in children (118,119) demonstrated stabilization of serum calcium levels with twice-daily treatment and normalization of urinary calcium excretion on both PTH(1-34) and calcitriol. The most promising results for lowering urinary calcium into an acceptable range was seen during continuous PTH(1-34) infusion. This approach achieved urinary calcium levels of ~4 mmol calcium/24 hours vs ~9.7 mmol/24 hours with twice-daily injections (normal range, 1.25-6.25 mmol/24 hours) in 8 adults with hypoparathyroidism (120). Serum calcium, phosphorus, and magnesium concentrations were comparable with the two modes of PTH(1-34) delivery. These findings suggest that renal PTH receptors may require more continuous exposure to the hormone to reabsorb calcium adequately.
Three recent trials have tested the ability of PTH(1-84) therapy to permit lowering of calcium and calcitriol supplements safely while maintaining serum calcium homeostasis in patients with chronic hypoparathyroidism (121-124). Rubin et al (121) gave PTH(1-84) (100 mcg every other day) to hypoparathyroid patients and was able to lower both calcium and calcitriol supplements substantially (30-40%), while maintaining serum calcium within the target range and mildly lowering urinary calcium excretion. Since there was no placebo control group in this study, reports of improved quality of life parameters (122) must be interpreted cautiously.
Two other clinical trials, which included placebo treatment arms, further assessed the safety and efficacy of PTH(1-84) therapy in hypoparathyroid subjects (123,124). In the first, using a randomized, placebo-controlled trial design, Sikjaer et al (123) added PTH(1-84) (fixed dose of 100 mcg/day) or placebo injections to 62 patients on a chronic regimen of calcium and active vitamin D supplements for 24 weeks. As serum calcium levels rose, supplements were reduced. A substantial percentage of serum calcium measurements in patients receiving PTH(1-84) were elevated during the trial (~20%), and ~96% of those episodes in the PTH-treated subjects versus the placebo-treated group. This outcome may have affected the quality of life during the study because no differences were noted between the PTH(1-84)- and placebo-treated groups in those assessments.
In the second randomized, placebo-controlled trial, PTH(1-84) or placebo was administered for 24 weeks to 134 patients with chronic hypoparathyroidism as calcium supplements and activated vitamin D (calcitriol or alphacalcidol) were actively down-titrated (124). Dose escalations of PTH(1-84) were made starting at 50 mcg/day and then up to 75 and 100 mcg/day as calcium and activated vitamin D metabolites were dose-reduced. This study met its primary end-point, defined as a 50% or greater reduction in calcium supplements and in active vitamin D metabolites while maintaining a serum calcium concentration within the optimized range of 2.0-2.5 mM. Urinary calcium levels did not differ substantially between PTH(1-84)- compared to placebo-treated groups. Extension studies are in progress from two of these trials (121,124) to determine long-term safety and efficacy of PTH(1-84) in this patient population. Based on these findings, the Food and Drug Administration of the US approved recombinant human PTH(1-84) in 2015 for the treatment of hypoparathyroidism in patients not well controlled on conventional therapy with calcium supplements and activated vitamin D analogues. Future research is being directed toward designing ideal treatment regimens with PTH (1-84).
.
ACKNOWLEDGEMENTS
Dr. Schafer is supported by the US Department of Veterans Affairs, Veterans Health Administration, Clinical Science Research and Development Service, Career Development Award-2 (5 IK2 CX000549).
REFERENCES
- Rallidis LS, Gregoropoulos PP, Papasteriadis EG: A case of severe hypocalcaemia mimicking myocardial infarction. Int J Cardiol 61:89-91, 1997
- Lehmann G, Deisenhofer I, Ndrepepa G, et al: ECG changes in a 25-year-old woman with hypocalcemia due to hypoparathyroidism: Hypocalcemia mimicking acute myocardial infarction. Chest 119:668-669, 2001
- RuDusky BM: ECG abnormalities associated with hypocalcemia. Chest 119:668-669, 2001
- Kudoh C, Tanaka S, Marusaki S, et al: Hypocalcemic cardiomyopathy in a patient with idiopathic hypoparathyroidism. Intern Med 31:561-568, 1992
- Suzuki T, Ikeda U, Fujikawa H, et al: Hypocalcemic heart failure: A reversible form of heart muscle disease. Clin Cardiol 21:227-228, 1998
- Wong CK, Lau CP, Cheng CH, et al: Hypocalcemic myocardial dysfunction: Short- and long-term improvement with calcium replacement. Am Heart J 120:381-386, 1990
- Shoback D: Clinical practice: hypoparathyroidism. N Engl J Med 359: 391-403, 2008
- Bilezikian JP, Khan A, Potts JT Jr, et al: Hypoparathyroidism in the adult: epidemiology, diagnosis, pathophysiology, target-organ involvement, treatment and challenges for future research. J Bone Min Res 26: 2317-37, 2011
- Illum F, Dupont E: Prevalences of CT-detected calcification in the basal ganglia in idiopathic hypoparathyroidism and pseudohypoparathyroidism. Neuroradiology 27:32-37, 1985
- Mitchell DM, Regan S, Cobley MR, et al: Long-term followup of patients with hypoparathyroidism. J Clin Endo Metab 97: 4507-4514, 2012
- Basser LS, Neale FC, Ireland AW, et al: Epilepsy and electroencephalographic abnormalities in chronic surgical hypoparathyroidism. Ann Intern Med 71:507-515, 1969
- Faig JC, Kalinyak J, Marcus R, et al: Chronic atypical seizure disorder and cataracts due to delayed diagnosis of pseudohypoparathyroidism. West J Med 157:64-65, 1992
- Cooper MS, Gittoes NJ: Diagnosis and management of hypocalcaemia. Brit Med J 3366:1298-302, 2008
- Schafer AL, Shoback D. Hypocalcemia. In Primer on the Metabolic Bone Diseases, Eighth edition, Rosen, C. J. (ed), John P Wiley, 2013, pp 572-578
- Holick MF: Vitamin D deficiency. N Engl J Med 357:266-81, 2007
16. Thacher TD, Clarke BL: Vitamin D insufficiency. Mayo Clin Proc 86:50-60, 2011
17. Forrest KY, Stuhldrehr WL: Prevalence and correlates of vitamin D deficiency in US adults. Nutr Res 31:48-54, 2011
- Outila TA, Karkkainen MU, Seppanen RH, et al: Dietary intake of vitamin D in premenopausal, healthy vegans was insufficient to maintain concentrations of serum 25-hydroxyvitamin D and intact parathyroid hormone within normal ranges during the winter in Finland. J Am Diet Assoc 100:434-441, 2000
- Alagol F, Shihadeh Y, Boztepe H, et al: Sunlight exposure and vitamin D deficiency in Turkish women. J Endocrinol Invest 23:173-177, 2000
- Arabi A, El Rassi R, El-Hajj Fuleihan G: Hypovitaminosis D in developing countries-prevalence, risk factors and outcomes. Nat Rev Endocrinol 6:550-61, 2010
- Lo CW, Paris PW, Clemens TL, Nolan J, Holick MF: Vitamin D absorption in healthy subjects and in patients with intestinal malabsorption syndromes. Am J Clin Nutr 42:644-9, 1985
- Al-Azem H, Khan AA: Hypoparathyroidism. Best Pract Res Clin Endocrinol Metab 26:517-22, 2012
- Westerdahl J, Lindblom P, Valdemarsson S, et al: Risk factors for postoperative hypocalcemia after surgery for primary hyperparathyroidism. Arch Surg 135:142-147, 2000
- Stewart ZA, Blackford A, Somervell H et al: 25-hydroxyvitamin D deficiency is a risk factor for symptoms of postoperative hypocalcemia and secondary hyperparathyroidism after minimally invasive parathyroidectomy. Surgery 138:1018-25, 2005
- Steen S, Rabeler B, Fisher T, Arnold D: Predictive factors for early postoperative hypocalcemia after surgery for primary hyperparathyroidism. Proc (Bayl Univ Med Cent) 22:124-7, 2009
- Brasier AR, Nussbaum SR: Hungry bone syndrome: Clinical and biochemical predictors of its occurrence after parathyroid surgery. Am J Med 84:654-60, 1988
27, Witteveen JE, van Thiel S, Romijn JA, Hamdy NA: Hungry bone syndrome: still a challenge in the post-operative management of primary hyperparathyroidism: a systematic review of the literature. Eur J Endocrinol 168:R45-53, 2013
- Bergenfelz A, Lindblom P, Tibblin S, Westerdahl J: Unilateral versus bilateral neck exploration for primary hyperparathyroidism: a prospective randomized controlled trial. Ann Surg 236:543-51, 2002
- Richards ML, Thompson GB, Farley DR, Grant CS: Reoperative parathyroidectomy in 228 patients during the era of minimal-access surgery and intraoperative parathyroid hormone monitoring. Am J Surg 196: 937-42, 2008
- Sitges-Serra A, Ruiz S, Girvent M: Outcome of protracted hypoparathyroidism after parathyroidectomy. Br J Surg 97:1687-95, 2010
- Page C, Strunski V: Parathyroid risk in total thyroidectomy for bilateral, benign, multinodular goitre: report of 351 surgical cases. J Laryngol Otol 121:237-41, 2007
- Welch KC, McHenry CR: Total thyroidectomy: is morbidity higher for Graves’ disease than nontoxic goiter? J Surg Res 170:96-9, 2011
- Bentrem DJ, Rademaker A, Angelos P: Evaluation of serum calcium levels in predicting hypoparathyroidism after total/near-total thyroidectomy or parathyroidectomy. Am Surg 67:249-251, 2001
- Kim JH, Chung MK, Son YI: Reliable early prediction for different types of post-thyroidectomy hypocalcemia. Clin Exp Otorhinolaryngol 4:95-100, 2011
35. Burnside RD: 22q11.21 deletion syndromes: a review of proximal, central, and distal deletions and their associated features. Cytogenet Genome Res 146:89-99, 2015
- Shaw N: A practical approach to hypocalcaemia in children. In Allgrove J, Shaw NJ (eds): Calcium and Bone Disorders in Children and Adolescents. Endocr Dev. Basel, Karger, 2009, vol 16, pp 73–92
- Kornfeld SJ, Zeffren B, Christodoulou CS, et al: DiGeorge anomaly: A comparative study of the clinical and immunologic characteristics of patients positive and negative by fluorescence in situ hybridization. J Allergy Clin Immunol 105:983-987, 2000
- Kobrynski LJ, Sullivan KE: Velocardiofacial syndrome, DiGeorge syndrome: the chromosome 22q11.2 deletion syndromes. Lancet 370(9596):1443-52, 2007
- Shprintzen RJ: Velo-cardio-facial syndrome: 30 years of study. Dev Disabil Res Rev 14: 3-10, 2008
- McDonald-McGinn DM, Sullivan KE: Chromosome 22q11.2 deletion syndrome (DiGeorge syndrome/velocardiofacial syndrome). Medicine 90: 1-18, 2011
- Lindsay EA, Vitelli F, Su H, et al: Tbx1 haploinsufficiency in the DiGeorge syndrome region causes aortic arch defects in mice. Nature 410:97-101, 2001
- Jerome LA, Papaioannou VE: DiGeorge syndrome phenotype in mice mutant for the T-box gene, Tbx1. Nat Genet 27:286-291, 2001
- Fanconi S, Fischer JA, Wieland P, et al: Kenny syndrome: Evidence for idiopathic hypoparathyroidism in two patients and for abnormal parathyroid hormone in one. J Pediatr 109:469-475, 1986
- Trump D, Dixon PH, Mumm S, et al: Localization of X linked recessive idiopathic hypoparathyroidism to a 1.5 Mb region on Xq26-q27. J Med Genet 35:905-909, 1998
- Winter WE, Silverstein JH, Maclaren NK, et al: Autosomal dominant hypoparathyroidism with variable, age-dependent severity. J Pediatr 103:387-390, 1983
- Thakker RV: Genetics of endocrine and metabolic disorders: parathyroid. Rev Endocr Metab Disord 5: 37-51, 2004
- Whyte MP, Welson VV: Idiopathic hypoparathyroidism presenting with seizures during infancy: X-linked recessive inheritance in a large Missouri kindred. J Pediatr 99:608-611, 1981
- Arnold A, Horst SA, Gardella TJ, et al: Mutation of the signal peptide-encoding region of the preproparathyroid hormone gene in familial isolated hypoparathyroidism. J Clin Invest 86:1084-1087, 1990
- Sunthornthepvarakul T, Churesigaew S, Ngowngarmratana W: A novel mutation of the signal peptide of the preproparathyroid hormone gene associated with autosomal recessive familial isolated hypoparathyroidism. J Clin Endocrinol Metab 84:3792-3796, 1999
- Parkinson DB, Thakker RV: A donor splice site mutation in the parathyroid hormone gene is associated with autosomal recessive hypoparathyroidism. Nat Genet 1:149-152, 1992
- Lee S, Mannstadt M, Guo J et al: A homozygous [Cys25]PTH(1-84) mutation that impairs PTH/PTHrP receptor activation defines a novel form of hypoparathyroidism. J Bone Min Res 30: 1803-13, 2015
- Ding C, Buckingham B, Levine MA: Familial isolated hypoparathyroidism caused by a mutation in the gene for the transcription factor GCMB. J Clin Invest 108:1215-1220, 2001
- Thomée C, Schubert SW, Parma J, et al. GCMB mutation in familial isolated hypoparathyroidism with residual secretion of parathyroid hormone. J Clin Endocrinol Metab 90: 2487-92, 2005
- Mannstadt M, Bertrand G, Muresan M, et al. Dominant-negative GCMB mutations cause an autosomal dominant form of hypoparathyroidism. J Clin Endocrinol Metab 93: 3568-76, 2008
- Bowl MR, Mirczuk SM, Grigorieva IV, et al. Identification and characterization of novel parathyroid-specific transcription factor Glial Cells Missing Homolog B (GCMB) mutations in eight families with autosomal recessive hypoparathyroidism. Hum Mol Genet 19: 2028-38, 2010
- Mirczuk SM, Bowl MR, Nesbit MA, et al. A missense glial cells missing homolog B (GCMB) mutation, Asn502His, causes autosomal dominant hypoparathyroidism. J Clin Endocrinol Metab 95: 3512-6, 2010
- Hannan FM, Nesbit MA, Zhang C, et al: Identification of 70 calcium-sensing receptor mutations in hyper- and hypo-calcaemic patients: evidence for clustering of extracellular domain mutations at calcium-binding sites. Hum Mol Genet 21:2768-78, 2012
58. Nesbit MA, Hannan FM, Howles SA et al: Mutations affecting G-protein subunit α11 in hypercalcemia and hypocalcemia. N Engl J Med 368:2476-86, 2013
59. Mannstadt M, Harris M, Bravenboer B, et al: Germline mutations affecting Gα11 in hypoparathyroidism. N Engl J Med 368:2532-4, 2013
- Van Esch H, Groenen P, Nesbit MA, et al: GATA3 haplo-insufficiency causes human HDR syndrome. Nature 406:419-422, 2000
- Muroya K, Hasegawa T, Ito Y, et al: GATA3 abnormalities and the phenotypic spectrum of HDR syndrome. J Med Genet 38: 374-80, 2001
- Nesbit MA, Bowl MR, Harding B, et al: Characterization of GATA3 mutations in the hypoparathyroidism, deafness, and renal dysplasia (HDR) syndrome. J Biol Chem 279: 22624-34, 2004
- Zahirieh A, Nesbit MA, Ali A, et al: Functional analysis of a novel GATA3 mutation in a family with the hypoparathyroidism, deafness, and renal dysplasia syndrome. J Clin Endocrinol Metab 90: 2445-50, 2005
- Ali A, Christie PT, Grigorieva IV, et al: Functional characterization of GATA3 mutations causing the hypoparathyroidism-deafness-renal (HDR) dysplasia syndrome: insight into mechanisms of DNA binding by the GATA3 transcription factor. Hum Mol Genet 16: 265-75, 2007
- Fukami M, Muroya K, Miyake T, et al: GATA3 abnormalities in six patients with HDR syndrome. Endocr J 58: 117-21, 2011
- Kahaly GJ: Polyglandular autoimmune syndromes. Eur J Endocrinol 161: 11-20, 2009
- Michels AW, Gottlieb PA: Autoimmune polyglandular syndromes. Nat Rev Endocrinol 6: 270-7, 2010
- Akirav EM, Ruddle NH, Herold KC: The role of AIRE in human autoimmune disease. Nat Rev Endocrinol 7: 25-33, 2011
- Betterle C, Garelli S, Presotto F: Diagnosis and classification of autoimmune parathyroid disease. Autoimmun Rev 13:417-22, 2014
- Cheng MH, Fan U, Grewal N, et al: Acquired autoimmune polyglandular syndrome, thymoma, and an AIRE defect. N Engl J Med 362: 764-6, 2010
- Parfitt AM: Surgical, idiopathic, and other varieties of parathyroid hormone-deficient hypoparathyroidism, in DeGroot LJ, Cahill GF, Jr., Odell WD. (eds): Endocrinology. New York, Grune & Stratton, 1979, pp 755-7
- Gass JDM: The syndrome of keratoconjunctivitis, superficial moniliasis, idiopathic hypoparathyroidism and Addison's disease. Am J Ophthalmol 54:660-674, 1962
- Tarkkanen A, Merenmies L: Corneal pathology and outcome of keratoplasty in autoimmune polyendocrinopathy-candidiasis-ectodermal dystrophy (APECED). Acta Ophthalmol Scand 79:204-207, 2001
- Stieglitz LN, Kind HP, Kazdan JJ, et al: Keratitis with hypoparathyroidism. Am J Ophthalmol 84:467-472, 197
- Alimohammadi M, Björklund P, Hallgren A, et al: Autoimmune polyendocrine syndrome type 1 and NALP5, a parathyroid autoantigen. N Engl J Med 358: 1018-28, 2008
- Kemp EH, Habibullah M, Kluger N, et al: Prevalence and clinical associations of calcium-sensing receptor and NALP5 autoantibodies in Finnish APECED patients. J Clin Endocrinol Metab 99: 1064-1071, 2014
- Oftedal BE, Wolff AS, Bratland E, et al: Radioimmunoassay for autoantibodies against interferon omega; its use in the diagnosis of autoimmune polyendocrine syndrome type I. Clin Immunol 129: 163-9, 2008
- Cervato S, Morlin L, Albergoni MP, et al: AIRE gene mutations and autoantibodies to interferon omega in patients with chronic hypoparathyroidism without APECED. Clin Endocrinol (Oxf) 73: 630-6, 2011
- Tanaka A, Sakaguchi S: Early life Aire: the development of particular T cells at a specific time prevents autoimmunity. Science 348: 506-507, 2015
- Yang S, Fujikado N, Kolodin D, Benoist C, Mathis D: Immune tolerance. Regulatory T cells generated early in life play a distinct role in maintaining self-tolerance. Science 348: 589-594, 2015
81. Linglart A, Bastepe M, Jüppner H: Similar clinical and laboratory findings in patients with symptomatic autosomal dominant and sporadic pseudohypoparathyroidism type Ib despite different epigenetic changes at the GNAS locus. Clin Endocrinol (Oxf) 67:822-31, 2007
82. Mantovani G, Elli FM, Spada A: GNAS epigenetic defects and pseudohypoparathyroidism: time for a new classification? Horm Metab Res 44:716-23, 2012
83. Lemos MC, Thakker RV: GNAS mutations in pseudohypoparathyroidism type 1a and related disorders. Hum Mutat 36:11-9, 2015
- Turan S, Bastepe M: GNAS spectrum of disorders. Curr Osteoporos Rep 13:146-58, 2015
- Namnoum AB, Merriam GR, Moses AM, et al: Reproductive dysfunction in women with Albright's hereditary osteodystrophy. J Clin Endocrinol Metab 83:824-829, 1998
- Archibald RM, Finby N, De Vito F: Endocrine significance of short metacarpals. J Clin Endocrinol Metab 19:1312-22, 1959
- Chase SR, Melson GL, Aurbach GD. Pseudo hypoparathyroidism: defective excretion of the 3’,5’,-AMP in response to parathyroid hormone. J Clin Invest 48:1832-44, 1969
- Fitch N: Albright's hereditary osteodystrophy: A review. Am J Med Genet 11:11-29, 1982
- Yamamoto Y, Noto Y, Saito M, et al: Spinal cord compression by heterotopic ossification associated with pseudohypoparathyroidism. J Int Med Res 25:364-368, 1997
90. Tuchman S: Disorders of mineral metabolism in the newborn. Curr Pediatr Rev 10:133-41, 2014
91. Diaz-Soto G, Linglart A, Sénat MV, Kamenicky P, Chanson P et al: Primary hyperparathyroidism in pregnancy. Endocrine 44:591-7, 2013
- Powell BR, Buist NR: Late presenting, prolonged hypocalcemia in an infant of a woman with hypocalciuric hypercalcemia. Clin Pediatr 29:241-243, 1990
- de Baaij JH, Hoenderop JG, Bindels RJ: Magnesium in man: implications for health and disease. Physiol Rev 95:1-46, 2015
- Konrad M, Schlingmann KP: Inherited disorder of renal hypomagnesaemia. Nephrol Dial Transplant 29: iv63-iv71, 2014
- Schlingmann KP, Weber S, Peters M, et al: Hypomagnesemia with secondary hypocalcemia is caused by mutations in TRPM6, a new member of the TRPM gene family. Nat Genet 31:166-170, 2002
- Walder RY, Landau D, Meyer P, et al: Mutation of TRPM6 causes familial hypomagnesemia with secondary hypocalcemia. Nat Genet 31:171-174, 2002
- Howard SC, Jones DP, Pui CH: The tumor lysis syndrome. N Engl J Med 364:1844-54, 2011
- Schussheim DH, Jacobs TP, Silverberg SJ: Hypocalcemia associated with alendronate. Ann Intern Med 130:329, 1999
- Sims EC, Rogers PB, Besser GM, et al: Severe prolonged hypocalcaemia following pamidronate for malignant hypercalcaemia. Clin Oncol 10:407-409, 1998
100. Epperla N, Pathak R: Hypocalcemia secondary to zoledronate therapy in a patient with low vitamin D level. WMJ 114:163-6, 2015
101. Block GA, Bone HG, Fang L, Lee E, Padhi D: A single-dose study of denosumab in patients with various degrees of renal impairment. J Bone Miner Res 27:1471-9, 2012
- Ghanaat F, Tayek JA: Hungry bone syndrome: a case report and review of the literature, Nutr Res 24: 633–638, 2004
- Dettelbach MA, Deftos LJ, Stewart AF: Intraperitoneal free fatty acids induce severe hypocalcemia in rats: A model for the hypocalcemia of pancreatitis. J Bone Miner Res 5:1249-1255, 1990
- Lind L, Carlstedt F, Rastad J, et al: Hypocalcemia and parathyroid hormone secretion in critically ill patients. Crit Care Med 28:93-99, 2000
- Zivin JR, Gooley T, Zager RA, et al: Hypocalcemia: A pervasive metabolic abnormality in the critically ill. Am J Kidney Dis 37:689-698, 2001
- Chern JP, Lin KH: Hypoparathyroidism in transfusion-dependent patients with beta-thalassemia. J Pediatr Hematol Oncol 24:291-293, 2002
- Angelopoulos NG, Goula A, Rombopoulos G, et al: Hypoparathyroidism in transfusion-dependent patients with beta-thalassemia. J Bone Miner Metab 24:138-45, 2006
- Toumba M, Sergis A, Kanaris C, Skordis N: Endocrine complications in patients with thalassemia major. Pediatr Endocrinol Rev 5:642-8, 2007
- Kagen MH, Bansal MG, Grossman M: Calcinosis cutis following the administration of intravenous calcium therapy. Cutis 65:193-194, 2000
- Bollerslev J, Rejnmark L, Marcocci C, et al: European Society of Endocrinology Clinical Guideline: treatment of chronic hypoparathyroidism in adults. Eur J Endocrinol 173: G1-G20, 2015
- Umpaichitra V, Bastian W, Castells S: Hypocalcemia in children: Pathogenesis and management. Clin Pediatr 40:305-312, 2001
- Arlt W, Fremerey C, Callies F, et al: Well-being, mood and calcium homeostasis in patients with hypoparathyroidism receiving standard treatment with calcium and vitamin D. Eur J Endocrinol 146:215-222, 2002
- Underbjerg L, Sikjaer T, Mosekilde, Rejnmark L: Cardiovascular and renal complications to postsurgical hypoparathyroidism: A Danish nationwide controlled historic follow-up study. J Bone Min Res 28: 2277-2285, 2013
- Underbjerg L, Sikjaer T, Mosekilde, Rejnmark L: Postsurgical hypoparathyroidism – risk of fractures, psychiatric diseases, cancer, cataract, and infections. J Bone Min Res 29: 2504-10, 2014
- Underbjerg L, Sikjaer T, Mosekilde, Rejnmark L: The epidemiology of non-surgical hypoparathyroidism in Denmark: a nationwide case finding study. J Bone Min Res 30: 1738-44, 2015
- Winer KK, Yanovski JA, Sarani B, Cutler GB Jr: A randomized, cross-over trial of once-daily versus twice-daily parathyroid hormone 1-34 treatment of hypoparathyroidism. J Clin Endocrinol Metab 83: 3480-86, 1998
- Winer KK, Ko CW, Reynolds JC, et al: Long-term treatment of hypoparathyroidism: a randomized controlled study comparing parathyroid hormone-(1-34) versus calcitriol and calcium. J Clin Endocrinol Metab 88: 4214-20, 2003
- Winer KK, Sinaii N, Peterson D, Sainz B Jr, Cutler GB Jr: Effects of once versus twice-daily parathyroid hormone 1-34 therapy in children with hypoparathyroidism. J Clin Endocrinol Metab 93: 3389-95, 2008
- Winer KK, Sinaii N, Reynolds J, et al: Long-term treatment of 12 children with chronic hypoparathyroidism: a randomized trial comparing synthetic human parathyroid hormone 1-34 versus calcitriol and calcium. J Clin Endocrinol Metab 95: 2680-88, 2010
- Winer KK, Zhang B, Shrader JA, et al: Synthetic human parathyroid hormone 1-34 replacement therapy: a randomized crossover trial comparing pump versus injections in the treatment of chronic hypoparathyroidism. J Clin Endocrinol Metab 97: 391-99, 2012
- Rubin JR, Sliney J Jr, McMahon DJ, Silverberg SJ, Bilezikian JP: Therapy of hypoparathyroidism with intact parathyroid hormone. Osteo Int 21: 1927-34, 2010
- Cusano NE, Rubin MR, McMahon DJ, et al: PTH(1-84) is associated with improved quality of life in hypoparathyroidism through 5 years of therapy. J Clin Endocrinol Metab 99:3694-9, 2014
123. Sikjaer T, Amstrup AK, Rolighed L, et al: PTH(1-84) replacement therapy in hypoparathyroidism: a randomized controlled trial on pharmacokinetic and dynamic effects after 6 months of treatment. J Bone Miner Res 28:2232-43, 2013
- Mannstadt M, Clarke BL, Vokes T, et al: Efficacy and safety of recombinant human parathyroid hormone (1-84) in hypoparathyroidism (REPLACE): a double-blind, placebo-controlled, randomised phase 3 study. Lancet Diabetes Endocrinol 1: 275-83, 2014
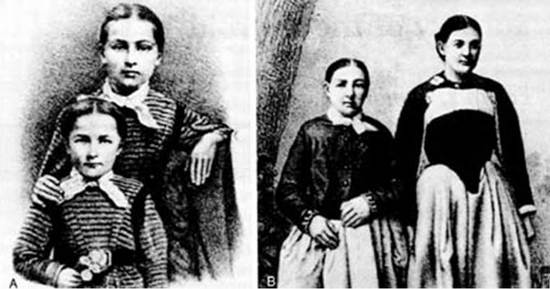
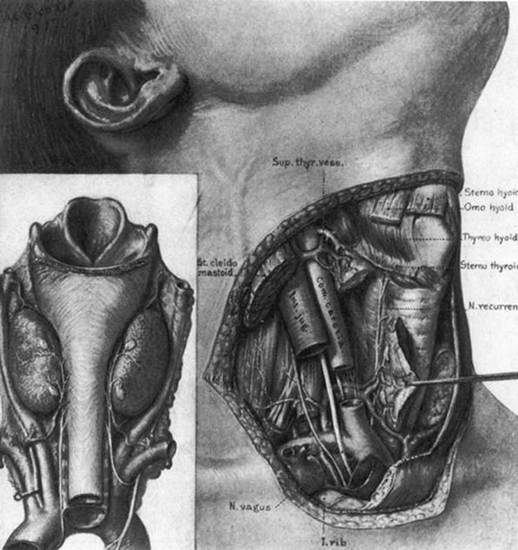
![Figure 3. Anatomy of the thyroid and parathyroid glands. A , Anterior view. B , Lateral view with the thyroid retracted anteriorly and medially to show the surgical landmarks (the head of the patient is to the left). (From Kaplan EL: Thyroid and parathyroid. In Schwartz SI [ed: Principles of Surgery, 5th ed. New York, McGraw-Hill, 1989, pp 1613–1685. Copyright © by McGraw-Hill, Inc. Used by permission of McGraw-Hill Book Company.)”]](http://www.thyroidmanager.org/wp-content/uploads/2011/06/35-3.png)
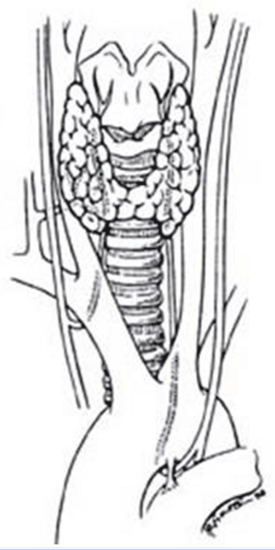
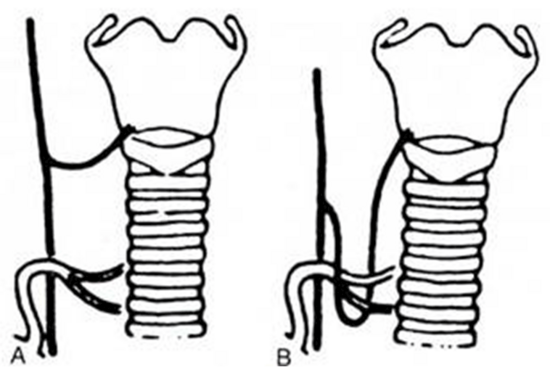
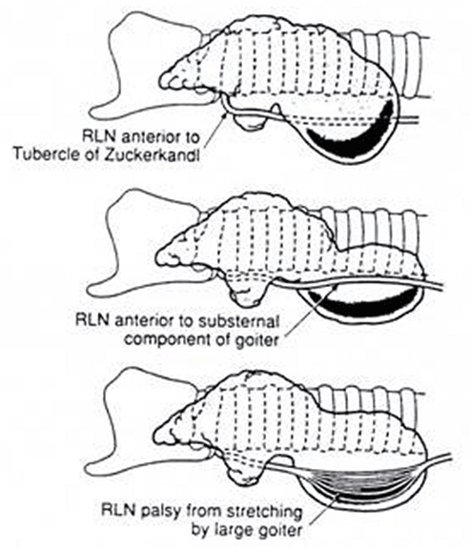
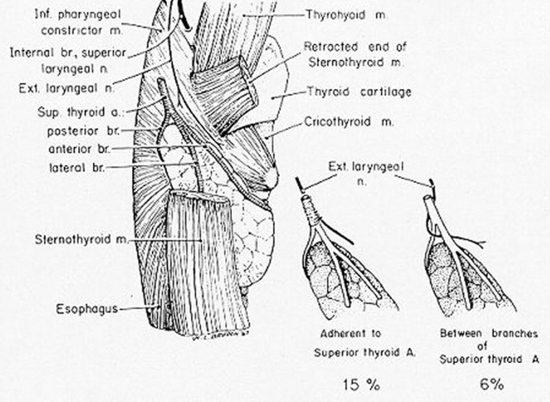
![Figure 7. A and B, Shifts in location of the thyroid, parafollicular, and parathyroid tissues. C, approximates the adult location. Note that what has been called the lateral thyroid is now commonly referred to as the ultimobranchial body, which contains both C cells and follicular elements. (From Sedgwick CE, Cady B: Surgery of the Thyroid and Parathyroid Gland, 2nd ed. Philadelphia, WB Saunders, 1980; adapted from Norris EH: Parathyroid glands and lateral thyroid in man: Their morphogenesis, histogenesis, topographic anatomy and prenatal growth. Contrib Embryol Carnegie Inst Wash 26:247–294, 1937.) Principles of Surgery, 5th ed. New York, McGraw-Hill, 1989, pp 1613–1685. Copyright © by McGraw-Hill, Inc. Used by permission of McGraw-Hill Book Company.)”]](http://www.thyroidmanager.org/wp-content/uploads/2011/06/35-7.png)
![Figure 8. Descent of the lower parathyroid. Whereas the upper parathyroid occupies a relatively constant position in relation to the middle or upper third of the lateral thyroid lobe, the lower parathyroid normally migrates in embryonic life and may end up anywhere along the course of the dotted line. When this gland is in the chest, it is nearly always in the anterior mediastinum. (From Kaplan EL: Thyroid and parathyroid. In: Principles of Surgery, Schwartz SI [ed], 6th edition, Chpt 36, McGaw-Hill, Inc., New York, NY, 1993, pp 1611-1680).](http://www.thyroidmanager.org/wp-content/uploads/2011/06/35-8.png)