ABSTRACT
Prostate cancer is the second most common cause of male cancer deaths in Western countries. However, one of the most contentious topics in medicine continues to be whether testing for this very common tumor is in the best interests of individual patients. Although there is a spectrum of progression rates for this tumor, in most instances, prostate cancer replicates and spreads slowly. As this tumor is uncommonly diagnosed before the age of 40 years and the likelihood of clinical detection increases as men age, most patients have comorbidities when diagnosed with prostate cancer. For this reason and because there are not insignificant potential disadvantages with the detection process and its consequences, it is important to determine whether the benefits of detection are likely to be greater than the unwanted effects of leaving a possible prostate cancer undiagnosed. In this Endotext chapter, the likelihood of a detectable prostate cancer being present is placed in context of patients’ ages and co-morbidies before detailing the tests currently used in clinical practice, together with their limitations. For complete coverage of all related areas of Endocrinology, please visit our on-line FREE web-text, WWW.ENDOTEXT.ORG.
INTRODUCTION AND BACKGROUND
Prostate Cancer is an increasingly common diagnosis in Western societies with over 240 000 diagnoses made in the US (1), as well as 196,200 in Asia and 417,100 in Europe each year (2). There is a wide range in the incidence of prostate cancer across the globe with the highest rates in developed countries, being more than four-fold higher than less developed regions for a slightly lower mortality (3), although non-Westernized societies are changing as reported recently in relation to the Asia-Pacific region (4)(Figure 1). These differences are likely multifactorial, including genetic, environmental, detection, and reporting differences. As reported for 2012, Australia and New Zealand now has had the highest age-standardized incidence (111.6) and cumulative risk (13.6% by age 75) of prostate cancer in the world, with a high incidence observed in Northern America (97.2) and Western Europe (94.9).
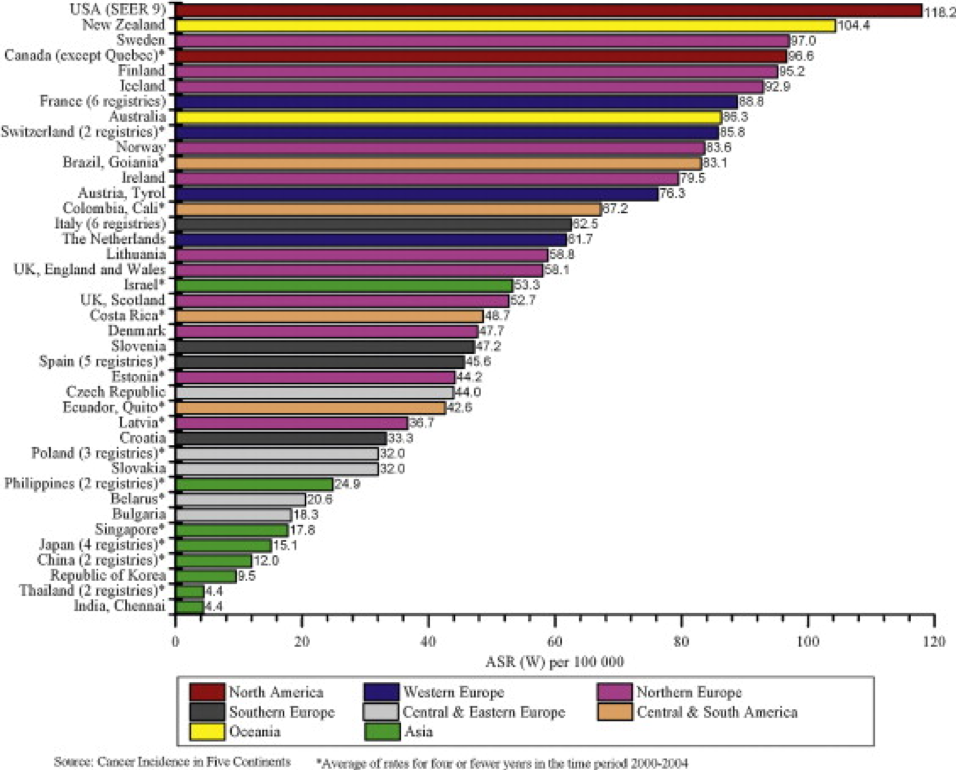
Figure 1: Prostate Cancer Incidence Rates for Select Registries, 2000–2004 (5)
Mortality rates vary from country to country as well (6-7)with prostate cancer following lung and bowel cancers in Europe and Australia in terms of mortality rates. Worldwide, Caribbean and African populations display the highest prostate cancer mortality rates (Figure 2) (3). This disparity is also likely multifactorial and additionally includes factors related to treatment availability and practices.
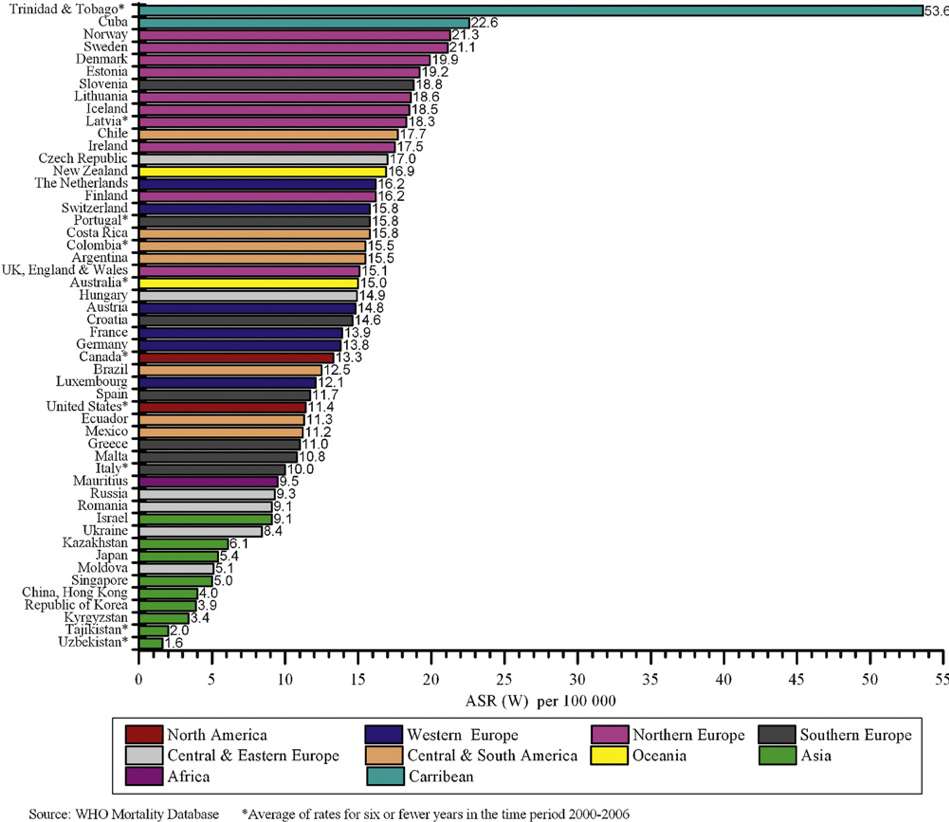
Figure 2: Prostate Cancer Age-Standardized Mortality Rates for Selected Registries, 2000–2006 (5)
Despite advances in prevention and early detection, refinements in surgical technique and improvements in radiotherapy and chemotherapy, the ability to cure many patients remains elusive. However, mortality rates are changing albeit slowly as illustrated in blue below for Australia. A 2013 report by the Australian Institute of Health and Welfarepredicts that by 2020 only 26 out of 100,000 Australian men will die from the disease compared with 34 in 1982 (Figure 3) (8).
This phenomenon is not peculiar to Australia. Baade et al reviewed international trends in prostate cancer mortality and reported significant reductions in prostate-cancer mortality in the UK, USA, Austria, Canada, Italy, France, Germany, Australia and Spain with downward trends in the Netherlands, Ireland and Sweden (9). This has subsequently been observed by others (4,10).
Earlier detection of this disease, as a consequence of the introduction of the prostate specific antigen (PSA) blood test, has been acknowledged by the NCI as one factor contributing to lowering the mortality rate over the past few years (11-14). The use of PSA testing has been estimated to provide a diagnostic lead-time of up to 10 years (15-19). In the mid to late 1980s only one third of prostate cancers were diagnosed at curable stages compared with today when 80% are staged clinically as organ-confined and potentially curable (20-22). Unfortunately, however, even when the tumor is thought to be localized, up to 25% of men have non-localized disease which declares itself subsequently (23).
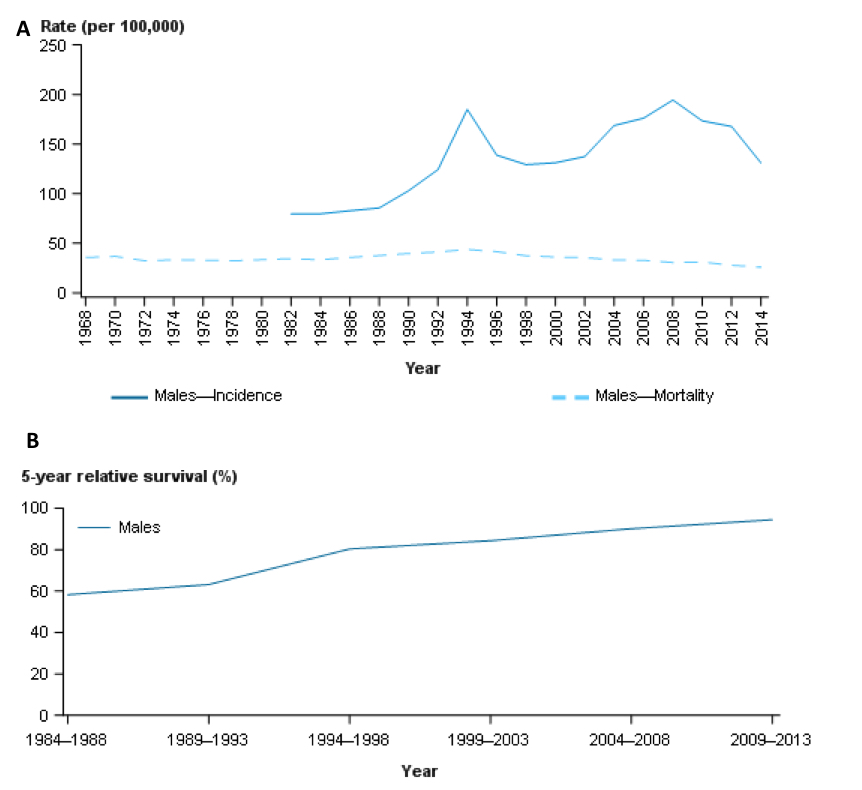
Figure 3: Panel A – Incidence (solid line) during 1982 – 2014 in Australia demonstrating a rise after widespread availability of PSA testing with a dip after the prostate cancer backlog was addressed: mortality (dashed line) has been falling slowly since the mid-1990s. Panel B – 5-year relative survival from prostate cancer, 1984–1988 to 2009–2013 in Australia demonstrated a reciprocal improvement since the mid-1990s https://prostate-cancer.canceraustralia.gov.au/statistics
Since curative treatments are limited to localized tumors (11-12,15,24), extending effective but non-invasive treatments to include both primary and secondary lesions remains a major goal and challenge. Once prostate cancer metastasizes, apart from causing loss of life, the toll it exacts is often considerable with regard to morbidity from both the disease itself and administered therapies.
As a result of increasing numbers of men having their prostate cancers diagnosed earlier, more patients are now eligible for treatment with curative intent. Improved surgical and radiation-based treatments have been developed so that the prognosis of a man diagnosed today with prostate cancer is better than ever before.
ANATOMY AND PHYSIOLOGY
The word "prostate", originally derived from the Greek prohistani which means "to stand in front of," has been attributed to Herophilus of Alexandria who used the term in 355 BC to describe the small organ located in front of the bladder (25). The prostate gland is a small firm structure, about the size of a chestnut, located below the bladder and in front of the rectum (Figure 4). The urethra, the channel through which urine is voided, passes from the bladder through the prostate and penis (Figure 5).

Figure 4: The Normal Prostate and its Relationship to Other Pelvic Structures
The primary function of the prostate gland, which contracts with ejaculation, is to provide enzymes to maintain the fluid nature of seminal fluid and to nourish sperm as they pass through the prostatic and penile urethra to outside the body.
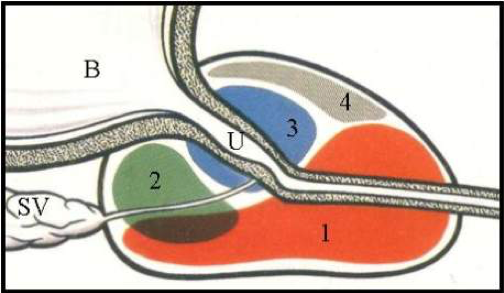
Figure 5: Zonal Anatomy of the Prostate (sagittal depiction)
1 = peripheral zone - the zone where most cancers originate
2 = central zone – zone in which middle lobe develops
3 = transition zone – zone in which BPH ‘lateral lobes’ form
4 = anterior zone
B = bladder
U = urethra
NATURAL HISTORY OF PROSTATE CANCER
Traditionally, prostate cancer was considered to be a disease of "older men." As such, it was generally accepted that "men never died fromprostate cancer, they died of other conditions with prostate cancer." Consequently, treatment was conservative and directed toward palliation and management of any debilitating and painful sequelae. In addition, diagnosis from histopathology from a biopsy was generally made after palpating a rock-hard and nodular prostate on digital rectal exam [DRE] or by symptoms and signs of primary or secondary tumors, such as urinary obstruction, back pain, nerve root or, less commonly, spinal cord compression. In a large majority of cases, tumors had already disseminated at the time of diagnosis and, therefore, were incurable. It was in the mid-1980s, with the introduction of the PSA blood test that prostate cancer began to be diagnosed earlier and in younger men.
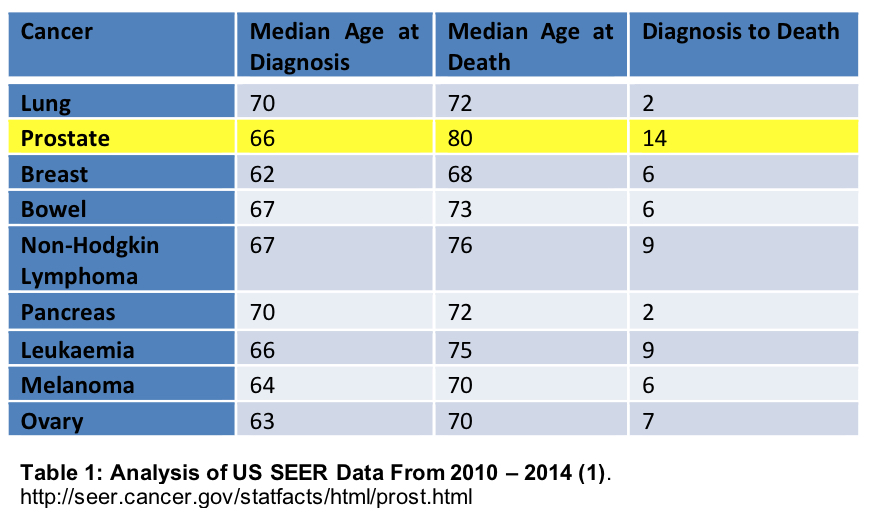
Prostate cancer is usually slow in its development and in the majority of cases, slow to progress as is illustrated in Table 1 below from Surveillance Epidemiology and End Results (SEER) registry: SEER collects and publishes cancer incidence and survival data from population-based cancer registries covering approximately 28% of the population of the United States(1).
If autopsy findings are an indication, premalignant and inapparent tumors are very common with one United States study indicating that, of 249 cases examined, 70% of the prostates with the premalignant condition high grade prostate intra-epithelial neoplasia (HGPIN) harbored adenocarcinoma, whereas the frequency of cancerin prostates without HGPIN was 24%. HGPIN was encountered in 0, 5, 10, 41 and 63% of men in the 3rd, 4th, 5th and 7th decades, respectively. The corresponding figures for invasive carcinoma were 2, 29, 32, 55 and 64% respectively (26).
Although methods of diagnosis and treatment of localized disease have become well-entrenched, they are beginning to change. However, both early detection through PSA screening and the management of prostate cancer remain controversial. The tumor has a variable biologic course, the traditional biopsy approach is invasive, costly and clinical staging of tumors is imprecise. Furthermore, there are significant limitations in prediction of the clinical outcome of patients with both organ-confined and extra-prostatic disease - not to mention the morbidity associated with all currently established treatments. It is sobering to muse that, were the unwanted effects of diagnosis and treatment insignificant, the dilemma of whether or not to diagnose and treat would not be issues.
COMPETING MORBIDITIES AND LIFE EXPECTANCY: COMPARISONS
The likelihood of men dying from causes other than from prostate cancer increases with ageing because of competing mortalities (as indicated by Figure 6 below), in particular cardiovascular and cerebrovascular diseases (Figure 6 below): the fact that most prostate cancers progress slowly compared with other cancers needs to be considered in terms of life expectancy from competing causes of death. Life expectancy has been reported to be increasing for Australian men, recently estimated to be 80.4 years from birth, the 7thhighest worldwide, and 84.5 years at age 65(27). Calculation of life expectancy is difficult; however, use of statistically calculated “life tables”, based on population estimates, may provide the most accurate prediction.
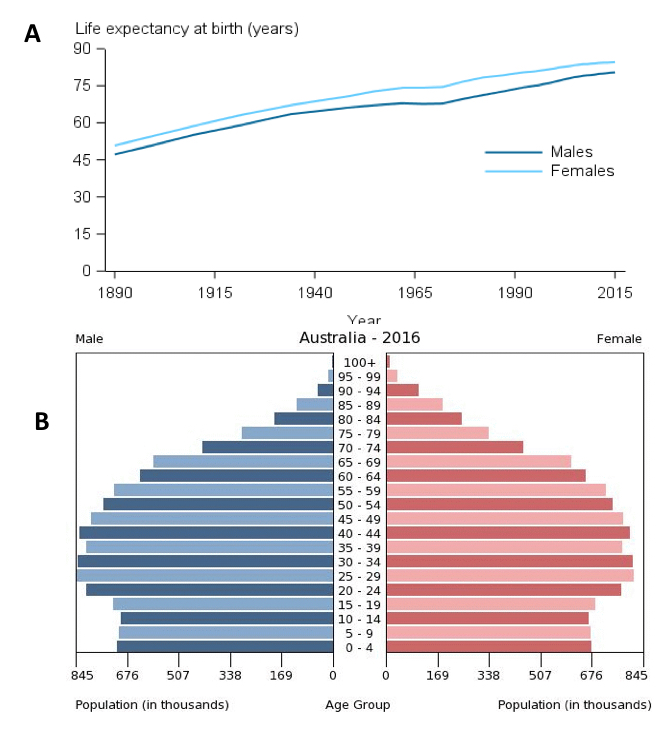
Figure 6: Panel A – life expectancy estimates for Australian men and women since 1890. Panel B – Population pyramid for Australia in 2016, demonstrating the proportion of population for each age group. Available from: https://www.aihw.gov.au/reports/life-expectancy-death/deaths-in-australia/contents/life-expectancy
If death from prostate cancer is compared with the likelihood of death from other conditions, the older a man, the greater is the likelihood that another condition will be the cause of his demise; in Australia in 2009, one in three male deaths was attributed to cardiovascular disease (28).
The following graphs (Figure 7) from the Australian Government website show approximately parallel increases for incidence and death from prostate cancer, estimated to be 23 years apart (Figure 7). Consequently, if death is the endpoint being addressed, the patient’s life expectancy, based on his age and comorbidities, needs to be considered in the context of the natural history of his disease.
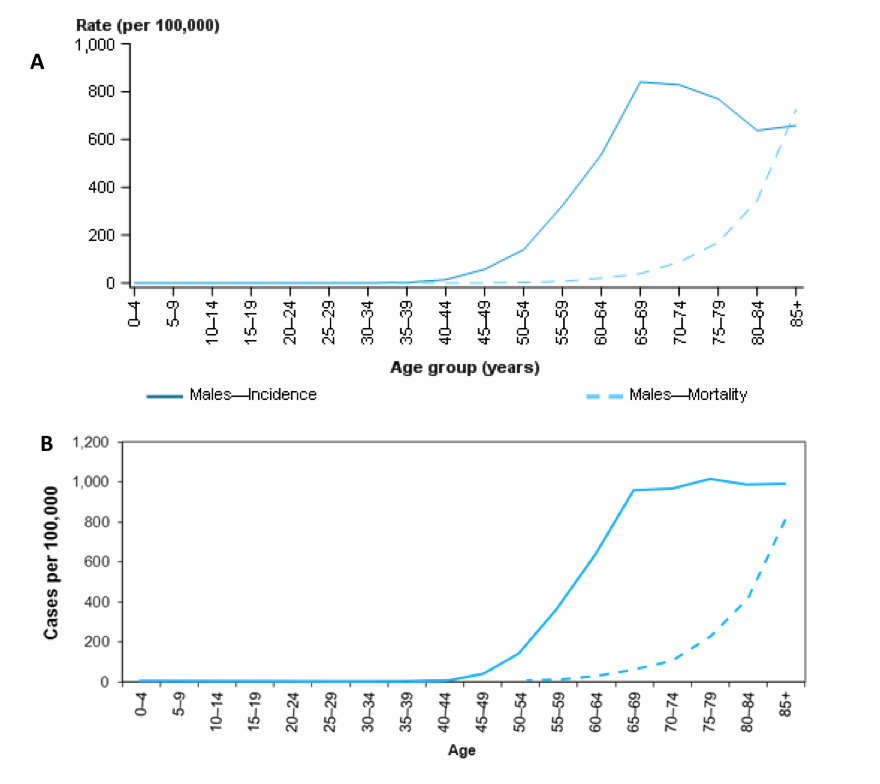
Figure 7: Estimated age-specific incidence (solid line) and mortality (dashed line) rates for prostate cancer, 2017 (Panel A), compared with 2007 (Panel B) (https://prostate-cancer.canceraustralia.gov.au/statistics)
TARGETING PROSTATE CANCER AT-RISK POPULATIONS
Major genetic epidemiologic studies published in the last two decades support the notion that prostate cancer may exist as clusters in families. In the 1980s, a Utah Mormon genealogy study found that prostate cancer exhibited the fourth strongest degree of familial clustering after lip, melanoma, and ovarian cancers (29). Prostate cancer, interestingly, had a higher familial association than either colon or breast carcinoma, to which patients are known to be predisposed by genetic or familial components. A later study determined cancer pedigrees in 691 men with prostate cancer and 640 spouse controls and found that men with an affected father or brother were twice as likely to develop prostate cancer as men with no affected relatives (30). Although these findings strongly suggest that familial clustering of prostate cancer risk does exist, they did not address the underlying etiological mechanisms. Indeed, familial clustering can reflect either shared environmental and lifestyle risk factors, or a genetic mechanism, or both.
To determine what might distinguish hereditary prostate cancer from its sporadic counterparts, a number of clinical features of prostate cancer were examined by Carter, et al.(31). Clinical stage at presentation, pre-operative PSA, final pathologic stage, and prostate weight were examined in a series of approximately 650 patients divided among three categories. Individuals were classified as having hereditary disease if 3 or more relatives were affected in a single generation, prostate cancer occurred in each of 3 successive generations in either paternal or maternal lineages, or 2 relatives were affected under the age of 65 years. For the other groups, either no other family members were affected (sporadic disease), or other family members were affected but not to the extent found in families classified as hereditary. In summary, no unique clinical or pathological characteristics distinguished hereditary prostate cancer in this group of patients. This parallel between hereditary and sporadic prostate cancer also extends to the incidence of multifocality found in both of these categories.
These findings were supported by Brandt et al (2011) in an analysis of the nationwide Swedish Family-Cancer Database between 1961 and 2006. They found that the age-specific hazard ratio of prostate cancer diagnosis increased with the number of affected relatives and decreased with increasing age. The highest hazard ratios were observed for men <65 yr. of age with three affected brothers (approximately 23) and the lowest for men between 65 and 74 yr. of age with an affected father (HR: approximately 1.8). The hazard ratios increased with decreasing paternal or fraternal diagnostic age. The pattern of the risk of death from familial prostate cancer was similar to the incidence data (32). A similar study also from Sweden determined that a positive family history was a risk factor for developing prostate cancer and most pronounced in younger men (aged 45-49 years) (33). A vast array of molecular alterations implicated in sporadic and familial prostate cancer have been described (34)and reported to account for 30% of familial risk (35).
However, there are differences between hereditary and sporadic prostate cancers. The onset of hereditary prostate cancer is, on average, 6 years earlier than for sporadic cancer. Although the clinical course is in no way different and the pathological characteristics are the same in most instances (36), patients with a family history of germ-line mutations in the family-susceptibility genes BRCA1 and BRCA2 , in particular the latter, and G84E mutation in HOXB13(37), have a significantly increased susceptibility for developing this malignancy. Furthermore, these patients tend to present at a younger age, have more aggressive and disseminated disease with poorer survival outcomes [31-6](38-44). Targeted screening of at risk men has been performed, with the IMPACT study reporting a higher positive predictive value of PSA and detection of intermediate- or high-risk disease in BRCA2 mutation carriers(45).
TESTS USED IN DIAGNOSING PROSTATE CANCER
In evaluating this issue, it is important to appreciate that the diagnostic approach is a two-step process that begins with the decision about whether or not to have a Prostate Specific Antigen (PSA) blood test (+/- other investigations) and, secondly, to confirm a suspected diagnosis of prostate cancer by biopsy for histopathology. Most men with a PSA level less than 10ng/ml will have a normal feeling prostate on digital rectal examination (DRE), hence the removal of DRE by non-urologists from many guidelines.
The FDA initially approved PSA testing in 1986 for monitoring the disease status of prostate cancer patients and, subsequently in 1994, it was endorsed as a screening method for prostate cancer (46). The PSA blood test is a continuous variable with no cut point (47)so that very low levels don’t completely exclude the possibility that prostate cancer is present(48-50), but the higher the serum PSA the greater the likelihood of prostate cancer being detectable. Importantly, PSA doesn’t distinguish between those who do and do not have cancer or identify those whose cancers will benefit from curative treatment. PSA increases with a number of conditions including prostate cancer, but the most common associated pathology is the non-cancerous condition benign prostatic hyperplasia (BPH) which is the cause, in most instances, of bladder outlet obstruction in men.
Factors Affecting PSA Measurements
Themedicationfinasteridewhich targets the 5-α-reductase type 2 enzyme and the more recently available drug, dutasteride, which inhibits both type 1 and type 2 enzymes, affect theconversion of testosterone to dihydrotestosterone (DHT) in prostatic cells. They reduce prostate volume with comparable effectiveness, with their designated clinical role being to decrease bladder outflow obstruction responsible for lower urinary tract symptoms (LUTS) present in a large number of older men. In reducing the benign prostatic hyperplasia (BPH) component of the prostate, both finasteride and dutasteride also reduce serum PSA levels by ~50% within 6 months of treatment. However, with the influence of the non-cancer BPH component significantly reduced, PSA changes are more likely to indicate prostate cancer. For patients taking finasteride or dutasteride, an increase in PSA of >0.3 ng/ml from nadir is generally regarded as an indication for further investigation based on the findings of Marks et al (2006) who determined that applying this recommendation resulted in a 71% sensitivity and a 60% specificity for prostate cancer being detected in men receiving dutasteride (51). Use of dutasteride may also affect interpretation of multiparametric MRI (mpMRI) and require a reduced biopsy threshold(52).
Concerns with respect to finasteride use and subsequent prostate cancer were addressed by long-term data from the Prostate Cancer Prevention Trial. Results confirmed that finasteride reduced the risk of prostate cancer by about one third but also found that high-grade prostate cancer was more commonly found on biopsy in the finasteride group than in the placebo group. However, after 18 years of follow-up, there was no significant difference between-groups in the rates of overall survival or survival after the diagnosis of prostate cancer (53).
Other non-malignant causes affecting serum PSA levels include prostatic infection and ageing since prostates tend to become larger as men get older (54). Instrumentation of the prostate and urinary tract can also raise PSA levels (55)as can bacterial or severe prostatitis, both of these capable of resulting in sudden rises in this enzyme (Figure 8).
Testosterone supplementation is commonly used for hypogonadism and might intuitively complicate interpretation of serum PSA levels. However, available data suggests that testosterone supplementation does not significantly increase serum PSA (0.1 ng/mL; 95% CI -0.28 – 0.48)(56-57), prostate size, intraprostatic testosterone, or prostate cancer incidence and progression in men with pre-treatment serum testosterone higher than 5 – 7 nmol/L (144 - 202 ng/dl(58). Testosterone therapy also causes minimal changes in lower urinary tract symptoms, with 77.5% of patients on supplementation having similar or improved symptoms for change in PSA of 0.44 (+/- 2.2)(59).

Figure 8: Factors Affecting Levels of Serum PSA(56-57) (60)
Efforts to improve the diagnostic accuracy of PSA have incorporated age-related reference ranges, which vary according to race (61-62)within and between countries. The normal age-related reference ranges are outlined below for European descent, Japanese, Chinese, Taiwanese, Singaporean and Korean men, as well as between Caucasian (Whites) and African-American (Blacks) men from the United States (Figures 9 – 14).
Furthermore, risk-stratification based on PSA for age is a newly adopted concept, recommended by the European Association of Urology and others, include longitudinal PSA testing for men with a PSA level >1 ng/ml at age 40 yr. or >2 ng/ml at age 60 yr. (63).
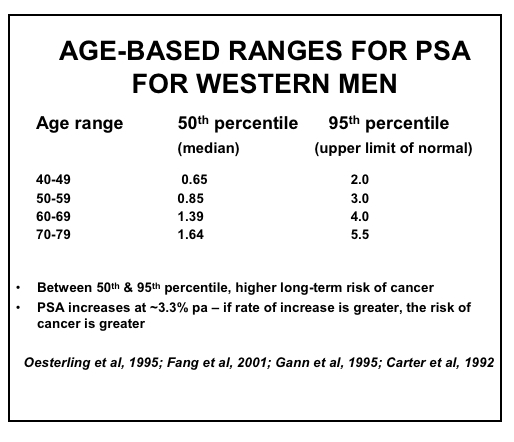

Figure 9: Age-based PSA Ranges for Men in Western Societies (19,61-62,64-66)

Figure 10: Age-based PSA Ranges for Japanese Men (67-70)
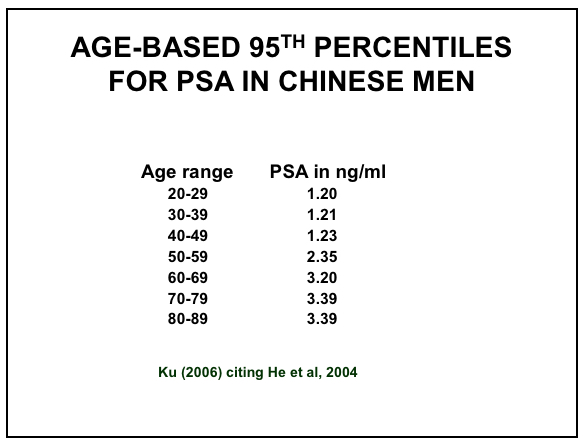
Figure 11: Age-based PSA Ranges for Chinese Men (67,71)
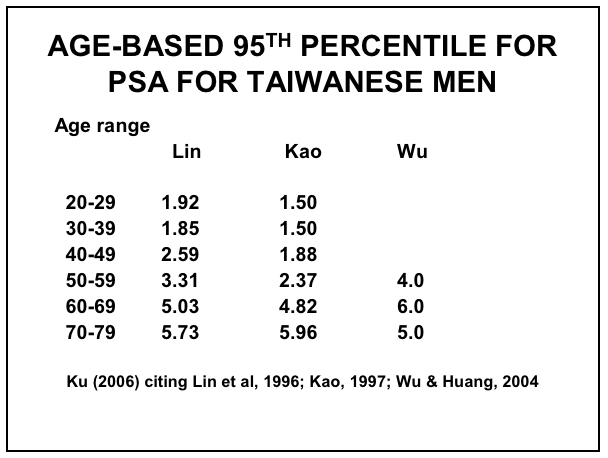
Figure 12: Age-based PSA Ranges for Taiwanese Men (67,72-74)
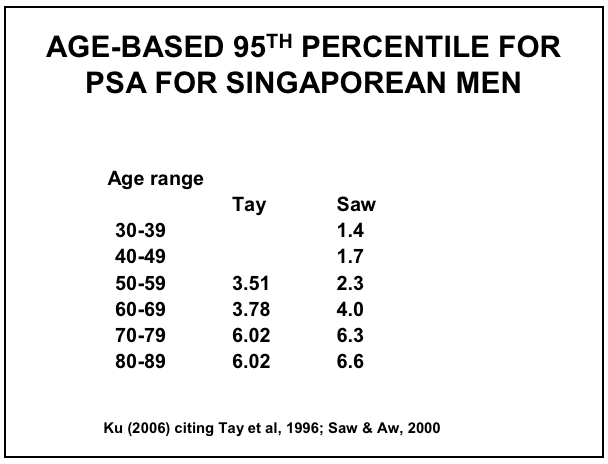
Figure 13: Age-based PSA Ranges for Singaporean Men (67,75-76)
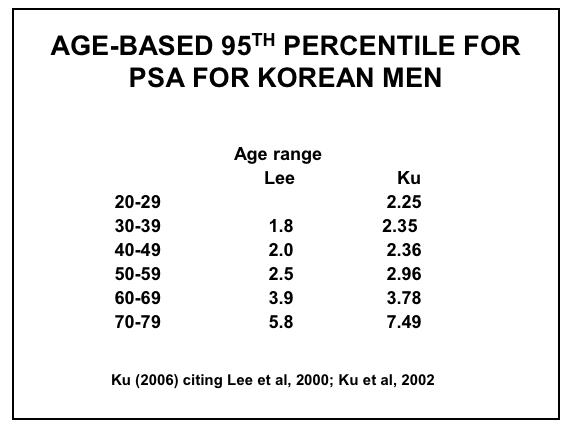
Figure 14: Age-based PSA Ranges for Korean Men (67,77-78)
Attempts to improve the predictability of serum PSA for prostate cancer have included measuring the rate of PSA change (PSA velocity) and its relationship to the size of the prostate (PSA density) since prostates vary a lot in size and tend to become bigger as men age. This variable, but overall increase, in prostate size with ageing prompted the introduction of age-related PSAvalues by laboratories, based on the populations tested. The free or unbound PSA and its relationship to total PSA (free: total PSA) is another variation with the higher the free component, the lower the likelihood of cancer: most recently, the prostate health index (PHI) has become available and has been promoted. These are discussed in some detail (below).
Total PSA
Of the tests available, total serum PSA is generally regarded as having the greatest utility, maintaining its predictive value for the detection of prostate cancer (79)even after a first biopsy shows no evidence of cancer in which setting its performance characteristics are only slightly decreased (80). However, as stated above, PSA is far from a perfect test with most men with a serum PSA less than 10 ng/ml not having prostate cancer detected with biopsy, while conversely the possibility remains that prostate cancer may be present even with very low PSA levels. In the Tyrol project, Pelzer et al (2005) found that prostate cancers detected in men with PSA levels <4 ng/ml were in younger patients and at lower stages (81).
In terms of reassurance, a PSA<1 ng/ml in a man aged 60 years has been reported to indicate an extremely low risk of clinically important prostate cancer in his lifetime. Although a 25-30 year risk of prostate cancer metastases could not be excluded by concentrations below the median at age 45-49 (0.68 µg/L) or 51-55 (0.85 µg/L), the 15-year risk remained low at 0.09% (0.03% to 0.23%) at age 45-49 and 0.28% (0.11% to 0.66%) at age 51-55 (82). This finding was supported by Aus et al who failed to find a single case of prostate cancer detected in 2950 screened men age 50-66 with a PSA <1ng/ml over a 3-year period (83).
Serum PSA Summary:
- Is a continuous variable with no cut point (47)
- Lodding et al (1998) found 15% of prostate cancers detected by investigating a PSA between 3 & 4 ng/ml had extraprostatic growth (49)
- In the Tyrol project, prostate cancers detected in men with PSA levels <4 ng/ml were in younger patients and at lower stages with smaller prostate volumes (81)
- Doesn’t indicate who will benefit from curative treatment (48)
- Total PSA remains the single most significant, clinically-used predictive factor for identifying men at increased risk of harboring cancer (79)
- For men 50-70 years, a PSA >1.5 ng/ml is a marker for greater than average risk up to 8 years (7.5-times greater risk versus 1.5 ng/ml or less) (79)
- Sustained rises in PSA indicate a significantly greater risk of prostate cancer, particularly high-grade disease
- A PSA <1 ng/ml in a man aged 60 years has been reported to indicate an extremely low risk of clinically important prostate cancer in his lifetime (50)
- Not a single case of prostate cancer was detected in in 3 years in 2950 screened men with a PSA <1ng/ml (83)
PSA Velocity (PSAV)
PSA is a labile enzyme with falsely high readings as a result of ejaculation within the previous 48 hours, vigorous (non-sexual) exercise, urethral instrumentation, and prostatic infections, as well as different assays providing slightly different readings. Therefore, a single PSA level should not be relied upon to indicate an increase in level. A rate of change of PSA (PSAV) >0.75 ng/ml in year in the absence of another contributing cause equates with an increased risk of a patient having cancer (84). Men taking the 5-α-reductase inhibitors, finasteride and dutasteride, have their serum PSA levels reduced by approximately 50% within 6 months. However, as stated above any sustained subsequent increase is more predictive for prostate cancer with an increase in PSA of 0.3 ng/ml from its nadir as a trigger for biopsy reported to provide 71% sensitivity & 60% specificity for prostate cancer for men who were receiving dutasteride (51).
For men not taking 5α reductase inhibitors, PSA increases >3.3% per annum have been reported to be associated with an increased risk of prostate cancer being detected by biopsy (19,65)and Makarov et al (2011) identified apreoperative PSA velocity >0.35 ng/ml/year to be associated with an increased risk of biochemical progression following radical prostatectomy (85). A more sinister association was observed by D’Amico et al (2004) who found that a PSA increase >2 ng/ml in the year before diagnosis conferred a high risk of death from prostate cancer despite radical prostatectomy (86). Loeb et al (2012) confirmed the adverse significance of a rapidly rising PSA, reporting that patients with two PSA velocity measurements of >0.4 ng/mL/year had an 8-fold increased risk of prostate cancer and a 5.4-fold increased risk of Gleason 8-10 disease on biopsy, adjusting for age and PSA level (87). The same author also concluded from an analysis of the Baltimore Longitudinal Study of Ageing that, since PSAV rose continuously with increasing PSA and was significantly higher in cancers than controls for PSA levels <3 ng/mL and 3-10 ng/mL, the PSA level should be taken into account when interpreting PSAV (88).
PSA Velocity Summary:
- A PSA increase >0.75 ng/ml per year increases the risk of prostate cancer (84); for men taking 5-α-reductase inhibitors (finasteride & dutasteride) a PSA increase of 0.3 ng/mL per year increases the risk of prostate cancer
- An increase in PSA of 0.3 ng/ml from nadir as a trigger for biopsy maintained 71% sensitivity & 60% specificity for prostate cancer in men receiving dutasteride (51)
- A PSA increase of >3.3% per annum = an increased risk of cancer (19,65)
- A preoperative PSA velocity >0.35 ng/ml/year = increased risk of biochemical progression following radical prostatectomy (85)
- A PSA increase >2 ng/ml in the year before diagnosis = high risk of death from prostate cancer despite radical prostatectomy (86)
- Men with two PSA velocity measurements of >0.4 ng/mL/year had an 8-fold increased risk of prostate cancer and 5.4-fold increased risk of Gleason 8-10 disease on biopsy, adjusting for age and PSA level (87)
- An analysis of Baltimore Longitudinal Study of Aging concluded that, since PSA velocity rose continuously with increasing PSA and was significantly higher in cancers than controls for PSA levels <3 ng/mL and 3-10 ng/mL, the PSA level should be taken into account when interpreting PSAV (88)
Free/Total PSA
This test measures the percentage of free (or unbound) PSA in the blood and compares it with the percentage bound to proteins (α1 anti-chymotrypsin and α2 macroglobulin). Prostate cancer increases the amount of bound PSA. The lower the ratio of free to total PSA or the percentage of free PSA, the higher the likelihood that the patient has prostate cancer. The proportion of free PSA in seminal fluid is much higher than in serum, consistent with its physiological role in liquefaction (89). Although levels of bound-PSA do not significantly correlate with PSA in semen in young men, levels of free PSA do. With ageing, blood levels of complex-PSA, but not free-PSA, increase (90). The free/total PSA blood test can help to discriminate between patients with indeterminate PSA levels (4-10.0 ng/ml) indicating those who are at the greatest risk of having prostate cancer, in particular aggressive disease (91-92). However, as with all these modifications to PSA, the predictability remains less than perfect.
Free/Total PSA Summary:
- Men with prostate cancer have a greater fraction of complexed PSA and a lower free PSA than men without prostate cancer
- Free: Total PSA can be helpful in the case of a high PSA and a negative prostate biopsy
- Free PSA is unstable: the assay must be frozen to -20°C within 3 hours otherwise the free fraction reduces
- Chronic prostatitis may also cause a reduced Free: Total ratio
PSA Density
PSA density relates the concentration of serum PSA to the volume of the prostate and is thus a measure of serum PSA in relation to prostatic size (93). Most neoplastic prostate glands produce higher serum PSA levels per unit mass than do non-malignant glands. Consequently, a serum PSA of 5.0 ng/ml in a patient with a 20-gram prostate is more worrisome for cancer than that a PSA of 5.0 ng/ml in a man with a 60-gram prostate, especially if there is a predominance of transitional zone tissue (BPH) in the latter. To determine the PSA density, a PSA level is obtained and is divided by the volume of the prostate, as estimated by transrectal ultrasound (TRUS). Recent adoption of multiparametric (mp) MRI has allowed for determination of prostate volume as a standard reporting item. A value >0.15 ng/ml per gram of prostate tissue is considered worrisome for prostate cancer, and clinically used in nomograms to aid the urologist in estimating risk of prostate cancer. PSA density has been extended to include transition zone measurements in relation to the overall size of the prostate as the transition zone is the site in which BPH develops with ~25% of prostate cancers also arising in this zone. The larger the transition zone in relation to the overall size of the gland, the lower the likelihood of prostate cancer, other things being equal.
PSA Density Summary:
- PSA Density = PSA divided by prostate volume determined by TRUS / mpMRI
- The larger the transition zone, the lower the likelihood of prostate cancer
- PSAD >0.15 ng/ml per gram is considered worrisome for prostate cancer
- Problems with PSA density include:
(i) difficulty in defining the outline of the prostate accurately
(ii) variability in shapes not addressed by automated TRUS calculator estimations
Prostate Health Index
A further variation on the PSA blood test is the Prostate Health Index or phi, formulated by having the value of a truncated form of the PSA molecule (proPSA, greater production by most cancers than benign tissue) as the numerator and the free PSA value as the dominator multiplied by the total PSA level to give a phireading. phiis claimed to better predict prostate cancer risk than the total PSA. A phi-based nomogram in an external validation study performed with 75.2% accuracy (94). Furthermore, phi has been reported to aid in predicting pT3 disease (2.3%) and/or pathologic Gleason score ≥ 7 (2.4%) although decision curve analyses deduced these were not of greater clinical net benefit (95). A potential advantage of phiis that it stratifies according to risk. However, health economic analyses to determine clinical benefits of phi are yet to be realized(96).
Prostate health index [phi] = [−2]proPSA / fPSA) × PSA1/2
- For PSA 2–10 ng/ml, sensitivity, specificity and AUC (0.703) of phiexceeded those of total PSA and % fPSA. Increasing phiwas associated with an increased risk of prostate cancer (97). These estimates have been confirmed in multiple studies (AUC 0.67-0.81 c.f. PCA3 0.73, %fPSA 0.60-0.65, tPSA 0.50-0.52)(94,98-99), resulting in a consistent estimate of approximately 20-30% of avoided biopsies if phi is used instead of %fPSA(100-101). A meta-analysis estimated prostate cancer detection with sensitivity of 90% and specificity of 31.6%, and was better overall than PSA and %fPSA for PSA 2 – 10ng/ml(102).
- Including the prostate health index in a multivariable logistic regression model based on patient age, prostate volume, digital rectal examination and biopsy history significantly increased predictive accuracy by 7% from 0.73 to 0.80 (p <0.001) (103).
- phi0-22.9 = low probability of prostate cancer (8.4%)
23-44.9 = moderate probability of cancer (21%)
>45 = high probability of cancer (44%)
- phi-density (PHID), calculated similarly to PSA density, may also improve diagnostic accuracy of clinically-significant prostate cancer (AUC 0.82) compared to phi (0.79), %fPSA (0.79) and PSA (0.70)(104).
Four-kallikrein (4K) Panel
Another recent variation on the PSA blood test is the four-kallikrein (4K) panel, determined by a combination of kallikrein-related peptidase 2 (hK2), intact PSA, and free and total PSA as well as with clinical data (age, DRE findings, previous biopsy results). The 4K score has been shown to predict biopsy outcome to avoid unnecessary biopsies as well as predict distant metastasis at 10 years.
- Among European men with serum PSA 3 – 15 ng/ml, 4K score showed similar diagnostic performance (AUC 0.69 any prostate cancer, 0.72 high-grade prostate cancer) to phi (AUC 0.70 any prostate cancer, 0.71 high-grade prostate cancer) and potentially saved 29% of performed biopsies(105). These findings have been confirmed in multiple studies, including a Swedish community cohort(106).
- When applied to a USA cohort, 4K score performed better (AUC 0.82) than PCPT clinical risk calculator (AUC 0.74), equating to a potential 30-58% reduction in biopsies for delayed diagnosis of 1.3-4.7% of Gleason≥7tumors (107). Furthermore, accuracy was maintained between African American and Caucasian groups.
- The 4K score was applied to patients enlisted in the ProtecT study and showed superior diagnostic accuracy compared with PSA for any cancer (AUC 0.719 vs. 0.634) and high-grade cancer (0.82 vs. 0.74) and potentially reduced unnecessary biopsies by 42%(108).
Summary: Prostate Specific Antigen (PSA) & Derivatives
- Is a continuous variable with no cut point (47)
- Doesn’t distinguish between those with and without cancer or identify those with cancer who will benefit from curative treatment (48)
- PSA Velocity = rate of change of PSA: A PSA increase >0.75 ng/ml in year = an increased risk of having cancer (84)
- PDA Density: PSA density = PSA divided by prostate volume determined by TRUS
- Free: total PSA: The higher the free component and the ratio of free to total PSA, the lower the likelihood of cancer but chronic prostatitis may also cause a reduced Free: Total ratio
- Prostate Health Index (phi):may predict the risk of prostate cancer better compared with total PSA, but its role in prostate cancer screening is not defined.
- Total PSA = the single most significant, clinically used predictive factor for identifying men at increased risk of harboring cancer (79)
Digital Rectal Examination
Traditionally, palpation of the prostate by digital rectal examination (DRE) was the manner by which a diagnosis of prostate cancer was suspected. In historical series, up to 50% of palpable masses were attributable to prostate cancer (17,109-110). Although DRE by itself is a poor method for diagnosing this malignancy (111-112), especially when performed by non-urologists, it does still have an important diagnostic role, hence its variable inclusion in prostate cancer guidelines (recommended only for urologists mostly), as up to 25% of tumors are detected in men with normal PSA levels (113). Unfortunately, when a prostate cancer is diagnosed based on a palpable tumor, the risk of the patient already harboring metastatic or locally advanced malignancy is considerable(114-116). However, a PSA-based prostate cancer detection strategy which omits DRE runs the low risk of missing some curable cancers (49).
The PCA3 Test
The non-coding RNA PCA3, originally called DD3, is highly specific to prostate cancer, with over-expression(117-120)in a number of different cohorts. The first part of a voided urine specimen is collected immediately following firm rectal examination or prostatic massage (121-122)and PCA3 RNA measured using a PCR-based assay. One criticism of the PCA3 test is that is unlikely to obtain prostatic fluid from the anterior part of the prostate, mirroring a deficiency with TRUS-guided biopsies obtained via the rectum, which are also posteriorly-focused, especially in large prostate glands. Although the “PCA3 urine test” has been reported to improve identification of serious disease compared with total PSA in a pre-screened population (Table 2), its role in initial assessment of patients suspected of having prostate cancer has yet to be established (123-124). A prospective multicenter validation trial to assess the diagnostic performance of PCA3 determined a positive predictive value of 80% for initial biopsy, and negative predictive value at repeat biopsy of 88%, while the addition of PCA3 to available risk calculators improved risk prediction of overall and high-grade cancer(125).
Table 2: PCA3 Results in Post-Prostatic Massage Urines (118,120,125-129)
| Study |
Sensitivity |
Specificity |
Neg Predictive Value |
Number |
| Hessels et al, 2003 |
67% |
83% |
90% |
108 |
| Fradet et al, 2004 |
66% |
74% |
84% |
517 |
| Tinzl et al, 2004 |
82% |
76% |
87% |
158 |
| Van Gils et al, 2007 |
65% |
66% |
80% |
534 |
| Van Gils, et al 2007 |
65% |
82% |
80% |
67 |
| Salami et al, 2013 |
93% |
37% |
92% |
45 |
| Wei, et al 2014 (initial biopsy, PCA3 > 60) |
42% |
91% |
PPV 80% |
562 |
| Wei et al 2014 (repeat biopsy, PCA3 <20) |
76% |
52% |
88% |
297 |
Attempts to analyze PCA3 and other biomarkers in prostatic fluids, such as semen(130-131), have shown comparable diagnostic accuracy (132)but patient recruitment and clinician acceptance is challenging.
Recently, data from analysis of the fusion gene TMPRSS2:ERG and PCA3 from prostatic fluid obtained following firm digital rectal examination/prostatic massage, has been combined with serum PSA to produce a test which is being marketed commercially. Published supportive data is limited but preliminary findings indicate that the combination provides an 80% sensitivity and 90% specificity with an AUC of 0.88 for the 3 parameters(129,133-134).
However, Stephan et al.(135)examined PCA3, TMPRSS2:ERGand phiin an artificial neural network. The addition of TMPRSS2:ERG to PCA3 in urine following firm digital rectal examination only marginally improved detection of prostate cancer in110 men compared with 136 with non-cancer. PCA3 had the largest AUC (0.74) which was not significantly different to the AUC of phi(0.68) although the latter showed somewhat lower specificities than PCA3 at 90% sensitivity. A combination of PCA3 and phionly moderately enhanced diagnostic power with modest AUC gains of 0.01-0.04 for prostate cancer at first or repeat prostate biopsies. These findings were not reproduced by Salami and colleagues in the USA, where PCA3 demonstrated high sensitivity (93%, AUC 0.65), while TMPRSS2:ERG had higher specificity (87%, AUC 0.77) compared to serum PSA (AUC 0.72). A multivariate algorithm optimized cancer prediction (AUC = 0.88; specificity = 90% at 80% sensitivity) (129). In a prospective multicenter study of PCA3 and TMPRSS2:ERG prior to biopsy, Sanda and colleagues reported a 33-39% specificity at 93% sensitivity, which was predicted to reduce 42% of unnecessary biopsies and conferred a cost benefit for younger men(136).
It is likely that future clinical practice will integrate molecular markers into predictive calculators, such as the Prostate Cancer Prevention Trial (PCPT) or ERSPC calculators, to improve diagnostic accuracy above crude traditional markers such as family history or clinical examination findings (137).
Magnetic Resonance Imaging (MRI)
MRI use in prostate cancer is rapidly evolving. Potential applications and benefits include are summarized in Table 3.
Table 3. Utility of MRI in Prostate Cancer(138-141)
| Scenario |
Potential Benefits |
| 1) Triage prior to biopsy |
· Avoid unnecessary biopsy
· Provide target(s) for biopsy
· Assessment of anterior and apical areas that are poorly sampled by TRUS biopsies obtained via the rectum
· Increase detection of clinically significant cancer
· Minimize detection of insignificant cancer |
| 2) Patients with prior negative biopsy |
· Provide target for biopsy
· Assessment of anterior and apical areas that are areas poorly sampled by TRUS
· Increase detection of clinically significant cancer
· Minimize detection of insignificant cancer
· Decrease unnecessary repeat biopsy |
As an initial form of detection, MRI has the potential to improve the sensitivity of detection of intermediate and high-risk prostate cancer, especially in the anterior zone of the prostate, where cancers may not be sampled using transrectal ultrasound guided biopsy techniques. However, in some countries cost is still a handicap to widespread application. Interpretation of prostate imaging with different sequences (summarized in Table 4), using a “multiparametric” approach, requires expertise and collaboration, most commonly according to a structured reporting scheme, prostate imaging-reporting & data system (PI-RADS), which has since been updated to PI-RADS v2 (142-144). A PI-RADS score is assigned to each individual lesion using T2 weighting, diffusion-weighted imaging (DWI), and dynamic contrast enhancement to assign scores based on a Likert (5-point) scale based on the probability of clinically significant malignancy: PI-RADS 1 very low; PI-RADS 2 low; PI-RADS 3 intermediate; PI-RADS 4; PI-RADS 5 very high (145). A summary of the standardized anatomical description map and PI-RADS scoring specifications are shown Figures 15 and 16). For lesions in the peripheral zone DWI is the dominant sequence, and for the transition zone T2 dominant.
Table 4: MRI Imaging Sequences
|
Use |
| T1-weighted |
Detection of hemorrhage post biopsy as hyperintense
Detection of bone metastasis
Detection of abnormal lymph nodes |
| T2- weighted |
Demonstrates zonal anatomy.
Sensitive but non-specific as prostate cancer, prostatitis, atrophy, BPH, and changes after treatment (e.g., radiation induced arteritis) are hypointense
Dominant sequence for PIRADS scoring of transitional zone. |
| Diffusion-weighted imaging (DWI) |
Prostate cancer demonstrates restricted diffusion, appearing hyperintense at high b values and hypointense on ADC map
Dominant sequence for PIRADS scoring of peripheral zone |
| Dynamic contrast enhancement (DCE) |
Prostate cancer shows early enhancement and early washout |
| Spectroscopy |
Requires extra time for acquisition and may not add diagnostic value.
Not frequently used.
Citrate is reduced, whereas choline is increased in prostate cancer |
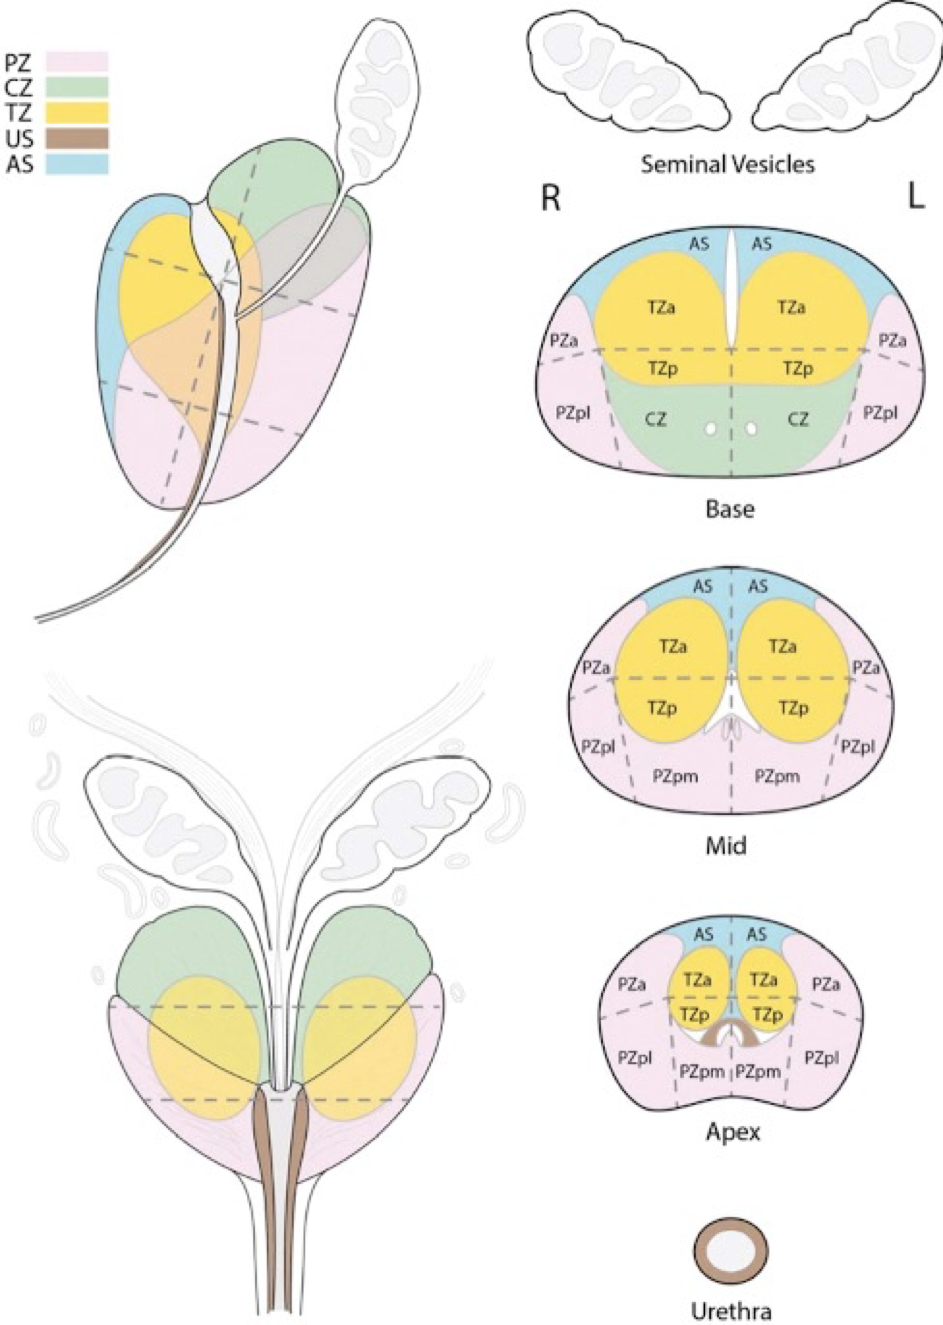
Figure 15: Prostate Map for Description of Lesions Detected on mpMRI According to PIRADS Classification
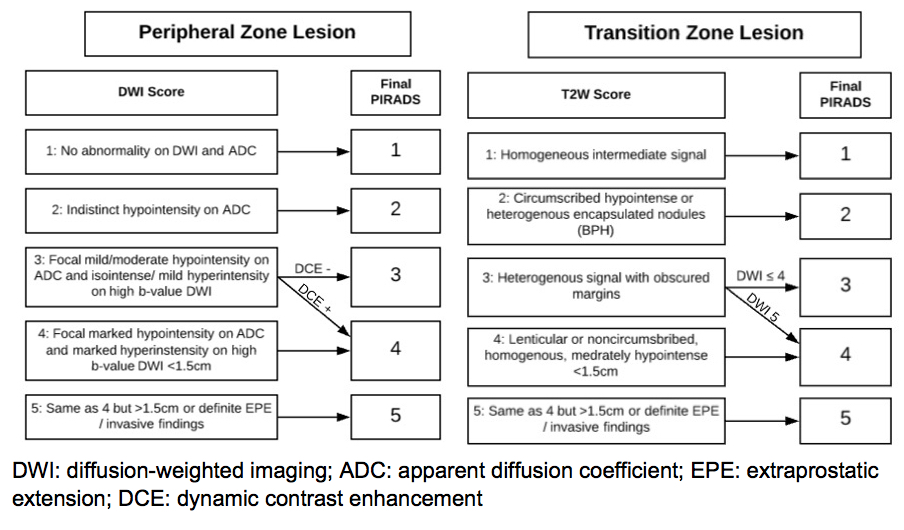
Figure 16: Prostate Map for Description of Lesions Detected on mpMRI According to
PIRADS Classification for Peripheral (right) and Transition (left) Zone Lesions.
CLINICAL USES OF MRI IN PROSTATE CANCER
Triage Prior To Biopsy
The diagnostic accuracy of MRI for the detection of prostate cancer varies widely across studies, with sensitivities from 58-96% and specificity from 23-87% (140-141,146-148). Such variability can be explained by different equipment, level of experience, lack of standardization in the early series, different reference standards, different sequencing protocols and definitions of clinically significant cancer. It is evident that accuracy has been improving in the more recent series, and good standardization of reporting has been achieved with the use of PIRADS V2. A meta-analysis of 21 studies including 3857 patients using PIRADS V2 showed a sensitivity of 89% and specificity of 73% (149). Of note, some studies only considered clinically significant prostate cancer while other considered any prostate cancer (149).
The PROMIS trial of 576 men assessed the capacity of mpMRI to identify men with clinically significant prostate cancer prior to prostate biopsy and compared the diagnostic accuracy of mpMRI to a 10-12-core systematic TRUS biopsy using a template transperineal prostate biopsy with cores taken every 5mm as the reference standard (148). mpMRI was significantly more sensitive than TRUS biopsy via the rectum in all 3 definitions of significant cancer used (Table 5). As a triage test mpMRI performed prior to biopsy and reserving it to patients with suspicious findings, mpMRI would have avoided biopsying 27% of patients at a risk of missing 7-12% of significant cancers - depending on the definition used.
Table 5. PROMIS Trial Results (148)
| Definition |
mpMRI |
TRUS 10-12-core |
| Gleason ≥4+3 or cancer ≥6mm |
Sens: 93%
Spec: 41% |
Sens: 48%
Spec: 96% |
| Gleason ≥3+4 or cancer ≥4mm |
Sens: 87%
Spec: 47% |
Sens: 60%
Spec: 98% |
| Gleason ≥3+4 |
Sens: 88%
Spec: 45% |
Sens: 48%
Spec: 99% |
The PRECISION study was a multi-centre pragmatic trial that randomized 500 patients with elevated PSA and/or abnormal DRE to TRUS prostate biopsy (10-12 cores) or a mpMRI. Patients in the mpMRI group underwent a targeted biopsy only if lesion(s) PIRADS ≥ 3 were identified. The targeted biopsy could be performed with software or cognitive fusion and could be transrectal or transperineal. The detection of clinically significant prostate cancer (defined as Gleason 3+4 or greater) was 26% in the standard biopsy group and 38% in the mpMRI group. This increased detection occurred despite the fact that 28% of patients in the mpMRI group were not biopsied because the study was reported as PIRADS 1-2 but still included in the population/denominator. Conversely, the detection of Gleason 3+3 cancer was 22% in the standard biopsy and 9% in the mpMRI group. Clinically significant cancer was detected in 12% of PIRADS 3, 60% of PIRADS 4 and 85% of PIRADS 5 lesions, similar to that seen in previous studies. Of note, the centers contributing the majority of patients had significant prior experience with prostate mpMRI reporting and targeted prostate biopsies. Whether centers with limited experience can achieve similar results remains to be demonstrated.
Patients with Prior Negative Biopsy
MRI has shown been shown to be useful in the subset of patients with prior negative biopsies. For these patients, the biopsy detection rate is approximately 30%, decreasing with each subsequent biopsy procedure (150-151).MRI followed by MRI-guided biopsies identifies prostate cancer in 41-59% (152-153). A recent review showed that across 16 studies MRI guidance improved the absolute detection of clinically significant prostate cancer between 6-18% in patients with previous negative TRUS biopsy (154).
DEFINITIVE DIAGNOSIS REQUIRES BIOPSIES
Prostate biopsy is required for the definitive diagnosis of prostate cancer. Systematic TRUS-guided biopsies have been the standard for the past decades but concerns about missing significant cancer and the risk of sepsis are changing the landscape. While TRUS imaging permits spatial positioning for systematic sampling, by itself it has low accuracy in detecting suspicious areas.
The number of biopsy cores taken is important with the chance of missing a cancer by standard sextant biopsy estimated to be approximately 25% (155)so that, more recently, the numbers of cores recommended are at least 10-12. In addition, it is advocated that biopsies should be directed laterally and that they should include the anterior horns of the peripheral zone (155-158). Still, recent studies have shown that systematic TRUS biopsies performed via the rectum miss approximately 50% of clinically significant cancers (139,148,159). The introduction of mpMRI is changing this situation at least in terms of missing significant cancer.
One of the problems facing clinicians has been when to stop from recommending biopsying not only in terms of patient age and overall life expectancy but also with respect to the increasing likelihood of a positive histological diagnosis in those biopsied. Indeed, a continually increasing probability of death from prostate cancer was observed among men of all ages with a PSA of 3.0 ng/ml in Baltimore Longitudinal Study of Ageing (160)of 849 men, 122 with and 727 without biopsy-confirmed prostate cancer. However, no participants between 75 and 80 years old with a PSA lower than 3.0 ng/ml died of prostate cancer. And not unexpectedly, the time to death or diagnosis of aggressive prostate cancer after age 75 years was not significantly different between PSA categories of 3 to 3.9 and 4 to 9.9 ng/ml. Of the 108 subjects older than 75 years with a PSA of 3 ng/ml or greater, 10 died of prostate cancer and 18 had high risk disease. In this group, 90 men did not have a diagnosis of high risk prostate cancer, including 75 who were never diagnosed with cancer (median time to censoring 12.5 years) and 15 who were diagnosed with non-high risk cancer (median time to censoring 17 years) (160). Therefore, many guidelines recommend against PSA testing among men older than 70 with a life expectancy of less than 7 to 10 years.
Routine practice for biopsies taken via the rectum involves peri-operative antibiotic prophylaxis. TRUS biopsies can be performed under local anesthesia or sedation. Rectal cleansing with povidone-iodine is recommended to decrease the risk of sepsis (161).
Changing Morbidity of Biopsy Diagnosis
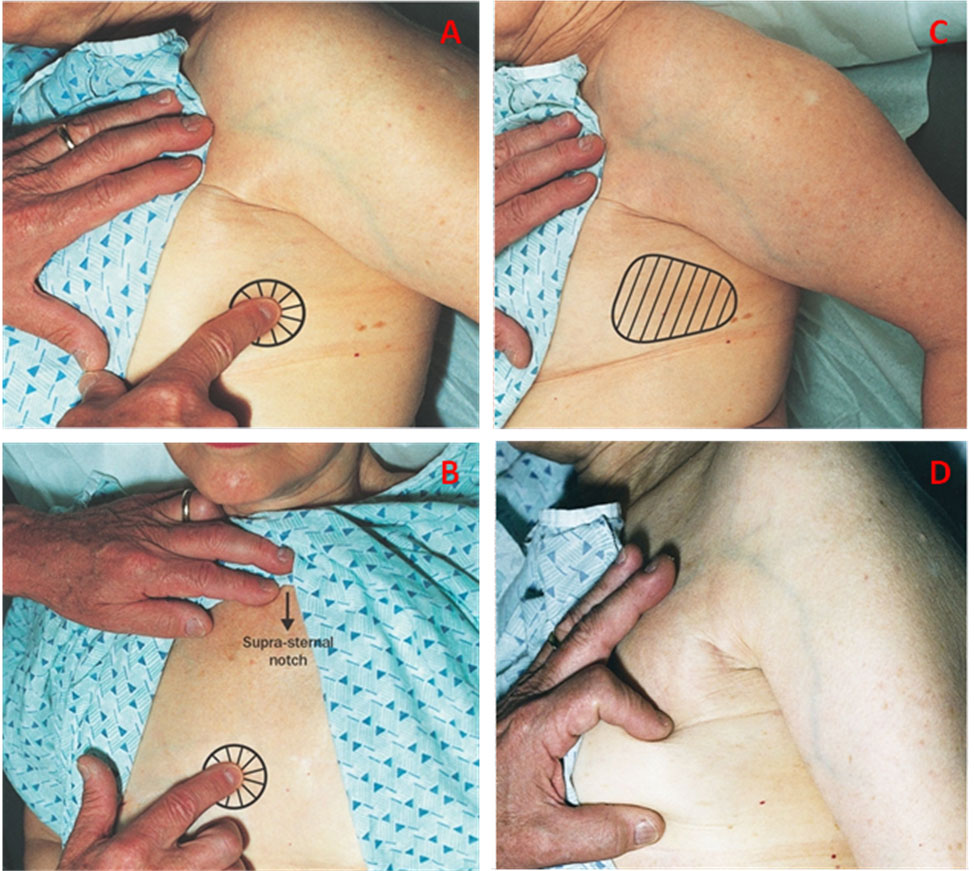
Periprocedural symptoms such as hematuria, rectal bleeding and hematospermia are frequent, being experienced by over 50% of men having TRUS biopsies performed via the rectum but are almost always benign and self-limiting (162-164). Infectious complications following this procedure are less common but are being reported more often, with the causative mechanism believed to be inoculation of the prostate, blood vessels and urine with bacterial flora from the rectal mucosa and subsequent systemic dissemination (162,165-166). There has been concern expressed that hospital admissions due to post-TRUS biopsy may be rising, with one study reporting a 3-fold increase from 0.55% across 2002-2009 to 2.15% across 2010-2011 (162,167-168). Changing bacterial resistance patterns and antibacterial practices have contributed to the spectrum of infectious complications with the infection rate being much higher in certain population groups such as men who have been taking antibacterial drugs prior to the biopsy and people who have been in South East Asia and Mediterranean countries within the past 6-12 months (168-169). Not surprisingly there is wide variation in the reported incidence of overall infectious complications from 0.1% to 7% and of sepsis from 0.3% to 3.1% across studies (166,170).
A prospective New Zealand study reported that drug resistance rates for patients who required intensive care admission for sepsis following TRUS biopsy were 43% for gentamicin, 60% for trimethoprim-sulphamethoxazole (60%) and 62% for ciprofloxacin as well as 19% for all 3 agents in combination. E. coli sequence type 131 clone was implicated as being particularly problematic, accounting for 41% of all E. coli isolates after TRUS biopsy (171). Fluoroquinolone resistance in rectal cultures has been reported to predict infectious complications following TRUS biopsy (172). The changing patterns of drug sensitivities and reports of low resistant rates to drugs such as carbapenems for patients with unresolving sepsis (173)has resulted in some advocating for the use of these drugs as prophylactic agents just prior to TRUS biopsy (174-175). However, adoption of such a strategy runs the risk of decreasing the number and effectiveness of those pharmaceutical agents currently kept in reserve for patients with overwhelming sepsis (175).
The transperineal approach has emerged as an alternative with significantly decreased risk of infections complications, albeit requiring specialized equipment, general anesthesia in most centers, increased operative time, an increased risk of urinary retention and potential nerve damage affecting erectile ability. A notable advantage of the transperineal approach is better sampling of the anterior zone of the prostate (174).
MRI also allows one to perform targeted biopsies, thereby increasing the detection of significant cancer. The main types of guided prostate biopsy techniques following diagnostic imaging with MRI include cognitive fusion (visual estimation from clinician’s interpretation of TRUS and mpMRI images), MRI-guided (biopsy performed under MRI guidance), fusion software (software integrating MR images on to the TRUS screen to guide biopsy needle to target index lesions), and robotic (automatic fusion and alignment for clinician). A particular issue with biopsying performed under real-time MR imaging is cost because this approach uses MR equipment which otherwise would be used for other purposes. These options are summarized in Table 6.
Table 6: Approaches for MRI-guided Targeted Prostate Biopsy
|
Description |
Characteristics |
References |
| Cognitive fusion (visual estimation) |
Manually directed based on MRI
TRUS or TP |
Low cost
Operator dependent |
Sciarra 2010
Lee 2012
Panebianco 2015 |
In-gantry
(real time) MRI-guided biopsy |
MRI-compatible biopsy gun used and trajectory established. Biopsy gun fired and sampling confirmed
TRUS or TP |
High cost with each procedure
Steep learning curve
Highest precision
|
Overduin 2013
Penzkofer 2015
Schimmöller 2016
Yaxley 2017 |
| MRI-TRUS software fusion biopsy |
Software assisted targeting of lesions
TRUS or TP |
Initial cost outlay
Ongoing costs similar
Good accuracy |
Porpiglia 2016
Siddiqui 2015
Meng 2016 |
| Robotic-Assisted |
Potentially less operator dependent
TRUS or TP |
Initial cost outlay |
Tilak 2015 |
In a meta-analysis of 11 studies Wegelin et al. compared the prostate cancer detection rates of cognitive-fusion, in-gantry, and TRUS software-fusion biopsy. In-gantry biopsy had a higher overall detection rate than cognitive-fusion, but the detection of clinically significant cancer was not different across the 3 techniques. Yaxley et al. performed a retrospective review comparing in-gantry MRI-guided biopsy to cognitive TRUS biopsy. In 595 PI-RADS 3-5 lesions, there was a high prostate cancer detection rate with no difference across biopsy methods (176). While the advantages of obtaining an MRI prior to biopsy are clear, up to 13% of clinically significant tumors can be missed when only targeted biopsies are performed (177-178). Moreover, this figure may be higher for lower volume centers with limited experience in MRI interpretation and MRI-guided biopsies. Consequently, many practitioner’s biopsy both index lesions seen with MRI as well as systematically sampling all parts of the prostate with 12 or more biopsies. In doing so, cognitive or in-gantry approaches are used for index lesions with a template employed to ensure correct special placing of biopsy needles for systematic sampling of the whole of the prostate.
Histopathological Assessment
The biopsy result provides important information for the patient and clinician on which to base management decisions (179). Important prognostic information on biopsy assessment include tumor quantification values (fraction of positive cores i.e. the number of positive cores versus the number of cores submitted and the percentage or length in mm of cancer in intact positive cores), cancer grade (Gleason score in each positive core and ISUP [International Society of Urological Pathology] grade) and presence or absence of perineural invasion, lymphovascular invasion, intraductal carcinoma, and extraprostatic extension (180). Increasing tumor burden and poor histological differentiation are associated with a higher risk of metastatic disease, an increased chance of post-treatment failure, and a worse overall prognosis (181-183).
Histological analysis is the ‘gold standard’ for classifying prostatic adenocarcinoma. Using architectural patterns, the tumor is assigned a Gleason score and ISUP grade between 1 and 5, with higher numbers representing less differentiated, more aggressive tumors (see Table 7). A single prostate can harbor multiple foci of different histologic patterns of adenocarcinoma, and it is possible to have Gleason grade 3, 4 and 5 patterns in the same specimen: 85% of prostate tumors are multifocal. The Gleason score and ISUP grade are generated by combining the values of the first and second most common (dominant and subdominant) grades assessed by the uropathologist using light microscopy. In needle biopsies, the Gleason score and ISUP grade are calculated using the most common and highest grade of cancer (184). These values provide s important prognostic information.
Table 7. The International Society of Urological Pathology (ISUP) Grading System (185)
| ISUP grade |
Gleason scores |
Definition |
| Grade 1 |
2-6 |
Only individual discrete well-formed glands
|
| Grade 2 |
3+4=7 |
Predominantly well-formed glands with
lesser component of poorly formed/ fused/ cribriform glands |
| Grade 3 |
4+3=7 |
Predominantly poorly formed/fused/ cribriform glands with lesser component of well-formed glands
|
| Grade 4 |
4+4=8 |
Only poorly formed/fused/cribriform glands |
| 3+5=8 |
Predominantly well-formed glands and
lesser component lacking glands (or with necrosis) |
| 5+3=8 |
Predominantly lacking glands (or with
necrosis) and lesser component of
well-formed glands |
| Grade 5 |
9-10 |
Lacking gland formation (or with necrosis)
with or without poorly formed/fused/
cribriform glands |
The presence of Gleason grade 4 or greater histology carries a significantly poorer prognosis (186-187). It has been shown that Gleason score 4+3 tumors behave much worse than Gleason score 3+4 tumors and that there is a biological continuum within Gleason score 7 tumors with the proportion of pattern 4 cancer that is reflected in clinical outcome (188).
In the large majority of instances, gray-scale TRUS does not permit differentiation between cancer and non-cancer so TRUS and transperineal biopsies are taken blindly. Consequently, there is a possibility that small tumors may be missed, despite careful spatial positioning of biopsy needles with multiple cores taken. Furthermore, in large glands especially, the anterior part of the prostate may be poorly sampled via the transrectal route so, for these reasons, it is not surprising that the histology from biopsies and radical prostatectomies may differ. In these instances, the Gleason score from the radical prostatectomy specimen is usually higher (upgrading) but downgrading is also observed.
Recently, the International Society of Urological Pathology (ISUP) proposed a new Grading system in order to improve prognostication of tumor grade, as well as improve patient education (184,189-191). Although the term “grade groups”has been used for these prognostic categories, it has been shown to be erroneous as they are not groupings of grades but groupings of scores (184,189). Furthermore, these categories were the result of a consensus conference organized by the ISUP for the purpose updating the ISUP modified Gleason scoring system of 2005 and as such, the new ISUP grades are based on the 2005 ISUP modified Gleason scores (Table 7).
These grades have been validated in surgical cohorts and show distinct patterns of recurrence free progression (RFP) depending on the highest Grade within the RP and biopsy histology (190-191).
PROSTATIC INTRAEPITHELIAL NEOPLASIA [PIN]
Prostatic intraepithelial neoplasia [PIN] is believed to be a precursor of prostate cancer, given the strong association between high grade PIN and prostatic adenocarcinoma (192-194). The presence of high grade PIN is often indicative of the presence of prostate cancer. It has been shown that more than 80 percent of prostates with adenocarcinoma also contain high-grade PIN (PIN-11 & III). High-grade PIN has cytologic features resembling cancer and carries many of the genetic alterations of prostate cancer. The finding of high-grade PIN alone in a biopsy has been cited as an indication to proceed with repeat biopsies given the high co-frequency between high-grade PIN and carcinoma. However, in current practice, the predictive value of PIN in finding cancer on subsequent biopsies has declined, probably due to the extended biopsy techniques yielding higher rates of initial cancer detection (195). A diagnosis of PIN by itself is certainly insufficient for a patient to undergo either radical prostatectomy or radiotherapy.
ATYPICAL PROSTATIC GLANDULAR PROLIFERATIONS
Foci of atypical glands, also labeled ‘atypical small acinar proliferation of uncertain significance’, have features suspicious for, but not diagnostic of, cancer. These encompass a variety of lesions including benign mimickers of cancer, HGPIN, and small foci of carcinoma which, for a variety of reasons, cannot be accurately diagnosed. The reported incidence of these lesions on prostate needle biopsies is 1.5% to 5.3% (195). Patients with atypical glands on needle biopsy have a high risk of harboring cancer. The reported incidence of prostate cancer from repeat biopsies has ranged from 34 to 60% (196). Following an atypical diagnosis, biopsies need to be repeated (197).
TNM STAGING SYSTEM
Once a diagnosis of prostate cancer is made, it must be determined whether the patient is a candidate for potentially curative treatment (surgery or radiation). This depends upon several factors, including general health and projected longevity in conjunction with the likelihood that the cancer is still localized within the prostate and has not yet metastasized. The most important factor, however, is the patient’s decision after he has considered the ‘pros and cons’ of the various choices as they relate to him (see below).
Currently, the TNM system is used for staging (Table 8), and prostate cancers can be assigned both a clinical stageand, subsequently should the prostate be removed surgically, a pathologic stage. This differentiation is important with the clinical and pathological stage designated by the letters ‘c’ and ‘p’, respectively, preceding the stage denotation (e.g. cT2a = clinically, tumor is palpably involving one lobe of the prostate or less).
Table 8: TNM Staging Classifications [per American Joint Committee on Cancer (AJCC) 8th Edition 2016)(198)
| Primary Tumor |
| Tx
T0 |
Primary tumor cannot be assessed
No evidence of primary tumor |
| T1 |
Clinically inapparent tumor not palpable not visible by imaging |
| T1a |
Incidental tumor in < 5% of TUR tissue |
| T1b |
Incidental tumor in > 5% of TUR tissue |
| T1c |
Needle biopsy prompted by elevated PSA |
| T2 |
Organ confined |
| T3 |
Tumor extends beyond the prostatic capsule |
| T3a |
Extracapsular, unilateral and bilateral or microscopic invasion of bladder neck |
| T3b |
Tumor invades seminal vesicles (s) |
| T4 |
Tumor invades external sphincter, rectum, pelvic side wall |
| Lymph Nodes |
| Nx
N0 |
Regional nodes were not assessed
No regional (below level of bifurcation of common iliac arteries) nodes |
| N1 |
Regional node metastases – including pelvic, hypogastric, obturator, iliac, sacral |
| Distant Metastases |
| Mx
M0 |
Regional nodes not assessed
No Metastases |
| M1
M1a
M1b
M1c |
No distant
Non-regional lymph nodes (outside true pelvis)
Bone(s)
Other site(s) with or without bone disease |
POTENTIAL BENEFITS & HARMS FROM PSA TESTING
One of the most contentious topics in medicine is whether or not to test for prostate cancer. The key question that needs to be answered is whether a diagnosis of prostate cancer is going to benefit the patient with the qualification that the diagnostic process and treatment should not be worse than the unwanted effects of the disease. Determining who will benefit from testing is very difficult as it is impossible to know exactly how long an individual patient will live and generally both patients and clinicians tend to be optimistic in their estimations.
Early Diagnosis and Treatment With Curative Intent And Prevention Of Subsequent Death From Prostate Cancer
In addition to attributing a slow but continuing reduction in prostate cancer mortality in many Western countries to, at least in part, widespread PSA testing, most of the evidence proffered in support is from low-level cohort studies, many of which have been retrospective. One notable, largestudy undertaken prospectively has been in the Tyrol. Unlike in the rest of Austria, PSA testing has been freely available in Tyrol since 1993 for men 45-75 years with 86.6% of eligible men having been tested at least once since its inception (199). Compared with the rest of the country, there has been a decreasing trend in prostate cancer mortality which, in 2005, was significantly greater in the Tyrol compared with the rest of Austria (P = 0.001). Prostate cancer deaths were 54% lower than expected in this region compared with the rest of Austria, with a significant migration to lower stage disease. These better results in Tyrol have been attributed to early detection, consequent down-staging and effective treatment.
However, the evidence for and against PSA screening is usually based on the findings from 6 mass or whole of population screening trials and meta-analyses of their findings. These studies were the Prostate Lung, Colorectal and Ovarian (PLCO) Screening Trial (200-201), the European Randomized Study of Screening for Prostate Cancer (ERSPC)(48) (202), Göteborg (203), Norrköping (204), Stockholm (205)and Quebec trials (206).
The studies were very different in design and in adherence to protocols. For example, men were invited only once in Stockholm Study and a minority of those with screen-detected prostate cancer were treated with curative intent (205). The participation rate was only 24% in the Quebec study (206). The Norrkoping Study commenced in 1987 with DRE as the only screening test performed up to the third (1993) and the final fourth screening time (1996) when PSA was included. Fewer than 500 men had two PSA measurements & none had more than two. Furthermore, final results were adjusted for the large difference in age at randomization between the study groups (204).
Thus, in terms of trials with reasonable rigor, there are only 3 viz. the ERSPC, the Göteborg (which is also included as part of the larger ERSPC study) and the PLCO trial (Table 9). In the PLCO trial only 85% in the screening arm had a PSA test. In addition, more than 80% in the control arm reported having a PSA test, significantly contaminating this arm (200,207). Furthermore, the follow-up for these trials varied greatly with only one (Göteborg) having an adequate median follow-up period, detailed below.
PLCO: median 11.5 years, maximum 13 years (201)
ERSPC: median 9.8 years, maximum 11 years (202)
Göteborg: median 14 years, maximum 14 years (203)
Norrköping: median 6.3 years, maximum 20 years (204)
Stockholm: median 12.9 years, maximum 15 years (205)
Quebec: median 7.9 years, maximum 13 years (206)
Table 7: Comparison of ERSPC, PLCO and Göteborg Trials
|
ERSPC |
PLCO |
Göteborg |
| Number studied |
162 243 |
76,693 |
20,000 |
| Recruitment sites |
8 countries |
10 US centers |
one |
| Age |
50-69 |
55-74 |
50-64 |
| PSA screening interval |
4 yearly |
yearly x6 DRE x4 |
2 yearly |
| Biopsy trigger |
3.0 ng/ml |
>4 ng/ml |
3.4, 2.9, 2.5 ng/ml |
| Contamination rate
(PSA testing in control group) |
15% |
52% |
3% |
Since the studies are so different in so many ways, the validity of including them in a meta-analysis has been questioned (208). Given the long natural history of prostate cancer in comparison with those of other malignancies and the prevalence of the diseasewith increasing age, few would advocate screening each and every member of a population (209-211)i.e. mass population screening as reported in these trials
SUMMARY OF MORTALITY FINDINGS FROM THE THREE MOST RELEVANT STUDIES
- None of these trials had adequate statistical power to detect an overall survival benefit with PSA screening
- Deaths from conditions other than prostate cancer dominated causes of death undermining ability to show an advantage for PSA screening
- PLCO- At a median follow-up of 11.5 years, of 76 685 men randomized (38,340 in the intervention arm and 38,345 in the control arm) (201). Approximately 92% of the study participants were followed for 10 years and 57% for 13 years.
- deaths from all causes other than prostate, lung, and colorectal cancers were 5783/38,340 (15%) in the intervention arm: 5982/38 345 (15.6%) in the control arm
- of those who died, 158/5783 (2.7%) & 145/5982 (2.4%) in the control arm, died from prostate cancer, respectively
- cumulative mortality rates from prostate cancer in the intervention and control arms were 3.7 and 3.4 deaths per 10 000 person-years
- ERSPC- At a median follow-up of 11 years, 31,318 of 162,388 (19.3%) of men between 55 & 69 yr. who underwent randomization had died [154] (202)
- 13,917/72,891 (19%) in screening group: 17,256/89,352 (19%) in control group
- of those who died, 299/13,917 (0.4%) & 462/17,256 (0.5%) died from prostate cancer, respectively
- the absolute reduction in mortality in the screening group was 0.10 deaths per 1000 person-years or 1.07 deaths per 1000 men who underwent randomization.
- to prevent one death from prostate cancer at 13 years of follow-up, 781 men would need to be invited for screening and 27 cancers would need to be detected (212)
- Göteborg- At a median follow-up of 14 years, 3,963 of 20,000 (19.8%) of men between 50 & 64 who underwent randomization had died (203)
- 1981/10,000 (19.8%) in the screening group and 1982/10,000 (19.8%) in the control group died
- of those who died, 44/1981 (2.2%) & 78/1982 (3.9%) died from prostate cancer, respectively
- overall the relative risk reduction in mortality was 44% for men randomized to screening compared with controls at 14 years.
- Overall, 293 men needed to be invited for screening and 12 to be diagnosed to prevent one prostate cancer death
Overall, the benefits of early detection of prostate cancer increase with time.
Findings are based exclusively on systematic reviews (meta-analyses) of 6 randomized controlled [RCTs] PSA screening trials with 8 systematic appraisals of these RCTs but
- RCTs are not the only form of evidence: absence of RCT evidence does not equal evidence of absence
- These were mass population screening trials – no patient selection - as opposed to opportunistic & selective screening (which most people advocate)
Recently the ERSPC and PLCO data were analyzed considering implementation and practice settings between the trials, which estimated a similar effect between the trials and that screening conferred a 7-9% reduction in prostate cancer specific mortality per year and 26-31% lower risk of prostate cancer death with screening (213). This analysis has been reported to conclude that PSA screening reduced prostate cancer mortality; however the optimal screening strategy is yet to be determined or implemented to maximize benefit and reduce risk (214). One recently proposed strategy (as discussed above) has been based on a PSA level at age 60, suggesting that men with PSA <1 ng/mL at age 60 require no further screening, while men with PSA levels ≥2 ng/mL can expect a large reduction in cancer mortality, resulting in an estimated 23 men needing to be screened and six diagnosed to avoid one prostate cancer death by 15 years (215).
Survival Estimation
There are several approaches that can be used to improve a rough clinical estimation of a patient’s life-expectancy. Validated instruments are available such as a modified form of the Total Illness Burden Index for prostate cancer by Litwin (216)and the Charlson Comorbidity Index, which seems to be most useful in men<65 years undertaking initial treatment, in particular radical prostatectomy (217-218). Although these are not used commonly in clinical practice, they do provide one option. Froehner et al (2013) recently examined available comorbidityassessments to determine which may best assist in the treatment choice for elderly men with prostate cancer. A total of 1,106 men aged 65 years or older who underwent radical prostatectomy for clinically localized prostate cancer was examined with overall survival as the study endpoint. They concluded that the American Society of Anesthesiologists (ASA) physical status classification tool, supplemented by a list of more clearly defined concomitant diseases, could be useful in clinical practice and outcome studies (219).
Another approach is to refer to Life Expectancy Tables (such as the Table 10 below modified from the Australian Bureau of Statistics website 2017). Such tables do not take into account an individual’s comorbidities.
Table 10: Life Expectancy Table for Australia
| Age |
2000-2002 |
2004-2006 |
2010-2012 |
2014-2016 |
Age |
2000-2002 |
2004-2006 |
2010-2012 |
2014-2016 |
| 35 |
44.08 |
45.17 |
46.1 |
46.6 |
68 |
15.14 |
15.97 |
16.8 |
17.2 |
| 36 |
43.14 |
44.22 |
45.2 |
45.6 |
69 |
14.42 |
15.23 |
16.0 |
16.5 |
| 37 |
42.20 |
43.27 |
44.2 |
44.7 |
70 |
13.72 |
14.51 |
15.3 |
15.7 |
| 38 |
41.25 |
42.32 |
43.3 |
43.7 |
71 |
13.04 |
13.80 |
14.5 |
14.9 |
| 39 |
40.31 |
41.37 |
42.3 |
42.8 |
72 |
12.38 |
13.10 |
13.8 |
14.2 |
| 40 |
39.37 |
40.43 |
41.4 |
41.8 |
73 |
11.74 |
12.42 |
13.1 |
13.5 |
| 41 |
38.43 |
39.49 |
40.4 |
40.9 |
74 |
11.11 |
11.76 |
12.4 |
12.8 |
| 42 |
37.49 |
38.55 |
39.5 |
39.9 |
75 |
10.51 |
11.12 |
11.7 |
12.1 |
| 43 |
36.56 |
37.61 |
38.6 |
39.0 |
76 |
9.92 |
10.50 |
11.0 |
11.4 |
| 44 |
35.63 |
36.68 |
37.6 |
38.1 |
77 |
9.36 |
9.90 |
10.4 |
10.7 |
| 45 |
34.70 |
35.74 |
36.7 |
37.1 |
78 |
8.82 |
9.32 |
9.8 |
10.1 |
| 46 |
33.78 |
34.82 |
35.8 |
36.2 |
79 |
8.29 |
8.76 |
9.2 |
9.5 |
| 47 |
32.86 |
33.89 |
34.8 |
35.3 |
80 |
7.79 |
8.22 |
8.6 |
8.9 |
| 48 |
31.94 |
32.98 |
33.9 |
34.4 |
81 |
7.31 |
7.70 |
8.0 |
8.3 |
| 49 |
31.02 |
32.06 |
33.0 |
33.5 |
82 |
6.84 |
7.21 |
7.5 |
7.7 |
| 50 |
30.11 |
31.15 |
32.1 |
32.5 |
83 |
6.40 |
6.75 |
7.0 |
7.2 |
| 51 |
29.21 |
30.24 |
31.2 |
31.6 |
84 |
5.98 |
6.31 |
6.5 |
6.7 |
| 52 |
28.30 |
29.34 |
30.3 |
30.7 |
85 |
5.59 |
5.90 |
6.1 |
6.2 |
| 53 |
27.41 |
28.45 |
29.4 |
29.8 |
86 |
5.23 |
5.50 |
5.7 |
5.8 |
| 54 |
26.52 |
27.55 |
28.5 |
29.0 |
87 |
4.90 |
5.12 |
5.3 |
5.4 |
| 55 |
25.64 |
26.67 |
27.6 |
28.1 |
88 |
4.61 |
4.77 |
4.9 |
5.0 |
| 56 |
24.76 |
25.79 |
26.7 |
27.2 |
89 |
4.34 |
4.45 |
4.6 |
4.6 |
| 57 |
23.90 |
24.92 |
25.9 |
26.3 |
90 |
4.10 |
4.17 |
4.3 |
4.3 |
| 58 |
23.05 |
24.05 |
25.0 |
25.5 |
91 |
3.89 |
3.92 |
4.0 |
4.0 |
| 59 |
22.20 |
23.20 |
24.1 |
24.6 |
92 |
3.69 |
3.71 |
3.8 |
3.7 |
| 60 |
21.37 |
22.35 |
23.3 |
23.8 |
93 |
3.51 |
3.53 |
3.5 |
3.5 |
| 61 |
20.55 |
21.51 |
22.4 |
22.9 |
94 |
3.34 |
3.37 |
3.3 |
3.2 |
| 62 |
19.73 |
20.69 |
21.6 |
22.1 |
95 |
3.18 |
3.24 |
3.1 |
3.0 |
| 63 |
18.94 |
19.87 |
20.8 |
21.3 |
96 |
3.03 |
3.13 |
2.9 |
2.8 |
| 64 |
18.15 |
19.07 |
20.0 |
20.4 |
97 |
2.89 |
3.04 |
2.7 |
2.6 |
| 65 |
17.37 |
18.27 |
19.1 |
19.6 |
98 |
2.76 |
2.94 |
2.6 |
2.5 |
| 66 |
16.61 |
17.50 |
18.3 |
18.8 |
99 |
2.65 |
2.84 |
2.4 |
2.3 |
| 67 |
15.87 |
16.73 |
17.6 |
18.0 |
|
|
|
|
|
In terms of likelihood of dying from cardiovascular disease, whether or not a man has started to have erectile dysfunction may serve as a surrogate indicator. One recent large study indicated that the median time to death from a cardiovascular cause from the onset of erectile dysfunction (ED) was 10 years (220)since the reason for ED in the majority of cases is impaired arterial flow (221).
Factors To Consider When Deciding To Test For Prostate Cancer
- In the Scandinavian randomized trial of Radical Prostatectomy & watchful waiting. At a median follow-up of 13.4 years, 63 in the surgery group and 99 in the watchful-waiting group died from prostate cancer; the relative risk was 0.56 (95% confidence interval [CI], 0.41 to 0.77; P=0.001). The number needed to treat to prevent one death due to prostate cancer was 8 (222)
- The benefit of surgery with respect to death from prostate cancer was largest in men younger than 65 years of age (relative risk, 0.45) and in those with intermediate-risk prostate cancer (222)
- At a median of 12.8 years of follow-up in an earlier report on this trial, men with more than 2 significant co-morbidities did not benefit from PSA testing (223)
- In a follow up analysis of the PLCO study, there was a striking mortality benefit in men with minimal or no co-morbidities a 44% drop in prostate cancer-specific mortality and a number needed to treat of only 5. However, for men with at least one significant co-morbidity, there was no significant difference in prostate cancer mortality (224)
But what constitutes a significant comorbidity? “a condition or complaint either coexisting with the principal diagnosis or arising during the episode of care or attendance at a health care facility” (225). How do you assess it?
- Crawford et al chose an expanded definition that included both ‘standard’ Charlson comorbidity index conditions and hypertension (even if well controlled), diverticulosis, gallbladder disease and obesity (224)
- But when the analysis was repeated using only validated measures of comorbidity (Charlson comorbidity index conditions only), there was no interaction (226)
- A simple patient-reported index, a modified form of the Total Illness Burden Index modified for prostate cancer (216)vs Charlson Comorbidity Index (217-218)
- The American Society of Anesthesiologists (ASA) physical status classificationhas been recommended to serve as a basis of assessing suitability for radical prostatectomy in men >65 years (219)
- Onset of erectile dysfunctionmay serve as an indicator of limited life expectancy due to cardiovascular death (220-221)
- Morbidity of (frequently repeated) TRUS & T/P biopsies TRUS biopsy infections in 4.5%: 48% had rectal swabs showing Ciprofloxacin resistant bacteria (165,167,169)
- High over-diagnosis rate: active surveillance, where men diagnosed with low risk prostate cancer may be monitored with serial PSA and biopsies to delay or avoid treatment, may decrease the concern of over detection and over treatment
- Psychosocial aspects pervade all aspects of detection & treatment.
Recent studies have reported psychological distress levels severe enough to meet defined criteria close to the time of diagnosis from 10% to 23% (227). Bill-Axelson and colleagues in an eight year longitudinal study reported that although extreme distress was not common in men with localized prostate cancer, 30–40% of men reported ongoing health-related distress and worry about their health, feeling low, and sleep disturbance (228). Risk of suicide may be increased in the first six to twelve months after the diagnosis of prostate cancer (229-230). Screening for distress and referral to appropriate support services is widely accepted and recommended in men diagnosed with prostate cancer (231-232). In addition to distress, contemporary evidence suggests socio-demographic and psychosocial variables to be highly influential on intervention effects (232). Decisional conflicts impact upon continuation of Active Surveillance (233-234). When making decisions about treatment for prostate cancer men tend to rely on lay beliefs about cancer with the opinion of the clinician highly influential (233). A systematic review of psychosocial interventions for men with prostate cancer and their partners found that group cognitive-behavioral and psychoeducational interventions were helpful in promoting better psychological adjustment and quality of life (QOL) for men with prostate cancer (235). Multi-modal psychosexual and psychosocial interventions for men diagnosed with prostate cancer are recommended(232).
- Reassurance: PSA level <1ng/ml at the age of 65 years (50)or <3 ng/ml at the age of 75 years have a very low chance of contracting fatal cancer (160)
The recently completed PSA Evaluation Report by the National Health and Medical Research Council (NHMRC) of Australia concluded that, although there was some inconsistency in the definition of prostate cancer metastases across the RCTs, overall, the evidence indicates that PSA testing reduces the risk of having metastases present at the time of diagnosis of prostate cancer. The NHMRC review focused on the RCTs above in its considerations but did not conclude that intervention with curative intent reduces the likelihood of subsequent metastases [163]. However, evaluation of evidence from multiple non-RCTs has reported that PSA testing and intervention with curative intent does reduce the likelihood of subsequent metastases.
There are very few RCTs for prostate cancer treated with curative intent. Bill Axelson et al (2014) (222)recruited patients from 14 centers in Sweden, Finland and Iceland: The trial is noteworthy since the study included patients detected with prostate cancer at a later stage than is currently diagnosed: only 12% had impalpable disease on DRE - detected by what are now outmoded methods. The results are summarized below:
Swedish Trial Of Radical Prostatectomy Versus Watchful Waiting (222,236)
- From October 1989 through February 1999, 695 men with ‘early’ prostate cancer were randomly assigned to watchful waiting, where men are “watched” and treated only when symptomatic or with significant concern for complications, or radical prostatectomy
- Eligibility required patients to be
- <75 yrs. of age and a life expectancy >10 years: mean age was 65 yrs.
- Clinically localized disease (T1 or T2, using IUCC 1978 criteria)
- Diagnosis by core biopsy or fine needle aspiration cytology
- Well or moderately differentiated adenocarcinoma (WHO classification)
- PSA <50 ng/ml: mean PSA was 13 ng/ml
- a negative bone scan
- During a median of 13.4 years, 200 of the 347 men in the radical prostatectomy group and 247 of the 348 in the watchful-waiting group died (222). In the case of 63 men assigned to surgery and 99 men assigned to watchful waiting, death was due to prostate cancer (P = 0.001)
- The survival benefit was largest in men younger than 65 years of age and those with intermediate-risk prostate cancer
- The number needed to treat to avert one death at 18 years of follow-up was 8 (P=0.001) and 4 for men younger than 65 years of age (222)
- Among men who underwent radical prostatectomy, those with extracapsular tumor growth had a risk of death from prostate cancer that was 7 times that of men without extracapsular tumor growth (236)
- Distant metastases were diagnosed in 89 men in the radical prostatectomy group and 138 in the watchful waiting cohort resulting in a relative risk of metastases in the RP group of 0.57 (P <0.001) (222)
However, by contrast, in the Prostate Cancer Intervention versus Observation Trial (PIVOT) of radicalprostatectomy versus observation for localized prostate cancer found differently (237). Between November 1994 and January 2002, 731 men with localized prostate cancer (mean age, 67 years; median PSA value, 7.8 ng per milliliter) were randomly assigned to radical prostatectomy or observation and followed to January 2010. The primary outcome was all-cause mortality; the secondary outcome was prostate-cancer mortality
During the median follow-up of 10.0 years, 171 of 364 men (47.0%) assigned to radical prostatectomy died, compared with 183 of 367 (49.9%) assigned to observation (P=0.22). Among men assigned to radical prostatectomy, 21 (5.8%) died from prostate cancer or treatment, compared with 31 men (8.4%) assigned to observation (P=0.09). The effect of treatment on all-cause and prostate-cancer mortality did not differ according to age, race, coexisting conditions, self-reported performance status, or histological features of the tumor. Radical prostatectomy was associated with reduced all-cause mortality among men with a PSA value greater than 10 ng per milliliter (P=0.04 for interaction) and possibly among those with intermediate-risk or high-risk tumors (P=0.07 for interaction). Adverse events within 30 days after surgery occurred in 21.4% of men, including one death. In 2017, Wilt et al updated the results reporting that after nearly 20 years of follow-up among men with localized prostate cancer: surgery, was not associated with significantly lower all-cause or prostate-cancer mortality than observation.
However, there were serious deficiencies with the PIVOT study (238). Although the three Endpoints Committee members were blinded to randomized treatment assignments, reviewed medical records and death certificates when available to assign a cause of death using a primary and a secondary adjudication question, initial disagreements were resolved through discussion. Complete agreement on cause of death by all three committee members before any discussion was achieved in 200/354 (56%) cases on the primary and 209/354 (59%) cases on the secondary. Complete agreement on the primary cause rose to 306/354 (86%) when ‘definite’ and ‘probably’ categories were collapsed, as planned a priori. There was no separate ‘gold standard’ by which to judge the accuracy of the final endpoints committee adjudications, and useful death certificates could not be obtained on about a third of PIVOT participants who died.
U.S. PIVOT – Radical Prostatectomy Versus Observation (237)
- Recruitment difficulties and patient compliance issues affected numbers so that only 731 of the proposed 2000 men could be recruited to the trial and hence this study is considered to be underpowered to detect a difference in overall survival (239)
- Serious lack of agreement on cause of death by Endpoint Committee Members: Useful death certificates could not be obtained for approximately one third of participants
- Differences between histological reporting at participating sites and by a central pathologist affected risk stratification and, consequently, secondary endpoint results
- A less predictive pre-2005 ISUP Consensus Gleason classification was used with ~25% of patients with Gleason scores of 7 or higher reported at the peripheral sites compared with 48% with Gleason scores 7 or higher by a central pathologist
Consequently, the answer based on RCT evidence remains uncertain.
Early Diagnosis And Treatment With Curative Intent: Avoiding The Late Clinical Problems Resulting From A Large Pelvic Tumor
There is a paucity of high level evidence that early diagnosis of prostate cancer will prevent or minimize the problems resulting from a large pelvic tumor. Anecdotally, managing patients with disabling symptoms from advanced local prostate cancer constituted a considerable part of a urologist’s workload. Frequent visits to hospital for interventions together with burden of clinical symptoms such as unremitting day and night frequency, incontinence and bleeding, impact significantly on the dignity and quality of life of these men (240).
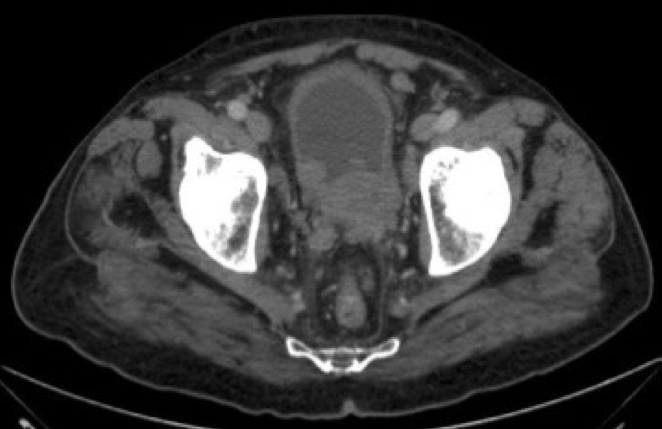
Figure 17: CT of pelvis showing prostatic tumor extending into the (thick-walled) bladder and spread to involve pelvic lymph nodes: the patient had multiple lower urinary tract symptoms
WHETHER TO TEST FOR PROSTATE CANCER
Prostate cancer is the most common male visceral malignancy in the developed world and the second most common cause of cancer deaths, uncertainties remain about management practices at several points in the illness continuum. For example, owing to controversies regarding the outcomes of screening trials for prostate cancer reducing the death rate from this disease, population-based screening for prostate cancer in asymptomatic men is not currently recommended in most countries (241). Rather, it is suggested that men should be able to access PSA testing as long as they are fully informed of the pros and cons of testing.
The Prostate Cancer Foundation of Australia (PCFA), in partnership with National Health and Medical Research Council (NHMRC) and Cancer Council Australia, published a “PSA Testing for Prostate Cancer in Asymptomatic Men” guideline in 2016, which was commissioned by the Department of Health and comprised a multi-disciplinary expert advisory panel. The guidelines have been endorsed by the Urological Society of Australia and New Zealand (USANZ) and the Royal Australian College of General Practitioners (RACGP). The recommendations are as follows:
- A population screening program for prostate cancer (a program that offers testing to all men of a certain age group) is not recommended
- Men should be offered evidence-based decision support, including the opportunity to discuss the benefits and harms of PSA testing before making the decision to be tested
- Men at average risk of prostate cancer who decide to be tested should be offered PSA testing every 2 years from age 50 to 69
- The harms of PSA testing may outweigh the benefits for men aged 70 and older or those with a life expectancy less than 7 years.
- Men with a family history of prostate cancer who decide to be tested should be offered PSA testing every 2 years from age 40/ 45 to 69 with the starting age depending on the strength of their family history
- Digital rectal examination is not recommended in addition to PSA testing in the primary care setting
The full guideline can be accessed at www.pcfa.org.au/psa-testing-guidelinesor https://wiki.cancer.org.au/australia/Guidelines:PSA_Testing
The approach that is considered to be optimal for achieving high quality patient decisions is shared decision making (242).
Shared decision makingis defined as a process carried out between a patient and his health care professional where both parties share information and the patient understands the risks and benefits of each treatment option, participates in the decision to the extent that he desires and makes a decision consistent with his preferences and values, or defers the decision to another time(243).
Shared decision making may not be easy to achieve for all patients (243). For example, although many patients with cancer indicate a preference for sharing decision making with their clinicians, some, in the case of prostate cancer between 8% to 58% of men, prefer a passive decision-making role where clinicians make treatment decisions on their behalf (244-245). However, clinicians still need to understand patients’ preferences to ensure that they are making quality decisions on behalf of their patients. As well, there is often a gap between the clinical ideal of shared decision making and actual clinical practice where decision complexity and time constraints may make this approach difficult for both parties to achieve (246-247). There are, however, defined strategies and decision aids that can facilitate this process (248).
Supporting Patient Choice About Testing For Prostate Cancer
Many groups advocate an informed decision-making process as an evidence-based approach and necessary precursor to screening for early prostate cancer (241,249). Others have suggested that informed decision-making on this health topic is also necessary as a medico-legal risk management strategy (250-251). While some researchers have suggested a set of information that needs to be communicated to men about this health decision (252-253), there are few explicit guidelines on this subject (254). Problematically, patients and clinicians do not agree on core content, including a basic explanation of a PSA test and the psychological effects of a positive PSA test result (255). It has been advised that, for any screening test, patients need to understand the purpose of the test, the likelihood of false-negatives and false-positives, the uncertainties and risks associated with testing, significant medical, social or financial implications of testing and any possible sequelae and follow up care plans (256)www.ipdas.ohri.ca.
Such information needs to be communicated to patients in a logical and balanced sequence in order to promote better understanding and increased decisional control by men. One approach that has been proposed in primary care in Australia is the use of six decision steps (see Figure 18). Each decision step logically follows to prompt the clinician to overview important health information, with tailoring suggested in Step 1 to ensure the discussion is consistent with the patient’s concerns. For example, for a man with a significant family history of prostate cancer, this factor is likely to be central to the patient discussion (257). Men who experience uncomplicated LUTS often worry about prostate cancer, so addressing this concern first may be priority (258-259). In this regard, resources for patients that explain about male reproductive health problems such as urinary symptoms and sexual dysfunction are available at www.andrologyaustralia.org. As well, National Health and Medical Research Council guidelines are available about the management of LUTS http://www.health.gov.au/nhmrc/publications/synopses/cp42syn.htm
Other overseas websites include:

Figure 18: Six Decision Steps
From this point, checking to ensure the patient has a basic understanding of both the prostate and possible tests is needed and, given many men may be unaware of the location and function of the prostate gland, an anatomical diagram may be a useful teaching tool here. Next, a consideration of individual risk with regard to both the incidence and mortality of prostate cancer is needed. Communicating health risks effectively is a challenge in the provision of effective decision support. In general people find probabilities hard to understand, often estimate their level of risk incorrectly, and tend not to weigh up pros and cons in a systematic way when deciding about treatments (234,260-261). As well, population-based statistics provide data about populations, not individuals, so risk communication needs to acknowledge this as a limitation and, where possible, refer to age-based risk estimates and relevant individual factors such as family history) (262).
There are a number of communication strategies that have been suggested to help patients understand risk. These include
- using numbers as well as words to explain risk
- where possible providing the absolute risk or benefit
- using frequencies rather than single event probabilities
- using consistent denominators
- putting the risk into context by comparing it to other life events
- offering both the possible negative and positive outcomes to balance the message frame (263-265).
However, a quality health decision goes beyond the simple transfer of information and includes consideration and incorporation of each patient’s values and personal preferences (266). Thus, Step 5 in Box 1 prompts the clinician to discuss each man’s individual preferences. A number of strategies can be used to do this, most commonly the use of a pros and cons exercise in which patients are encouraged to explicitly consider the factors that matter most to them personally in this decision, and the direction and leaning of their preferences either for or against each possible option. One approach to support this process for this health topic is the inclusion of a values table within a decision card (see Table 11). A decision aid that incorporates both the six decision steps and this values clarification exercise can be found on the Andrology Australia website at: http://www.prostate.org.au/articleLive/attachments/1/GP%20Show%20Card%20041007.pdf
Table 11: What is most important to you?
| FOR: Is this like you? |
AGAINST: Is this like you?
|
| I’m concerned that I might get prostate cancer |
I think my chance of getting prostate cancer is low |
| I want the best chance of finding it early, if I do get it |
I am not convinced about the effectiveness of testing |
| I’m not interested in waiting for all the proof to be in |
I am more concerned about avoiding treatment side effects, if there’s no guarantee I’d be reducing my risk of dying from prostate cancer |
| I want to do everything possible to reduce my risk of dying from prostate cancer |
|
Decision aids are also effective in supporting patients to make informed choices. With regards to PSA testing, patient-focused decision aids and decision counselling or support interventions have been found to be effective in increasing men’s knowledge about PSA testing and decreasing decision-related distress (254,267-270), with a variable effect on actual testing behavior.
A range of aids is freely available from the web (www.prostatehealth.org.au; www.cdc.gov/cancer/prostate;www.cancerbacup.org.uk).
Cancer helplines also often provide such information, for example:
- The Cancer Council Australia Cancer Helpline on 13 11 20;
- the UK helpline on 0808 800 1234;
- the USA Cancer Helpline on 1800 227 2345.
REFERENCES
- Surveillance E, and End Results Program (SEER). Prostate Cancer - Cancer Stat Facts.http://seer.cancer.gov/statfacts/html/prost.html.
- Siegel R, Naishadham D, Jemal A. Cancer statistics, 2012. CA Cancer J Clin2012; 62:10-29
- Ferlay J, Soerjomataram I, Dikshit R, Eser S, Mathers C, Rebelo M, Parkin DM, Forman D, Bray F. Cancer incidence and mortality worldwide: Sources, methods and major patterns in GLOBOCAN 2012. International Journal of Cancer2015; 136:E359-E386
- Baade PD, Youlden DR, Cramb SM, Dunn J, Gardiner RA. Epidemiology of prostate cancer in the Asia-Pacific region. Prostate international2013; 1:47-58
- Center MM, Jemal A, Lortet-Tieulent J, Ward E, Ferlay J, Brawley O, Bray F. International Variation in Prostate Cancer Incidence and Mortality Rates. European Urology2012; 61:1079-1092
- AIHW National Mortality Database. 2013; http://www.aihw.gov.au/cancer.
- Malvezzi M, Bertuccio P, Levi F, La Vecchia C, Negri E. European cancer mortality predictions for the year 2013. Annals of Oncology2013;
- Welfare AIoH. Prostate Cancer in Australia. Canberra: AIHW;2013.
- Baade PD, Coory MD, Aitken JF. International trends in prostate-cancer mortality: the decrease is continuing and spreading. Cancer causes & control : CCC2004; 15:237-241
- Feletto E, Bang A, Cole-Clark D, Chalasani V, Rasiah K, Smith DP. An examination of prostate cancer trends in Australia, England, Canada and USA: Is the Australian death rate too high? World Journal of Urology2015; 33:1677-1687
- Bartsch G, Horninger W, Klocker H, Reissigl A, Oberaigner W, Schonitzer D, Severi G, Robertson C, Boyle P. Prostate cancer mortality after introduction of prostate-specific antigen mass screening in the Federal State of Tyrol, Austria. Urology2001; 58:417-424
- Etzioni R, Legler JM, Feuer EJ, Merrill RM, Cronin KA, Hankey BF. Cancer surveillance series: interpreting trends in prostate cancer--part III: Quantifying the link between population prostate-specific antigen testing and recent declines in prostate cancer mortality. Journal of the National Cancer Institute1999; 91:1033-1039
- Hankey BF, Feuer EJ, Clegg LX, Hayes RB, Legler JM, Prorok PC, Ries LA, Merrill RM, Kaplan RS. Cancer surveillance series: interpreting trends in prostate cancer--part I: Evidence of the effects of screening in recent prostate cancer incidence, mortality, and survival rates. Journal of the National Cancer Institute1999; 91:1017-1024
- SchröderFH, Kranse R. Verification Bias and the Prostate-Specific Antigen Test — Is There a Case for a Lower Threshold for Biopsy? New England Journal of Medicine2003; 349:393-395
- Partin AW, Stutzman RE. Elevated prostate-specific antigen, abnormal prostate evaluation on digital rectal examination, and transrectal ultrasound and prostate biopsy. The Urologic clinics of North America1998; 25:581-589, viii
- Jhaveri FM, Klein EA, Kupelian PA, Zippe C, Levin HS. Declining rates of extracapsular extension after radical prostatectomy: evidence for continued stage migration. Journal of clinical oncology : official journal of the American Society of Clinical Oncology1999; 17:3167-3172
- Brawer MK. Prostate-specific antigen: Critical issues. Urology1994; 44:9-17
- Carter HB, Pearson JD. Prostate-specific antigen testing for early diagnosis of prostate cancer: formulation of guidelines. Urology54:780-786
- Gann PH, Hennekens CH, Stampfer MJ. A prospective evaluation of plasma prostate-specific antigen for detection of prostatic cancer. Jama1995; 273:289-294
- Smith DS, Catalona WJ. The nature of prostate cancer detected through prostate specific antigen based screening. The Journal of urology1994; 152:1732-1736
- Hoedemaeker RF, Rietbergen JB, Kranse R, Schroder FH, van der Kwast TH. Histopathological prostate cancer characteristics at radical prostatectomy after population based screening. The Journal of urology2000; 164:411-415
- Luboldt HJ, Bex A, Swoboda A, Husing J, Rubben H. Early detection of prostate cancer in Germany: a study using digital rectal examination and 4.0 ng/ml prostate-specific antigen as cutoff. Eur Urol2001; 39:131-137
- Freedland SJ, Presti JC, Jr., Amling CL, Kane CJ, Aronson WJ, Dorey F, Terris MK. Time trends in biochemical recurrence after radical prostatectomy: results of the SEARCH database. Urology2003; 61:736-741
- Labrie F, Candas B, Dupont A, Cusan L, Gomez JL, Suburu RE, Diamond P, Levesque J, Belanger A. Screening decreases prostate cancer death: first analysis of the 1988 Quebec prospective randomized controlled trial. The Prostate1999; 38:83-91
- Kirby R, Christmas T, Brawer MK. Prostate Cancer.London: Times Mirror International Publishers.
- Sakr WA, Grignon DJ, Crissman JD, Heilbrun LK, Cassin BJ, Pontes JJ, Haas GP. High grade prostatic intraepithelial neoplasia (HGPIN) and prostatic adenocarcinoma between the ages of 20-69: an autopsy study of 249 cases. In vivo (Athens, Greece)1994; 8:439-443
- Deaths, Life expectancy. Reports & Statisticshttps://www.aihw.gov.au/reports/life-expectancy-death/deaths-in-australia/contents/life-expectancy, 2017.
- Heart, stroke & vascular diseases. Reports & Statisticshttps://www.aihw.gov.au/reports-statistics/health-conditions-disability-deaths/heart-stroke-vascular-diseases/overview, 2017.
- Nelson Q, Agarwal N, Stephenson R, Cannon-Albright LA. A population-based analysis of clustering identifies a strong genetic contribution to lethal prostate cancer. Frontiers in Genetics2013; 4:152
- Steinberg GD, Carter BS, Beaty TH, Childs B, Walsh PC. Family history and the risk of prostate cancer. The Prostate1990; 17:337-347
- Carter BS, Bova GS, Beaty TH, Steinberg GD, Childs B, Isaacs WB, Walsh PC. Hereditary prostate cancer: epidemiologic and clinical features. The Journal of urology1993; 150:797-802
- Brandt A, Bermejo JL, Sundquist J, Hemminki K. Age-specific risk of incident prostate cancer and risk of death from prostate cancer defined by the number of affected family members. Eur Urol2010; 58:275-280
- Grönberg H, Damber L, Damber JE. Familial prostate cancer in sweden: A nationwide register cohort study. Cancer1996; 77:138-143
- Teerlink CC, Thibodeau SN, McDonnell SK, Schaid DJ, Rinckleb A, Maier C, Vogel W, Cancel-Tassin G, Egrot C, Cussenot O, Foulkes WD, Giles GG, Hopper JL, Severi G, Eeles R, Easton D, Kote-Jarai Z, Guy M, Cooney KA, Ray AM, Zuhlke KA, Lange EM, FitzGerald LM, Stanford JL, Ostrander EA, Wiley KE, Isaacs SD, Walsh PC, Isaacs WB, Wahlfors T, Tammela T, Schleutker J, Wiklund F, Grönberg H, Emanuelsson M, Carpten J, Bailey-Wilson J, Whittemore AS, Oakley-Girvan I, Hsieh C-L, Catalona WJ, Zheng SL, Jin G, Lu L, Xu J, Camp NJ, Cannon-Albright LA. Association analysis of 9,560 prostate cancer cases from the International Consortium of Prostate Cancer Genetics confirms the role of reported prostate cancer associated SNPs for familial disease. Human Genetics2014; 133:347-356
- Eeles R, Goh C, Castro E, Bancroft E, Guy M, Olama AAA, Easton D, Kote-Jarai Z. The genetic epidemiology of prostate cancer and its clinical implications. Nature Reviews Urology2013; 11:18
- Bratt O. What should a urologist know about hereditary predisposition to prostate cancer? BJU international2007; 99:743-747; discussion 747-748
- Lynch HT, Kosoko-Lasaki O, Leslie SW, Rendell M, Shaw T, Snyder C, D'Amico AV, Buxbaum S, Isaacs WB, Loeb S, Moul JW, Powell I. Screening for familial and hereditary prostate cancer. International Journal of Cancer2016; 138:2579-2591
- Agalliu I, Karlins E, Kwon EM, Iwasaki LM, Diamond A, Ostrander EA, Stanford JL. Rare germline mutations in the BRCA2 gene are associated with early-onset prostate cancer. British Journal of Cancer2007; 97:826-831
- Ford D, Easton DF, Bishop DT, Narod SA, Goldgar DE. Risks of cancer in BRCA1-mutation carriers. Breast Cancer Linkage Consortium. Lancet (London, England)1994; 343:692-695
- Thompson D, Easton DF. Cancer Incidence in BRCA1 mutation carriers. Journal of the National Cancer Institute2002; 94:1358-1365
- Dobson R. Prostate cancer patients with BRCA2 mutation face poor survival. BMJ (Clinical research ed)2008; 337:a705
- Tryggvadottir L, Vidarsdottir L, Thorgeirsson T, Jonasson JG, Olafsdottir EJ, Olafsdottir GH, Rafnar T, Thorlacius S, Jonsson E, Eyfjord JE, Tulinius H. Prostate cancer progression and survival in BRCA2 mutation carriers. Journal of the National Cancer Institute2007; 99:929-935
- Narod SA, Neuhausen S, Vichodez G, Armel S, Lynch HT, Ghadirian P, Cummings S, Olopade O, Stoppa-Lyonnet D, Couch F, Wagner T, Warner E, Foulkes WD, Saal H, Weitzel J, Tulman A, Poll A, Nam R, Sun P, Danquah J, Domchek S, Tung N, Ainsworth P, Horsman D, Kim-Sing C, Maugard C, Eisen A, Daly M, McKinnon W, Wood M, Isaacs C, Gilchrist D, Karlan B, Nedelcu R, Meschino W, Garber J, Pasini B, Manoukian S, Bellati C. Rapid progression of prostate cancer in men with a BRCA2 mutation. Br J Cancer2008; 99:371-374
- Castro E, Goh C, Olmos D, Saunders E, Leongamornlert D, Tymrakiewicz M, Mahmud N, Dadaev T, Govindasami K, Guy M, Sawyer E, Wilkinson R, Ardern-Jones A, Ellis S, Frost D, Peock S, Evans DG, Tischkowitz M, Cole T, Davidson R, Eccles D, Brewer C, Douglas F, Porteous ME, Donaldson A, Dorkins H, Izatt L, Cook J, Hodgson S, Kennedy MJ, Side LE, Eason J, Murray A, Antoniou AC, Easton DF, Kote-Jarai Z, Eeles R. Germline BRCA Mutations Are Associated With Higher Risk of Nodal Involvement, Distant Metastasis, and Poor Survival Outcomes in Prostate Cancer. Journal of Clinical Oncology2013; 31:1748-1757
- Bancroft EK, Page EC, Castro E, Lilja H, Vickers A, Sjoberg D, Assel M, Foster CS, Mitchell G, Drew K, Mæhle L, Axcrona K, Evans DG, Bulman B, Eccles D, McBride D, van Asperen C, Vasen H, Kiemeney LA, Ringelberg J, Cybulski C, Wokolorczyk D, Selkirk C, Hulick PJ, Bojesen A, Skytte A-B, Lam J, Taylor L, Oldenburg R, Cremers R, Verhaegh G, van Zelst-Stams WA, Oosterwijk JC, Blanco I, Salinas M, Cook J, Rosario DJ, Buys S, Conner T, Ausems MG, Ong K-r, Hoffman J, Domchek S, Powers J, Teixeira MR, Maia S, Foulkes WD, Taherian N, Ruijs M, den Enden ATH-v, Izatt L, Davidson R, Adank MA, Walker L, Schmutzler R, Tucker K, Kirk J, Hodgson S, Harris M, Douglas F, Lindeman GJ, Zgajnar J, Tischkowitz M, Clowes VE, Susman R, Ramón y Cajal T, Patcher N, Gadea N, Spigelman A, van Os T, Liljegren A, Side L, Brewer C, Brady AF, Donaldson A, Stefansdottir V, Friedman E, Chen-Shtoyerman R, Amor DJ, Copakova L, Barwell J, Giri VN, Murthy V, Nicolai N, Teo S-H, Greenhalgh L, Strom S, Henderson A, McGrath J, Gallagher D, Aaronson N, Ardern-Jones A, Bangma C, Dearnaley D, Costello P, Eyfjord J, Rothwell J, Falconer A, Gronberg H, Hamdy FC, Johannsson O, Khoo V, Kote-Jarai Z, Lubinski J, Axcrona U, Melia J, McKinley J, Mitra AV, Moynihan C, Rennert G, Suri M, Wilson P, Killick E, Moss S, Eeles RA. Targeted Prostate Cancer Screening in BRCA1 and BRCA2 Mutation Carriers: Results from the Initial Screening Round of the IMPACT Study. European Urology2014; 66:489-499
- Constantinou J, Feneley MR. PSA testing: an evolving relationship with prostate cancer screening. Prostate cancer and prostatic diseases2006; 9:6-13
- Thompson IM, Ankerst DP, Chi C, Lucia MS, Goodman PJ, Crowley JJ, Parnes HL, Coltman CA, Jr. Operating characteristics of prostate-specific antigen in men with an initial PSA level of 3.0 ng/ml or lower. Jama2005; 294:66-70
- Schröder FH, Hugosson J, Roobol MJ, Tammela TL, Ciatto S, Nelen V, Kwiatkowski M, Lujan M, Lilja H, Zappa M, Denis LJ, Recker F, Berenguer A, Määttänen L, Bangma CH, Aus G, Villers A, Rebillard X, van der Kwast T, Blijenberg BG, Moss SM, de Koning HJ, Auvinen A. Screening and prostate-cancer mortality in a randomized European study. N Engl J Med2009; 360:1320-1328
- Lodding P, Aus G, Bergdahl S, Frosing R, Lilja H, Pihl CG, Hugosson J. Characteristics of screening detected prostate cancer in men 50 to 66 years old with 3 to 4 ng./ml. Prostate specific antigen. The Journal of urology1998; 159:899-903
- Vickers AJ, Cronin AM, Bjork T, Manjer J, Nilsson PM, Dahlin A, Bjartell A, Scardino PT, Ulmert D, Lilja H. Prostate specific antigen concentration at age 60 and death or metastasis from prostate cancer: case-control study. BMJ (Clinical research ed)2010; 341:c4521
- Marks LS, Andriole GL, Fitzpatrick JM, Schulman CC, Roehrborn CG. The interpretation of serum prostate specific antigen in men receiving 5alpha-reductase inhibitors: a review and clinical recommendations. The Journal of urology2006; 176:868-874
- Giganti F, Moore CM, Robertson NL, McCartan N, Jameson C, Bott SRJ, Winkler M, Gambarota G, Whitcher B, Castro R, Emberton M, Allen C, Kirkham A. MRI findings in men on active surveillance for prostate cancer: does dutasteride make MRI visible lesions less conspicuous? Results from a placebo-controlled, randomised clinical trial. European Radiology2017; 27:4767-4774
- Thompson IM, Jr., Goodman PJ, Tangen CM, Parnes HL, Minasian LM, Godley PA, Lucia MS, Ford LG. Long-term survival of participants in the prostate cancer prevention trial. N Engl J Med2013; 369:603-610
- Ornstein DK, Smith DS, Humphrey PA, Catalona WJ. The effect of prostate volume, age, total prostate specific antigen level and acute inflammation on the percentage of free serum prostate specific antigen levels in men without clinically detectable prostate cancer. The Journal of urology1998; 159:1234-1237
- Yuan JJ, Coplen DE, Petros JA, Figenshau RS, Ratliff TL, Smith DS, Catalona WJ. Effects of rectal examination, prostatic massage, ultrasonography and needle biopsy on serum prostate specific antigen levels. The Journal of urology1992; 147:810-814
- Kang D-Y, Li H-J. The Effect of Testosterone Replacement Therapy on Prostate-Specific Antigen (PSA) Levels in Men Being Treated for Hypogonadism: A Systematic Review and Meta-Analysis. Medicine2015; 94:e410
- Boyle P, Koechlin A, Bota M, d'Onofrio A, Zaridze DG, Perrin P, Fitzpatrick J, Burnett AL, Boniol M. Endogenous and exogenous testosterone and the risk of prostate cancer and increased prostate-specific antigen (PSA) level: a meta-analysis. BJU international2016; 118:731-741
- Dupree JM, Langille GM, Khera M, Lipshultz LI. The safety of testosterone supplementation therapy in prostate cancer. Nature Reviews Urology2014; 11:526
- Pearl JA, Berhanu D, François N, Masson P, Zargaroff S, Cashy J, McVary KT. Testosterone Supplementation does not Worsen Lower Urinary Tract Symptoms. The Journal of urology2013; 190:1828-1833
- Rider JR, Wilson KM, Sinnott JA, Kelly RS, Mucci LA, Giovannucci EL. Ejaculation Frequency and Risk of Prostate Cancer: Updated Results with an Additional Decade of Follow-up. European Urology2016; 70:974-982
- Morgan TO, Jacobsen SJ, McCarthy WF, Jacobson DJ, McLeod DG, Moul JW. Age-Specific Reference Ranges for Serum Prostate-Specific Antigen in Black Men. New England Journal of Medicine1996; 335:304-310
- DeAntoni EP, Crawford ED, Oesterling JE, Ross CA, Berger ER, McLeod DG, Staggers F, Stone NN. Age- and race-specific reference ranges for prostate-specific antigen from a large community-based study. Urology1996; 48:234-239
- Mottet N, Bellmunt J, Bolla M, Briers E, Cumberbatch MG, De Santis M, Fossati N, Gross T, Henry AM, Joniau S, Lam TB, Mason MD, Matveev VB, Moldovan PC, van den Bergh RC, Van den Broeck T, van der Poel HG, van der Kwast TH, Rouviere O, Schoots IG, Wiegel T, Cornford P. EAU-ESTRO-SIOG Guidelines on Prostate Cancer. Part 1: Screening, Diagnosis, and Local Treatment with Curative Intent. Eur Urol2017; 71:618-629
- Oesterling JE, Jacobsen SJ, Klee GG, Pettersson K, Piironen T, Abrahamsson PA, Stenman UH, Dowell B, Lovgren T, Lilja H. Free, complexed and total serum prostate specific antigen: the establishment of appropriate reference ranges for their concentrations and ratios. The Journal of urology1995; 154:1090-1095
- Fang J, Metter EJ, Landis P, Chan DW, Morrell CH, Carter HB. Low levels of prostate-specific antigen predict long-term risk of prostate cancer: results from the Baltimore Longitudinal Study of Aging. Urology2001; 58:411-416
- Carter HB, Pearson JD, Metter EJ, Brant LJ, Chan DW, Andres R, Fozard JL, Walsh PC. Longitudinal evaluation of prostate-specific antigen levels in men with and without prostate disease. Jama1992; 267:2215-2220
- Ku JH. Race-specific reference ranges of serum prostate-specific antigen levels in countries with a low incidence of prostate cancer. BJU international2006; 97:69-72
- Imai K, Ichinose Y, Kubota Y, Yamanaka H, Sato J, Saitoh M, Watanabe H, Ohe H. Clinical significance of prostate specific antigen for early stage prostate cancer detection. Japanese journal of clinical oncology1994; 24:160-165
- Imai K, Ichinose Y, Kubota Y, Yamanaka H, Sato J. Diagnostic significance of prostate specific antigen and the development of a mass screening system for prostate cancer. The Journal of urology1995; 154:1085-1089
- Ito K, Yamamoto T, Kubota Y, Suzuki K, Fukabori Y, Kurokawa K, Yamanaka H. Usefulness of age-specific reference range of prostate-specific antigen for Japanese men older than 60 years in mass screening for prostate cancer. Urology2000; 56:278-282
- He D, Wang M, Chen X, Gao Z, He H, Zhau HE, Wang W, Chung LW, Nan X. Ethnic differences in distribution of serum prostate-specific antigen: a study in a healthy Chinese male population. Urology2004; 63:722-726
- Lin WY, Gu CJ, Kao CH, Changlai SP, Wang SJ. Serum prostate-specific antigen in healthy Chinese men: establishment of age-specific reference ranges. Neoplasma1996; 43:103-105
- Kao CH. Age-related free PSA, total PSA and free PSA/total PSA ratios: establishment of reference ranges in Chinese males. Anticancer research1997; 17:1361-1365
- Wu TT, Huang JK. The clinical usefulness of prostate-specific antigen (PSA) level and age-specific PSA reference ranges for detecting prostate cancer in Chinese. Urologia internationalis2004; 72:208-211
- Tay KP, Chin CM, Lim PH, Chng HC. Prostate screening--the Singapore experience. International journal of urology : official journal of the Japanese Urological Association1996; 3:102-107
- Saw S, Aw TC. Age-related reference intervals for free and total prostate-specific antigen in a Singaporean population. Pathology2000; 32:245-249
- Lee SE, Kwak C, Park MS, Lee CH, Kang W, Oh SJ. Ethnic differences in the age-related distribution of serum prostate-specific antigen values: a study in a healthy Korean male population. Urology2000; 56:1007-1010
- Ku JH, Ahn JO, Lee CH, Lee NK, Park YH, Byun SS, Kwak C, Lee SE. Distribution of serum prostate-specific antigen in healthy Korean men: influence of ethnicity. Urology2002; 60:475-479
- Roobol MJ, Schröder FH, Crawford ED, Freedland SJ, Sartor AO, Fleshner N, Andriole GL. A Framework for the Identification of Men at Increased Risk for Prostate Cancer. The Journal of urology2009; 182:2112-2122
- Thompson IM, Tangen CM, Ankerst DP, Chi C, Lucia MS, Goodman P, Parnes H, Coltman CA, Jr. The performance of prostate specific antigen for predicting prostate cancer is maintained after a prior negative prostate biopsy. The Journal of urology2008; 180:544-547
- Pelzer AE, Tewari A, Bektic J, Berger AP, Frauscher F, Bartsch G, Horninger W. Detection rates and biologic significance of prostate cancer with PSA less than 4.0 ng/mL: observation and clinical implications from Tyrol screening project. Urology2005; 66:1029-1033
- Vickers AJ, Ulmert D, Sjoberg DD, Bennette CJ, Bjork T, Gerdtsson A, Manjer J, Nilsson PM, Dahlin A, Bjartell A, Scardino PT, Lilja H. Strategy for detection of prostate cancer based on relation between prostate specific antigen at age 40-55 and long term risk of metastasis: case-control study. BMJ (Clinical research ed)2013; 346:f2023
- Aus G, Damber JE, Khatami A, Lilja H, Stranne J, Hugosson J. Individualized screening interval for prostate cancer based on prostate-specific antigen level: results of a prospective, randomized, population-based study. Archives of internal medicine2005; 165:1857-1861
- Carter HB, Pearson JD. PSA velocity for the diagnosis of early prostate cancer. A new concept. The Urologic clinics of North America1993; 20:665-670
- Makarov DV, Loeb S, Magheli A, Zhao K, Humphreys E, Gonzalgo ML, Partin AW, Han M. Significance of preoperative PSA velocity in men with low serum PSA and normal DRE. World J Urol2011; 29:11-14
- D'Amico AV, Chen MH, Roehl KA, Catalona WJ. Preoperative PSA velocity and the risk of death from prostate cancer after radical prostatectomy. N Engl J Med2004; 351:125-135
- Loeb S, Metter EJ, Kan D, Roehl KA, Catalona WJ. Prostate-specific antigen velocity (PSAV) risk count improves the specificity of screening for clinically significant prostate cancer. BJU international2012; 109:508-513; discussion 513-504
- Loeb S, Carter HB, Schaeffer EM, Kettermann A, Ferrucci L, Metter EJ. Distribution of PSA velocity by total PSA levels: data from the Baltimore Longitudinal Study of Aging. Urology2011; 77:143-147
- Clements JA, Merritt T, DeVoss K, Swanson C, Hamlyn L, Scells B, Rohde P, Lavin MF, Yaxley J, Gardiner RA. Inactive free : total prostate specific antigen ratios in ejaculate from men with suspected and known prostate cancer, compared with young control men. BJU international2000; 86:453-458
- Savblom C, Malm J, Giwercman A, Nilsson JA, Berglund G, Lilja H. Blood levels of free-PSA but not complex-PSA significantly correlates to prostate release of PSA in semen in young men, while blood levels of complex-PSA, but not free-PSA increase with age. The Prostate2005; 65:66-72
- Stenman UH, Abrahamsson PA, Aus G, Lilja H, Bangma C, Hamdy FC, Boccon-Gibod L, Ekman P. Prognostic value of serum markers for prostate cancer. Scandinavian journal of urology and nephrology Supplementum2005:64-81
- Lilja H. Significance of different molecular forms of serum PSA. The free, noncomplexed form of PSA versus that complexed to alpha 1-antichymotrypsin. The Urologic clinics of North America1993; 20:681-686
- Seaman E, Whang M, Olsson CA, Katz A, Cooner WH, Benson MC. PSA density (PSAD). Role in patient evaluation and management. The Urologic clinics of North America1993; 20:653-663
- Lughezzani G, Lazzeri M, Haese A, McNicholas T, de la Taille A, Buffi NM, Fossati N, Lista G, Larcher A, Abrate A, Mistretta A, Bini V, Redorta JP, Graefen M, Guazzoni G. Multicenter European External Validation of a Prostate Health Index-based Nomogram for Predicting Prostate Cancer at Extended Biopsy. Eur Urol2013;
- Fossati N, Buffi NM, Haese A, Stephan C, Larcher A, McNicholas T, de la Taille A, Freschi M, Lughezzani G, Abrate A, Bini V, Palou Redorta J, Graefen M, Guazzoni G, Lazzeri M. Preoperative Prostate-specific Antigen Isoform p2PSA and Its Derivatives, %p2PSA and Prostate Health Index, Predict Pathologic Outcomes in Patients Undergoing Radical Prostatectomy for Prostate Cancer: Results from a Multicentric European Prospective Study. European Urology2015; 68:132-138
- Hori S, Blanchet JS, McLoughlin J. From prostate-specific antigen (PSA) to precursor PSA (proPSA) isoforms: a review of the emerging role of proPSAs in the detection and management of early prostate cancer. BJU international2013; 112:717-728
- Catalona WJ, Partin AW, Sanda MG, Wei JT, Klee GG, Bangma CH, Slawin KM, Marks LS, Loeb S, Broyles DL, Shin SS, Cruz AB, Chan DW, Sokoll LJ, Roberts WL, van Schaik RHN, Mizrahi IA. A Multicenter Study of [-2]Pro-Prostate Specific Antigen Combined With Prostate Specific Antigen and Free Prostate Specific Antigen for Prostate Cancer Detection in the 2.0 to 10.0 ng/ml Prostate Specific Antigen Range. The Journal of urology2011; 185:1650-1655
- Ferro M, Bruzzese D, Perdonà S, Marino A, Mazzarella C, Perruolo G, D’Esposito V, Cosimato V, Buonerba C, Di Lorenzo G, Musi G, De Cobelli O, Chun FK, Terracciano D. Prostate Health Index (Phi) and Prostate Cancer Antigen 3 (PCA3) Significantly Improve Prostate Cancer Detection at Initial Biopsy in a Total PSA Range of 2–10 ng/ml. PLOS ONE2013; 8:e67687
- Lazzeri M, Haese A, de la Taille A, Palou Redorta J, McNicholas T, Lughezzani G, Scattoni V, Bini V, Freschi M, Sussman A, Ghaleh B, Le Corvoisier P, Alberola Bou J, Esquena Fernández S, Graefen M, Guazzoni G. Serum Isoform [−2]proPSA Derivatives Significantly Improve Prediction of Prostate Cancer at Initial Biopsy in a Total PSA Range of 2–10 ng/ml: A Multicentric European Study. European Urology2013; 63:986-994
- Loeb S, Sanda MG, Broyles DL, Shin SS, Bangma CH, Wei JT, Partin AW, Klee GG, Slawin KM, Marks LS, van Schaik RHN, Chan DW, Sokoll LJ, Cruz AB, Mizrahi IA, Catalona WJ. The Prostate Health Index Selectively Identifies Clinically Significant Prostate Cancer. The Journal of urology2015; 193:1163-1169
- de la Calle C, Patil D, Wei JT, Scherr DS, Sokoll L, Chan DW, Siddiqui J, Mosquera JM, Rubin MA, Sanda MG. Multicenter Evaluation of the Prostate Health Index to Detect Aggressive Prostate Cancer in Biopsy Naïve Men. The Journal of urology2015; 194:65-72
- Filella X, Giménez N. Evaluation of [−2] proPSA and Prostate Health Index (phi) for the detection of prostate cancer: a systematic review and meta-analysis. Clinical Chemistry and Laboratory Medicine.Vol 512013:729.
- Lughezzani G, Lazzeri M, Larcher A, Lista G, Scattoni V, Cestari A, Buffi NM, Bini V, Guazzoni G. Development and internal validation of a Prostate Health Index based nomogram for predicting prostate cancer at extended biopsy. The Journal of urology2012; 188:1144-1150
- Druskin SC, Tosoian JJ, Young A, Collica S, Srivastava A, Ghabili K, Macura KJ, Carter BH, Partin AW, Sokoll LJ, Ross AE, Pavlovich CP. Incorporating Prostate Health Index Density, MRI, and Prior Negative Biopsy Status to Improve the Detection of Clinically Significant Prostate Cancer. BJU international2017;
- Nordström T, Vickers A, Assel M, Lilja H, Grönberg H, Eklund M. Comparison Between the Four-kallikrein Panel and Prostate Health Index for Predicting Prostate Cancer. European Urology2015; 68:139-146
- Braun K, Sjoberg DD, Vickers AJ, Lilja H, Bjartell AS. A Four-kallikrein Panel Predicts High-grade Cancer on Biopsy: Independent Validation in a Community Cohort. European Urology2016; 69:505-511
- Parekh DJ, Punnen S, Sjoberg DD, Asroff SW, Bailen JL, Cochran JS, Concepcion R, David RD, Deck KB, Dumbadze I, Gambla M, Grable MS, Henderson RJ, Karsh L, Krisch EB, Langford TD, Lin DW, McGee SM, Munoz JJ, Pieczonka CM, Rieger-Christ K, Saltzstein DR, Scott JW, Shore ND, Sieber PR, Waldmann TM, Wolk FN, Zappala SM. A multi-institutional prospective trial in the USA confirms that the 4Kscore accurately identifies men with high-grade prostate cancer. Eur Urol2015; 68:464-470
- Bryant RJ, Sjoberg DD, Vickers AJ, Robinson MC, Kumar R, Marsden L, Davis M, Scardino PT, Donovan J, Neal DE, Lilja H, Hamdy FC. Predicting High-Grade Cancer at Ten-Core Prostate Biopsy Using Four Kallikrein Markers Measured in Blood in the ProtecT Study. JNCI: Journal of the National Cancer Institute2015; 107:djv095-djv095
- Brawer MK. The diagnosis of prostatic carcinoma. Cancer1993; 71:899-905
- Jewett HJ. Significance of the palpable prostatic nodule. Journal of the American Medical Association1956; 160:838-839
- Catalona WJ, Richie JP, Ahmann FR, Hudson MA, Scardino PT, Flanigan RC, deKernion JB, Ratliff TL, Kavoussi LR, Dalkin BL, et al. Comparison of digital rectal examination and serum prostate specific antigen in the early detection of prostate cancer: results of a multicenter clinical trial of 6,630 men. The Journal of urology1994; 151:1283-1290
- Ellis WJ, Chetner MP, Preston SD, Brawer MK. Diagnosis of prostatic carcinoma: the yield of serum prostate specific antigen, digital rectal examination and transrectal ultrasonography. The Journal of urology1994; 152:1520-1525
- Prostate-specific antigen (PSA) best practice policy. American Urological Association (AUA). Oncology (Williston Park, NY)2000; 14:267-272, 277-268, 280 passim
- Partin AW, Yoo J, Carter HB, Pearson JD, Chan DW, Epstein JI, Walsh PC. The use of prostate specific antigen, clinical stage and Gleason score to predict pathological stage in men with localized prostate cancer. The Journal of urology1993; 150:110-114
- Thompson IM, Rounder JB, Teague JL, Peek M, Spence CR. Impact of routine screening for adenocarcinoma of the prostate on stage distribution. The Journal of urology1987; 137:424-426
- McLaughlin AP, Saltzstein SL, McCullough DL, Gittes RF. Prostatic carcinoma: incidence and location of unsuspected lymphatic metastases. The Journal of urology1976; 115:89-94
- Bussemakers MJ, van BA, Verhaegh GW, Smit FP, Karthaus HF, Schalken JA, Debruyne FM, Ru N, Isaacs WB. DD3: a new prostate-specific gene, highly overexpressed in prostate cancer. Cancer Res1999; 59:5975-5979
- Fradet Y, Saad F, Aprikian A, Dessureault J, Elhilali M, Trudel C, Masse B, Piche L, Chypre C. uPM3, a new molecular urine test for the detection of prostate cancer. Urology2004; 64:311-315; discussion 315-316
- Landers KA, Burger MJ, Tebay MA, Purdie DM, Scells B, Samaratunga H, Lavin MF, Gardiner RA. Use of multiple biomarkers for a molecular diagnosis of prostate cancer. International Journal of Cancer2005; 114:950-956
- Hessels D, Klein GJM, van Oort I, Karthaus HF, van Leenders GJL, van Balken B, Kiemeney LA, Witjes JA, Schalken JA. DD3(PCA3)-based molecular urine analysis for the diagnosis of prostate cancer. European Urology2003; 44:8-15; discussion 15-16
- Marks LS, Fradet Y, Deras IL, Blase A, Mathis J, Aubin SM, Cancio AT, Desaulniers M, Ellis WJ, Rittenhouse H, Groskopf J. PCA3 molecular urine assay for prostate cancer in men undergoing repeat biopsy. Urology2007; 69:532-535
- Roobol MJ, Schroder FH, van Leeuwen P, Wolters T, van den Bergh RC, van Leenders GJ, Hessels D. Performance of the prostate cancer antigen 3 (PCA3) gene and prostate-specific antigen in prescreened men: exploring the value of PCA3 for a first-line diagnostic test. Eur Urol2010; 58:475-481
- Nyberg M, Ulmert D, Lindgren A, Lindstrom U, Abrahamsson PA, Bjartell A. PCA3 as a diagnostic marker for prostate cancer: a validation study on a Swedish patient population. Scandinavian journal of urology and nephrology2010; 44:378-383
- Roobol MJ. Contemporary role of prostate cancer gene 3 in the management of prostate cancer. Current opinion in urology2011; 21:225-229
- Wei JT, Feng Z, Partin AW, Brown E, Thompson I, Sokoll L, Chan DW, Lotan Y, Kibel AS, Busby JE, Bidair M, Lin DW, Taneja SS, Viterbo R, Joon AY, Dahlgren J, Kagan J, Srivastava S, Sanda MG. Can Urinary PCA3 Supplement PSA in the Early Detection of Prostate Cancer? Journal of clinical oncology : official journal of the American Society of Clinical Oncology2014; 32:4066-4072
- Tinzl M, Marberger M, Horvath S, Chypre C. DD3PCA3 RNA analysis in urine--a new perspective for detecting prostate cancer. Eur Urol2004; 46:182-186; discussion 187
- van Gils MP, Hessels D, van Hooij O, Jannink SA, Peelen WP, Hanssen SL, Witjes JA, Cornel EB, Karthaus HF, Smits GA, Dijkman GA, Mulders PF, Schalken JA. The time-resolved fluorescence-based PCA3 test on urinary sediments after digital rectal examination; a Dutch multicenter validation of the diagnostic performance. Clinical cancer research : an official journal of the American Association for Cancer Research2007; 13:939-943
- van Gils MP, Cornel EB, Hessels D, Peelen WP, Witjes JA, Mulders PF, Rittenhouse HG, Schalken JA. Molecular PCA3 diagnostics on prostatic fluid. The Prostate2007; 67:881-887
- Salami SS, Schmidt F, Laxman B, Regan MM, Rickman DS, Scherr D, Bueti G, Siddiqui J, Tomlins SA, Wei JT, Chinnaiyan AM, Rubin MA, Sanda MG. Combining urinary detection of TMPRSS2:ERG and PCA3 with serum PSA to predict diagnosis of prostate cancer. Urol Oncol2013; 31:566-571
- Roberts MJ, Richards RS, Gardiner RA, Selth LA. Seminal fluid: a useful source of prostate cancer biomarkers? Biomarkers in medicine2015; 9:77-80
- Roberts MJ, Richards RS, Chow CW, Doi SA, Schirra HJ, Buck M, Samaratunga H, Perry-Keene J, Payton D, Yaxley J, Lavin MF, Gardiner RA. Prostate-based biofluids for the detection of prostate cancer: A comparative study of the diagnostic performance of cell-sourced RNA biomarkers. Prostate international2016; 4:97-102
- Roberts MJ, Chow CW, Schirra HJ, Richards R, Buck M, Selth LA, Doi SA, Samaratunga H, Perry-Keene J, Payton D, Yaxley J, Lavin MF, Gardiner RA. Diagnostic performance of expression of PCA3, Hepsin and miR biomarkers inejaculate in combination with serum PSA for the detection of prostate cancer. The Prostate2015; 75:539-549
- Leyten GH, Hessels D, Jannink SA, Smit FP, de Jong H, Cornel EB, de Reijke TM, Vergunst H, Kil P, Knipscheer BC, van Oort IM, Mulders PF, Hulsbergen-van de Kaa CA, Schalken JA. Prospective multicentre evaluation of PCA3 and TMPRSS2-ERG gene fusions as diagnostic and prognostic urinary biomarkers for prostate cancer. Eur Urol2014; 65:534-542
- Tomlins SA, Aubin SM, Siddiqui J, Lonigro RJ, Sefton-Miller L, Miick S, Williamsen S, Hodge P, Meinke J, Blase A, Penabella Y, Day JR, Varambally R, Han B, Wood D, Wang L, Sanda MG, Rubin MA, Rhodes DR, Hollenbeck B, Sakamoto K, Silberstein JL, Fradet Y, Amberson JB, Meyers S, Palanisamy N, Rittenhouse H, Wei JT, Groskopf J, Chinnaiyan AM. Urine TMPRSS2:ERG fusion transcript stratifies prostate cancer risk in men with elevated serum PSA. Sci Transl Med2011; 3:94ra72
- Stephan C, Jung K, Semjonow A, Schulze-Forster K, Cammann H, Hu X, Meyer HA, Bogemann M, Miller K, Friedersdorff F. Comparative assessment of urinary prostate cancer antigen 3 and TMPRSS2:ERG gene fusion with the serum [-2]proprostate-specific antigen-based prostate health index for detection of prostate cancer. Clinical chemistry2013; 59:280-288
- Sanda MG, Feng Z, Howard DH, Tomlins SA, Sokoll LJ, Chan DW, Regan MM, Groskopf J, Chipman J, Patil DH, Salami SS, Scherr DS, Kagan J, Srivastava S, Thompson IM, Jr., Siddiqui J, Fan J, Joon AY, Bantis LE, Rubin MA, Chinnayian AM, Wei JT, Bidair M, Kibel A, Lin DW, Lotan Y, Partin A, Taneja S. Association Between Combined TMPRSS2:ERG and PCA3 RNA Urinary Testing and Detection of Aggressive Prostate Cancer. JAMA oncology2017; 3:1085-1093
- Gardiner RA, Mainwaring P, Lavin MF. Integrating Molecular Profiling of Liquid Biopsy Samples with a Calculator Algorithm To Detect High-risk Prostate Cancer. Eur Urol2016; 70:749-750
- Dickinson L, Ahmed HU, Allen C, Barentsz JO, Carey B, Futterer JJ, Heijmink SW, Hoskin PJ, Kirkham A, Padhani AR, Persad R, Puech P, Punwani S, Sohaib AS, Tombal B, Villers A, van der Meulen J, Emberton M. Magnetic resonance imaging for the detection, localisation, and characterisation of prostate cancer: recommendations from a European consensus meeting. Eur Urol2011; 59:477-494
- Pokorny MR, de Rooij M, Duncan E, Schroder FH, Parkinson R, Barentsz JO, Thompson LC. Prospective study of diagnostic accuracy comparing prostate cancer detection by transrectal ultrasound-guided biopsy versus magnetic resonance (MR) imaging with subsequent MR-guided biopsy in men without previous prostate biopsies. Eur Urol2014; 66:22-29
- Thompson J, Lawrentschuk N, Frydenberg M, Thompson L, Stricker P, Usanz. The role of magnetic resonance imaging in the diagnosis and management of prostate cancer. BJU international2013; 112 Suppl 2:6-20
- Thompson JE, Moses D, Shnier R, Brenner P, Delprado W, Ponsky L, Pulbrook M, Bohm M, Haynes AM, Hayen A, Stricker PD. Multiparametric magnetic resonance imaging guided diagnostic biopsy detects significant prostate cancer and could reduce unnecessary biopsies and over detection: a prospective study. The Journal of urology2014; 192:67-74
- Barentsz JO, Weinreb JC, Verma S, Thoeny HC, Tempany CM, Shtern F, Padhani AR, Margolis D, Macura KJ, Haider MA, Cornud F, Choyke PL. Synopsis of the PI-RADS v2 Guidelines for Multiparametric Prostate Magnetic Resonance Imaging and Recommendations for Use. Eur Urol2016; 69:41-49
- Moore CM, Kasivisvanathan V, Eggener S, Emberton M, Futterer JJ, Gill IS, Grubb Iii RL, Hadaschik B, Klotz L, Margolis DJ, Marks LS, Melamed J, Oto A, Palmer SL, Pinto P, Puech P, Punwani S, Rosenkrantz AB, Schoots IG, Simon R, Taneja SS, Turkbey B, Ukimura O, van der Meulen J, Villers A, Watanabe Y, Consortium S. Standards of reporting for MRI-targeted biopsy studies (START) of the prostate: recommendations from an International Working Group. Eur Urol2013; 64:544-552
- Rosenkrantz AB, Taneja SS. Radiologist, be aware: ten pitfalls that confound the interpretation of multiparametric prostate MRI. AJR Am J Roentgenol2014; 202:109-120
- Kuru TH, Roethke MC, Rieker P, Roth W, Fenchel M, Hohenfellner M, Schlemmer HP, Hadaschik BA. Histology core-specific evaluation of the European Society of Urogenital Radiology (ESUR) standardised scoring system of multiparametric magnetic resonance imaging (mpMRI) of the prostate. BJU international2013; 112:1080-1087
- de Rooij M, Hamoen EH, Futterer JJ, Barentsz JO, Rovers MM. Accuracy of multiparametric MRI for prostate cancer detection: a meta-analysis. AJR Am J Roentgenol2014; 202:343-351
- Futterer JJ. Multiparametric MRI in the Detection of Clinically Significant Prostate Cancer. Korean J Radiol2017; 18:597-606
- Ahmed HU, El-Shater Bosaily A, Brown LC, Gabe R, Kaplan R, Parmar MK, Collaco-Moraes Y, Ward K, Hindley RG, Freeman A, Kirkham AP, Oldroyd R, Parker C, Emberton M, group Ps. Diagnostic accuracy of multi-parametric MRI and TRUS biopsy in prostate cancer (PROMIS): a paired validating confirmatory study. Lancet (London, England)2017; 389:815-822
- Woo S, Suh CH, Kim SY, Cho JY, Kim SH. Diagnostic Performance of Prostate Imaging Reporting and Data System Version 2 for Detection of Prostate Cancer: A Systematic Review and Diagnostic Meta-analysis. Eur Urol2017; 72:177-188
- Roehl KA, Antenor JA, Catalona WJ. Serial biopsy results in prostate cancer screening study. The Journal of urology2002; 167:2435-2439
- Shinohara K, Nguyen H, Masic S. Management of an increasing prostate-specific antigen level after negative prostate biopsy. The Urologic clinics of North America2014; 41:327-338
- Hambrock T, Somford DM, Hoeks C, Bouwense SA, Huisman H, Yakar D, van Oort IM, Witjes JA, Futterer JJ, Barentsz JO. Magnetic resonance imaging guided prostate biopsy in men with repeat negative biopsies and increased prostate specific antigen. The Journal of urology2010; 183:520-527
- Hoeks CM, Schouten MG, Bomers JG, Hoogendoorn SP, Hulsbergen-van de Kaa CA, Hambrock T, Vergunst H, Sedelaar JP, Futterer JJ, Barentsz JO. Three-Tesla magnetic resonance-guided prostate biopsy in men with increased prostate-specific antigen and repeated, negative, random, systematic, transrectal ultrasound biopsies: detection of clinically significant prostate cancers. Eur Urol2012; 62:902-909
- Truong M, Frye TP. Magnetic resonance imaging detection of prostate cancer in men with previous negative prostate biopsy. Transl Androl Urol2017; 6:424-431
- Daneshgari F, Taylor GD, Miller GJ, Crawford ED. Computer simulation of the probability of detecting low volume carcinoma of the prostate with six random systematic core biopsies. Urology1995; 45:604-609
- Gore JL, Shariat SF, Miles BJ, Kadmon D, Jiang N, Wheeler TM, Slawin KM. Optimal combinations of systematic sextant and laterally directed biopsies for the detection of prostate cancer. The Journal of urology2001; 165:1554-1559
- Presti JC, Jr., Chang JJ, Bhargava V, Shinohara K. The optimal systematic prostate biopsy scheme should include 8 rather than 6 biopsies: results of a prospective clinical trial. The Journal of urology2000; 163:163-166; discussion 166-167
- Vashi AR, Wojno KJ, Gillespie B, Oesterling JE. A model for the number of cores per prostate biopsy based on patient age and prostate gland volume. The Journal of urology1998; 159:920-924
- Siddiqui MM, Rais-Bahrami S, Turkbey B, George AK, Rothwax J, Shakir N, Okoro C, Raskolnikov D, Parnes HL, Linehan WM, Merino MJ, Simon RM, Choyke PL, Wood BJ, Pinto PA. Comparison of MR/ultrasound fusion-guided biopsy with ultrasound-guided biopsy for the diagnosis of prostate cancer. Jama2015; 313:390-397
- Schaeffer EM, Carter HB, Kettermann A, Loeb S, Ferrucci L, Landis P, Trock BJ, Metter EJ. Prostate specific antigen testing among the elderly--when to stop? The Journal of urology2009; 181:1606-1614; discussion 1613-1604
- Mottet N, Bellmunt J, Bolla M, Briers E, Cumberbatch MG, De Santis M, Fossati N, Gross T, Henry AM, Joniau S, Lam TB, Mason MD, Matveev VB, Moldovan PC, van den Bergh RCN, Van den Broeck T, van der Poel HG, van der Kwast TH, Rouviere O, Schoots IG, Wiegel T, Cornford P. EAU-ESTRO-SIOG Guidelines on Prostate Cancer. Part 1: Screening, Diagnosis, and Local Treatment with Curative Intent. Eur Urol2017; 71:618-629
- Loeb S, Carter HB, Berndt SI, Ricker W, Schaeffer EM. Complications after prostate biopsy: data from SEER-Medicare. The Journal of urology2011; 186:1830-1834
- Ismail MT, Gomella LG. Transrectal prostate biopsy. The Urologic clinics of North America2013; 40:457-472
- Loeb S, Vellekoop A, Ahmed HU, Catto J, Emberton M, Nam R, Rosario DJ, Scattoni V, Lotan Y. Systematic review of complications of prostate biopsy. Eur Urol2013; 64:876-892
- Zani EL, Clark OA, Rodrigues Netto N, Jr. Antibiotic prophylaxis for transrectal prostate biopsy. Cochrane Database Syst Rev2011:CD006576
- Liss MA, Ehdaie B, Loeb S, Meng MV, Raman JD, Spears V, Stroup SP. An Update of the American Urological Association White Paper on the Prevention and Treatment of the More Common Complications Related to Prostate Biopsy. The Journal of urology2017;
- Carignan A, Roussy JF, Lapointe V, Valiquette L, Sabbagh R, Pepin J. Increasing risk of infectious complications after transrectal ultrasound-guided prostate biopsies: time to reassess antimicrobial prophylaxis? Eur Urol2012; 62:453-459
- Borghesi M, Ahmed H, Nam R, Schaeffer E, Schiavina R, Taneja S, Weidner W, Loeb S. Complications After Systematic, Random, and Image-guided Prostate Biopsy. Eur Urol2017; 71:353-365
- Abughosh Z, Margolick J, Goldenberg SL, Taylor SA, Afshar K, Bell R, Lange D, Bowie WR, Roscoe D, Machan L, Black PC. A prospective randomized trial of povidone-iodine prophylactic cleansing of the rectum before transrectal ultrasound guided prostate biopsy. The Journal of urology2013; 189:1326-1331
- Bennett HY, Roberts MJ, Doi SA, Gardiner RA. The global burden of major infectious complications following prostate biopsy. Epidemiol Infect2016; 144:1784-1791
- Williamson DA, Roberts SA, Paterson DL, Sidjabat H, Silvey A, Masters J, Rice M, Freeman JT. Escherichia coli bloodstream infection after transrectal ultrasound-guided prostate biopsy: implications of fluoroquinolone-resistant sequence type 131 as a major causative pathogen. Clin Infect Dis2012; 54:1406-1412
- Roberts MJ, Williamson DA, Hadway P, Doi SA, Gardiner RA, Paterson DL. Baseline prevalence of antimicrobial resistance and subsequent infection following prostate biopsy using empirical or altered prophylaxis: A bias-adjusted meta-analysis. International journal of antimicrobial agents2014; 43:301-309
- Manecksha RP, Nason GJ, Cullen IM, Fennell JP, McEvoy E, McDermott T, Flynn RJ, Grainger R, Thornhill JA. Prospective study of antibiotic prophylaxis for prostate biopsy involving >1100 men. ScientificWorldJournal2012; 2012:650858
- Roberts MJ, Bennett HY, Harris PN, Holmes M, Grummet J, Naber K, Wagenlehner FME. Prostate Biopsy-related Infection: A Systematic Review of Risk Factors, Prevention Strategies, and Management Approaches. Urology2017; 104:11-21
- Zowawi HM, Harris PN, Roberts MJ, Tambyah PA, Schembri MA, Pezzani MD, Williamson DA, Paterson DL. The emerging threat of multidrug-resistant Gram-negative bacteria in urology. Nat Rev Urol2015; 12:570-584
- Yaxley AJ, Yaxley JW, Thangasamy IA, Ballard E, Pokorny MR. Comparison between target magnetic resonance imaging (MRI) in-gantry and cognitively directed transperineal or transrectal-guided prostate biopsies for Prostate Imaging-Reporting and Data System (PI-RADS) 3-5 MRI lesions. BJU international2017; 120 Suppl 3:43-50
- Bains LJ, Studer UE, Froehlich JM, Giannarini G, Triantafyllou M, Fleischmann A, Thoeny HC. Diffusion-weighted magnetic resonance imaging detects significant prostate cancer with high probability. The Journal of urology2014; 192:737-742
- Thompson JE, van Leeuwen PJ, Moses D, Shnier R, Brenner P, Delprado W, Pulbrook M, Bohm M, Haynes AM, Hayen A, Stricker PD. The Diagnostic Performance of Multiparametric Magnetic Resonance Imaging to Detect Significant Prostate Cancer. The Journal of urology2016; 195:1428-1435
- Epstein JI, Amin MB, Reuter VE, Humphrey PA. Contemporary Gleason Grading of Prostatic Carcinoma: An Update With Discussion on Practical Issues to Implement the 2014 International Society of Urological Pathology (ISUP) Consensus Conference on Gleason Grading of Prostatic Carcinoma. Am J Surg Pathol2017; 41:e1-e7
- Amin MB, Lin DW, Gore JL, Srigley JR, Samaratunga H, Egevad L, Rubin M, Nacey J, Carter HB, Klotz L, Sandler H, Zietman AL, Holden S, Montironi R, Humphrey PA, Evans AJ, Epstein JI, Delahunt B, McKenney JK, Berney D, Wheeler TM, Chinnaiyan AM, True L, Knudsen B, Hammond ME. The critical role of the pathologist in determining eligibility for active surveillance as a management option in patients with prostate cancer: consensus statement with recommendations supported by the College of American Pathologists, International Society of Urological Pathology, Association of Directors of Anatomic and Surgical Pathology, the New Zealand Society of Pathologists, and the Prostate Cancer Foundation. Archives of pathology & laboratory medicine2014; 138:1387-1405
- de la Taille A, Katz A, Bagiella E, Olsson CA, O'Toole KM, Rubin MA. Perineural invasion on prostate needle biopsy: an independent predictor of final pathologic stage. Urology1999; 54:1039-1043
- Sanwick JM, Dalkin BL, Nagle RB. Accuracy of prostate needle biopsy in predicting extracapsular tumor extension at radical retropubic prostatectomy: application in selecting patients for nerve-sparing surgery. Urology1998; 52:814-818; discussion 818-819
- Sebo TJ, Bock BJ, Cheville JC, Lohse C, Wollan P, Zincke H. The percent of cores positive for cancer in prostate needle biopsy specimens is strongly predictive of tumor stage and volume at radical prostatectomy. The Journal of urology2000; 163:174-178
- Egevad L, Delahunt B, Kristiansen G, Samaratunga H, Varma M. Contemporary prognostic indicators for prostate cancer incorporating International Society of Urological Pathology recommendations. Pathology2018; 50:60-73
- Srigley JR, Delahunt B, Egevad L, Samaratunga H, Yaxley J, Evans AJ. One is the new six: The International Society of Urological Pathology (ISUP) patient-focused approach to Gleason grading. Canadian Urological Association journal = Journal de l'Association des urologues du Canada2016; 10:339-341
- Epstein JI, Partin AW, Sauvageot J, Walsh PC. Prediction of progression following radical prostatectomy. A multivariate analysis of 721 men with long-term follow-up. Am J Surg Pathol1996; 20:286-292
- McNeal JE, Villers AA, Redwine EA, Freiha FS, Stamey TA. Histologic differentiation, cancer volume, and pelvic lymph node metastasis in adenocarcinoma of the prostate. Cancer1990; 66:1225-1233
- Sauter G, Steurer S, Clauditz TS, Krech T, Wittmer C, Lutz F, Lennartz M, Janssen T, Hakimi N, Simon R, von Petersdorff-Campen M, Jacobsen F, von Loga K, Wilczak W, Minner S, Tsourlakis MC, Chirico V, Haese A, Heinzer H, Beyer B, Graefen M, Michl U, Salomon G, Steuber T, Budaus LH, Hekeler E, Malsy-Mink J, Kutzera S, Fraune C, Gobel C, Huland H, Schlomm T. Clinical Utility of Quantitative Gleason Grading in Prostate Biopsies and Prostatectomy Specimens. Eur Urol2016; 69:592-598
- Egevad L, Delahunt B, Evans AJ, Grignon DJ, Kench JG, Kristiansen G, Leite KR, Samaratunga H, Srigley JR. International Society of Urological Pathology (ISUP) Grading of Prostate Cancer. Am J Surg Pathol2016; 40:858-861
- Samaratunga H, Delahunt B, Gianduzzo T, Coughlin G, Duffy D, LeFevre I, Johannsen S, Egevad L, Yaxley J. The prognostic significance of the 2014 International Society of Urological Pathology (ISUP) grading system for prostate cancer. Pathology2015; 47:515-519
- Delahunt B, Egevad L, Srigley JR, Steigler A, Murray JD, Atkinson C, Matthews J, Duchesne G, Spry NA, Christie D, Joseph D, Attia J, Denham JW. Validation of International Society of Urological Pathology (ISUP) grading for prostatic adenocarcinoma in thin core biopsies using TROG 03.04 'RADAR' trial clinical data. Pathology2015; 47:520-525
- Bostwick DG, Brawer MK. Prostatic intra-epithelial neoplasia and early invasion in prostate cancer. Cancer1987; 59:788-794
- Bostwick DG, Pacelli A, Lopez-Beltran A. Molecular biology of prostatic intraepithelial neoplasia. The Prostate1996; 29:117-134
- Haggman MJ, Macoska JA, Wojno KJ, Oesterling JE. The relationship between prostatic intraepithelial neoplasia and prostate cancer: critical issues. The Journal of urology1997; 158:12-22
- Schlesinger C, Bostwick DG, Iczkowski KA. High-grade prostatic intraepithelial neoplasia and atypical small acinar proliferation: predictive value for cancer in current practice. Am J Surg Pathol2005; 29:1201-1207
- Chan TY, Epstein JI. Follow-up of atypical prostate needle biopsies suspicious for cancer. Urology1999; 53:351-355
- Allen EA, Kahane H, Epstein JI. Repeat biopsy strategies for men with atypical diagnoses on initial prostate needle biopsy. Urology1998; 52:803-807
- Buyyounouski MK, Choyke PL, McKenney JK, Sartor O, Sandler HM, Amin MB, Kattan MW, Lin DW. Prostate cancer – major changes in the American Joint Committee on Cancer eighth edition cancer staging manual. CA Cancer J Clin2017; 67:245-253
- Bartsch G, Horninger W, Klocker H, Pelzer A, Bektic J, Oberaigner W, Schennach H, Schafer G, Frauscher F, Boniol M, Severi G, Robertson C, Boyle P, Tyrol Prostate Cancer Screening G. Tyrol Prostate Cancer Demonstration Project: early detection, treatment, outcome, incidence and mortality. BJU international2008; 101:809-816
- Andriole GL, Crawford ED, Grubb RL, 3rd, Buys SS, Chia D, Church TR, Fouad MN, Gelmann EP, Kvale PA, Reding DJ, Weissfeld JL, Yokochi LA, O'Brien B, Clapp JD, Rathmell JM, Riley TL, Hayes RB, Kramer BS, Izmirlian G, Miller AB, Pinsky PF, Prorok PC, Gohagan JK, Berg CD, Team PP. Mortality results from a randomized prostate-cancer screening trial. N Engl J Med2009; 360:1310-1319
- Andriole GL, Crawford ED, Grubb RL, 3rd, Buys SS, Chia D, Church TR, Fouad MN, Isaacs C, Kvale PA, Reding DJ, Weissfeld JL, Yokochi LA, O'Brien B, Ragard LR, Clapp JD, Rathmell JM, Riley TL, Hsing AW, Izmirlian G, Pinsky PF, Kramer BS, Miller AB, Gohagan JK, Prorok PC, Team PP. Prostate cancer screening in the randomized Prostate, Lung, Colorectal, and Ovarian Cancer Screening Trial: mortality results after 13 years of follow-up. Journal of the National Cancer Institute2012; 104:125-132
- Schroder FH, Hugosson J, Roobol MJ, Tammela TL, Ciatto S, Nelen V, Kwiatkowski M, Lujan M, Lilja H, Zappa M, Denis LJ, Recker F, Paez A, Maattanen L, Bangma CH, Aus G, Carlsson S, Villers A, Rebillard X, van der Kwast T, Kujala PM, Blijenberg BG, Stenman UH, Huber A, Taari K, Hakama M, Moss SM, de Koning HJ, Auvinen A, Investigators E. Prostate-cancer mortality at 11 years of follow-up. N Engl J Med2012; 366:981-990
- Hugosson J, Carlsson S, Aus G, Bergdahl S, Khatami A, Lodding P, Pihl CG, Stranne J, Holmberg E, Lilja H. Mortality results from the Goteborg randomised population-based prostate-cancer screening trial. Lancet Oncol2010; 11:725-732
- Sandblom G, Varenhorst E, Rosell J, Lofman O, Carlsson P. Randomised prostate cancer screening trial: 20 year follow-up. BMJ (Clinical research ed)2011; 342:d1539
- Kjellman A, Akre O, Norming U, Tornblom M, Gustafsson O. 15-year followup of a population based prostate cancer screening study. The Journal of urology2009; 181:1615-1621; discussion 1621
- Labrie F, Candas B, Cusan L, Gomez JL, Belanger A, Brousseau G, Chevrette E, Levesque J. Screening decreases prostate cancer mortality: 11-year follow-up of the 1988 Quebec prospective randomized controlled trial. The Prostate2004; 59:311-318
- Shoag JE, Mittal S, Hu JC. Reevaluating PSA Testing Rates in the PLCO Trial. New England Journal of Medicine2016; 374:1795-1796
- Hugosson J, Carlsson SV. The dilemmas of prostate cancer screening. Med J Aust2013; 198:528-529
- Arsov C, Becker N, Hadaschik BA, Hohenfellner M, Herkommer K, Gschwend JE, Imkamp F, Kuczyk MA, Antoch G, Kristiansen G, Siener R, Semjonow A, Hamdy FC, Lilja H, Vickers AJ, Schroder FH, Albers P. Prospective randomized evaluation of risk-adapted prostate-specific antigen screening in young men: the PROBASE trial. Eur Urol2013; 64:873-875
- Gardiner RF, Yaxley J, Baade PD. Integrating disparate snippets of information in an approach to PSA testing in Australia and New Zealand. BJU international2012; 110 Suppl 4:35-37
- Stricker PD, Frydenberg M, Kneebone A, Chopra S. Informed prostate cancer risk-adjusted testing: a new paradigm. BJU international2012; 110 Suppl 4:30-34
- Schroder FH, Hugosson J, Roobol MJ, Tammela TL, Zappa M, Nelen V, Kwiatkowski M, Lujan M, Maattanen L, Lilja H, Denis LJ, Recker F, Paez A, Bangma CH, Carlsson S, Puliti D, Villers A, Rebillard X, Hakama M, Stenman UH, Kujala P, Taari K, Aus G, Huber A, van der Kwast TH, van Schaik RH, de Koning HJ, Moss SM, Auvinen A, Investigators E. Screening and prostate cancer mortality: results of the European Randomised Study of Screening for Prostate Cancer (ERSPC) at 13 years of follow-up. Lancet (London, England)2014; 384:2027-2035
- Tsodikov A, Gulati R, Heijnsdijk EAM, Pinsky PF, Moss SM, Qiu S, de Carvalho TM, Hugosson J, Berg CD, Auvinen A, Andriole GL, Roobol MJ, Crawford ED, Nelen V, Kwiatkowski M, Zappa M, Lujan M, Villers A, Feuer EJ, de Koning HJ, Mariotto AB, Etzioni R. Reconciling the Effects of Screening on Prostate Cancer Mortality in the ERSPC and PLCO Trials. Ann Intern Med2017; 167:449-455
- Vickers AJ. Prostate Cancer Screening: Time to Question How to Optimize the Ratio of Benefits and Harms. Ann Intern Med2017; 167:509-510
- Carlsson S, Assel M, Sjoberg D, Ulmert D, Hugosson J, Lilja H, Vickers A. Influence of blood prostate specific antigen levels at age 60 on benefits and harms of prostate cancer screening: population based cohort study. BMJ (Clinical research ed)2014; 348:g2296
- Litwin MS, Greenfield S, Elkin EP, Lubeck DP, Broering JM, Kaplan SH. Assessment of prognosis with the total illness burden index for prostate cancer: aiding clinicians in treatment choice. Cancer2007; 109:1777-1783
- Briganti A, Spahn M, Joniau S, Gontero P, Bianchi M, Kneitz B, Chun FK, Sun M, Graefen M, Abdollah F, Marchioro G, Frohenberg D, Giona S, Frea B, Karakiewicz PI, Montorsi F, Van Poppel H, Jeffrey Karnes R, European Multicenter Prostate Cancer C, Translational Research G. Impact of age and comorbidities on long-term survival of patients with high-risk prostate cancer treated with radical prostatectomy: a multi-institutional competing-risks analysis. Eur Urol2013; 63:693-701
- Lee JY, Lee DH, Cho NH, Rha KH, Choi YD, Hong SJ, Yang SC, Cho KS. Impact of Charlson comorbidity index varies by age in patients with prostate cancer treated by radical prostatectomy: a competing risk regression analysis. Ann Surg Oncol2014; 21:677-683
- Froehner M, Hentschel C, Koch R, Litz RJ, Hakenberg OW, Wirth MP. Which comorbidity classification best fits elderly candidates for radical prostatectomy? Urol Oncol2013; 31:461-467
- Chew KK, Gibson N, Sanfilippo F, Stuckey B, Bremner A. Cardiovascular mortality in men with erectile dysfunction: increased risk but not inevitable. J Sex Med2011; 8:1761-1771
- Banks E, Joshy G, Abhayaratna WP, Kritharides L, Macdonald PS, Korda RJ, Chalmers JP. Erectile dysfunction severity as a risk marker for cardiovascular disease hospitalisation and all-cause mortality: a prospective cohort study. PLoS Med2013; 10:e1001372
- Bill-Axelson A, Holmberg L, Garmo H, Rider JR, Taari K, Busch C, Nordling S, Haggman M, Andersson SO, Spangberg A, Andren O, Palmgren J, Steineck G, Adami HO, Johansson JE. Radical prostatectomy or watchful waiting in early prostate cancer. N Engl J Med2014; 370:932-942
- Vickers A, Bennette C, Steineck G, Adami HO, Johansson JE, Bill-Axelson A, Palmgren J, Garmo H, Holmberg L. Individualized estimation of the benefit of radical prostatectomy from the Scandinavian Prostate Cancer Group randomized trial. Eur Urol2012; 62:204-209
- Crawford ED, Grubb R, 3rd, Black A, Andriole GL, Jr., Chen MH, Izmirlian G, Berg CD, D'Amico AV. Comorbidity and mortality results from a randomized prostate cancer screening trial. Journal of clinical oncology : official journal of the American Society of Clinical Oncology2011; 29:355-361
- National Health Data Dictionary: version16.2.Australian Institute of Health and Welfare (AIHW);2015.
- Moyer VA, Force USPST. Screening for prostate cancer: U.S. Preventive Services Task Force recommendation statement. Ann Intern Med2012; 157:120-134
- Chambers SK, Zajdlewicz L, Youlden DR, Holland JC, Dunn J. The validity of the distress thermometer in prostate cancer populations. Psychooncology2014; 23:195-203
- Bill-Axelson A, Garmo H, Lambe M, Bratt O, Adolfsson J, Nyberg U, Steineck G, Stattin P. Suicide risk in men with prostate-specific antigen-detected early prostate cancer: a nationwide population-based cohort study from PCBaSe Sweden. Eur Urol2010; 57:390-395
- Carlsson S, Sandin F, Fall K, Lambe M, Adolfsson J, Stattin P, Bill-Axelson A. Risk of suicide in men with low-risk prostate cancer. Eur J Cancer2013; 49:1588-1599
- Fall K, Fang F, Mucci LA, Ye W, Andren O, Johansson JE, Andersson SO, Sparen P, Klein G, Stampfer M, Adami HO, Valdimarsdottir U. Immediate risk for cardiovascular events and suicide following a prostate cancer diagnosis: prospective cohort study. PLoS Med2009; 6:e1000197
- Chambers SK DJ, Lazenby M, Clutton S, Newton RU, Cormie P, Lowe A, Sandoe D, Gardiner RA. . ProsCare: A psychological care model for men with prostate cancer Australia: Prostate Cancer Foundation of Australia and Griffith University.
- Chambers SK, Hyde MK, Smith DP, Hughes S, Yuill S, Egger S, O'Connell DL, Stein K, Frydenberg M, Wittert G, Dunn J. New Challenges in Psycho‐Oncology Research III: A systematic review of psychological interventions for prostate cancer survivors and their partners: clinical and research implications. Psycho-Oncology2017; 26:873-913
- Goh AC, Kowalkowski MA, Bailey DE, Jr., Kazer MW, Knight SJ, Latini DM. Perception of cancer and inconsistency in medical information are associated with decisional conflict: a pilot study of men with prostate cancer who undergo active surveillance. BJU international2012; 110:E50-56
- Steginga SK, Occhipinti S, Gardiner RA, Yaxley J, Heathcote P. Making decisions about treatment for localized prostate cancer. BJU international2002; 89:255-260
- Chambers SK, Pinnock C, Lepore SJ, Hughes S, O'Connell DL. A systematic review of psychosocial interventions for men with prostate cancer and their partners. Patient Educ Couns2011; 85:e75-88
- Bill-Axelson A, Holmberg L, Ruutu M, Garmo H, Stark JR, Busch C, Nordling S, Haggman M, Andersson SO, Bratell S, Spangberg A, Palmgren J, Steineck G, Adami HO, Johansson JE, Investigators S-. Radical prostatectomy versus watchful waiting in early prostate cancer. N Engl J Med2011; 364:1708-1717
- Wilt TJ, Brawer MK, Jones KM, Barry MJ, Aronson WJ, Fox S, Gingrich JR, Wei JT, Gilhooly P, Grob BM, Nsouli I, Iyer P, Cartagena R, Snider G, Roehrborn C, Sharifi R, Blank W, Pandya P, Andriole GL, Culkin D, Wheeler T, Prostate Cancer Intervention versus Observation Trial Study G. Radical prostatectomy versus observation for localized prostate cancer. N Engl J Med2012; 367:203-213
- Barry MJ, Andriole GL, Culkin DJ, Fox SH, Jones KM, Carlyle MH, Wilt TJ. Ascertaining cause of death among men in the prostate cancer intervention versus observation trial. Clin Trials2013; 10:907-914
- Thompson IM, Jr., Tangen CM. Prostate cancer--uncertainty and a way forward. N Engl J Med2012; 367:270-271
- Clarke NW. The management of hormone-relapsed prostate cancer. BJU international2003; 92:860-868
- Melia J, Hewitson P, Austoker J. Introduction: Review of screening for prostate cancer. BJU international2005; 95 Suppl 3:1-3
- Frosch DL, Kaplan RM. Shared decision making in clinical medicine: past research and future directions. Am J Prev Med1999; 17:285-294
- Elwyn G, Edwards A, Kinnersley P. Shared decision-making in primary care: the neglected second half of the consultation. Br J Gen Pract1999; 49:477-482
- Davison BJ, Degner LF, Morgan TR. Information and decision-making preferences of men with prostate cancer. Oncol Nurs Forum1995; 22:1401-1408
- Davison BJ, Gleave ME, Goldenberg SL, Degner LF, Hoffart D, Berkowitz J. Assessing information and decision preferences of men with prostate cancer and their partners. Cancer Nurs2002; 25:42-49
- Barry MJ. Involving patients in medical decisions: how can physicians do better? Jama1999; 282:2356-2357
- Braddock CH, 3rd, Edwards KA, Hasenberg NM, Laidley TL, Levinson W. Informed decision making in outpatient practice: time to get back to basics. Jama1999; 282:2313-2320
- O'Connor AM, Bennett CL, Stacey D, Barry M, Col NF, Eden KB, Entwistle VA, Fiset V, Holmes-Rovner M, Khangura S, Llewellyn-Thomas H, Rovner D. Decision aids for people facing health treatment or screening decisions. Cochrane Database Syst Rev2009:CD001431
- Wilkinson S, Chodak G. Informed consent for prostate-specific antigen screening. Urology2003; 61:2-4
- Bird S. Risk management. Discussing benefits and risks with patients. PSA testing. Aust Fam Physician2004; 33:266-267
- Dunn IB, Kirk D. Legal pitfalls in the diagnosis of prostate cancer. BJU international2000; 86:304-307
- Carter HB. Informed consent for prostate-specific antigen screening. Urology2003; 61:13-14
- Ito K, Schroder FH. Informed consent for prostate-specific antigen-based screening - European view. Urology2003; 61:20-22
- Hewitson P, Austoker J. Part 2: Patient information, informed decision-making and the psycho-social impact of prostate-specific antigen testing. BJU international2005; 95 Suppl 3:16-32
- Chan EC, Sulmasy DP. What should men know about prostate-specific antigen screening before giving informed consent? Am J Med1998; 105:266-274
- Council GM. Consent: patients and doctors making decisions together.General Medical Council;2008.
- Bratt O, Damber JE, Emanuelsson M, Kristoffersson U, Lundgren R, Olsson H, Gronberg H. Risk perception, screening practice and interest in genetic testing among unaffected men in families with hereditary prostate cancer. Eur J Cancer2000; 36:235-241
- Brown CT, O'Flynn E, Van Der Meulen J, Newman S, Mundy AR, Emberton M. The fear of prostate cancer in men with lower urinary tract symptoms: should symptomatic men be screened? BJU international2003; 91:30-32
- Roberts RO, Rhodes T, Panser LA, Girman CJ, Chute CG, Oesterling JE, Lieber MM, Jacobsen SJ. Natural history of prostatism: worry and embarrassment from urinary symptoms and health care-seeking behavior. Urology1994; 43:621-628
- Lloyd A, Hayes P, Bell PR, Naylor AR. The role of risk and benefit perception in informed consent for surgery. Med Decis Making2001; 21:141-149
- Redelmeier DA, Rozin P, Kahneman D. Understanding patients' decisions. Cognitive and emotional perspectives. Jama1993; 270:72-76
- Baade PD, Steginga SK, Pinnock CB, Aitken JF. Communicating prostate cancer risk: what should we be telling our patients? Med J Aust2005; 182:472-475
- Gigerenzer G, Edwards A. Simple tools for understanding risks: from innumeracy to insight. BMJ (Clinical research ed)2003; 327:741-744
- Gurmankin AD, Baron J, Armstrong K. The effect of numerical statements of risk on trust and comfort with hypothetical physician risk communication. Med Decis Making2004; 24:265-271
- Paling J. Strategies to help patients understand risks. BMJ (Clinical research ed)2003; 327:745-748
- O'Connor AM, Rostom A, Fiset V, Tetroe J, Entwistle V, Llewellyn-Thomas H, Holmes-Rovner M, Barry M, Jones J. Decision aids for patients facing health treatment or screening decisions: systematic review. BMJ (Clinical research ed)1999; 319:731-734
- Chan EC, McFall SL, Byrd TL, Mullen PD, Volk RJ, Ureda J, Calderon-Mora J, Morales P, Valdes A, Kay Bartholomew L. A community-based intervention to promote informed decision making for prostate cancer screening among Hispanic American men changed knowledge and role preferences: a cluster RCT. Patient Educ Couns2011; 84:e44-51
- Lepore SJ, Wolf RL, Basch CE, Godfrey M, McGinty E, Shmukler C, Ullman R, Thomas N, Weinrich S. Informed decision making about prostate cancer testing in predominantly immigrant black men: a randomized controlled trial. Ann Behav Med2012; 44:320-330
- Myers RE, Daskalakis C, Kunkel EJ, Cocroft JR, Riggio JM, Capkin M, Braddock CH, 3rd. Mediated decision support in prostate cancer screening: a randomized controlled trial of decision counseling. Patient Educ Couns2011; 83:240-246
- Taylor KL, Williams RM, Davis K, Luta G, Penek S, Barry S, Kelly S, Tomko C, Schwartz M, Krist AH, Woolf SH, Fishman MB, Cole C, Miller E. Decision making in prostate cancer screening using decision aids vs usual care: a randomized clinical trial. JAMA Intern Med2013; 173:1704-1712
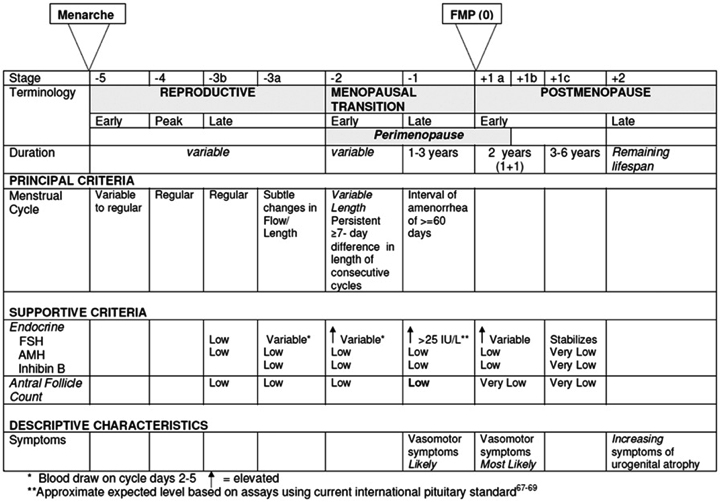
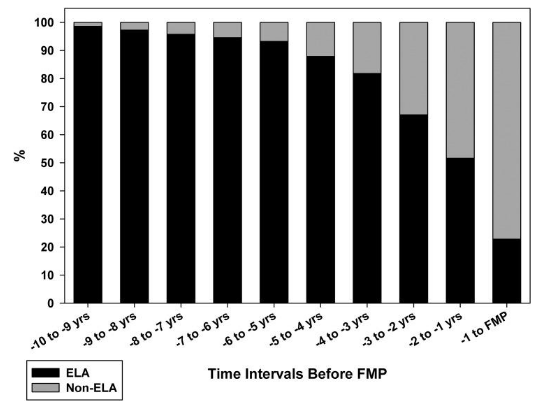
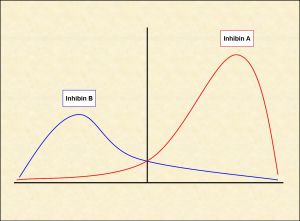
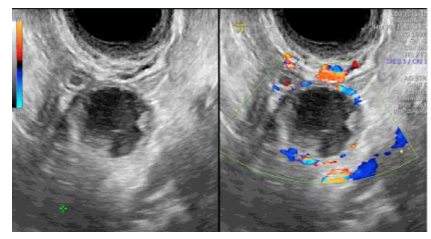
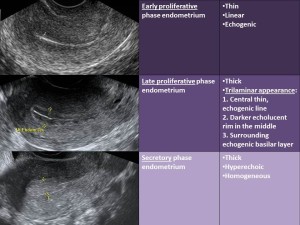
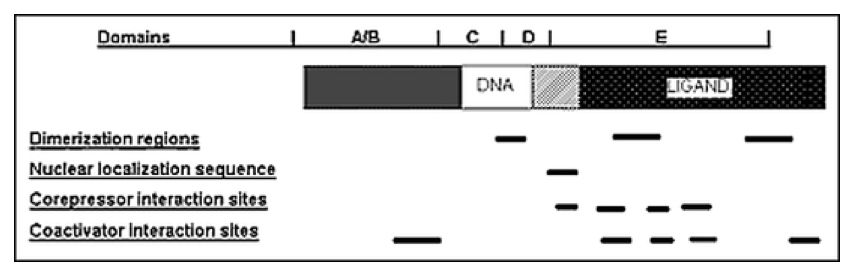
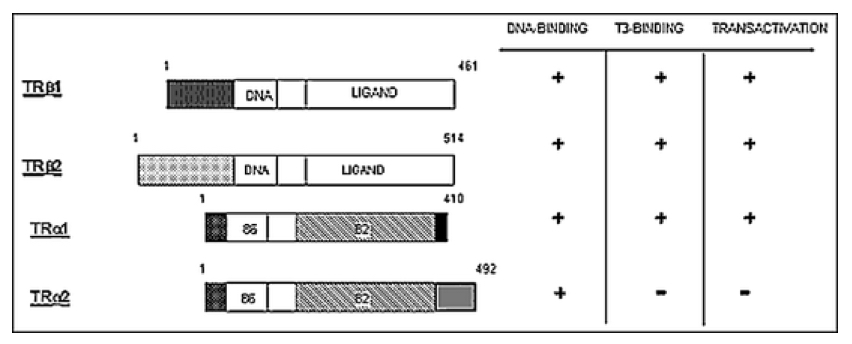
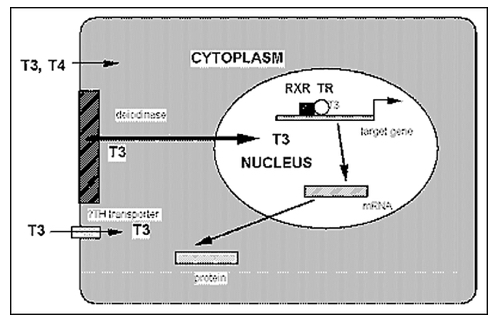
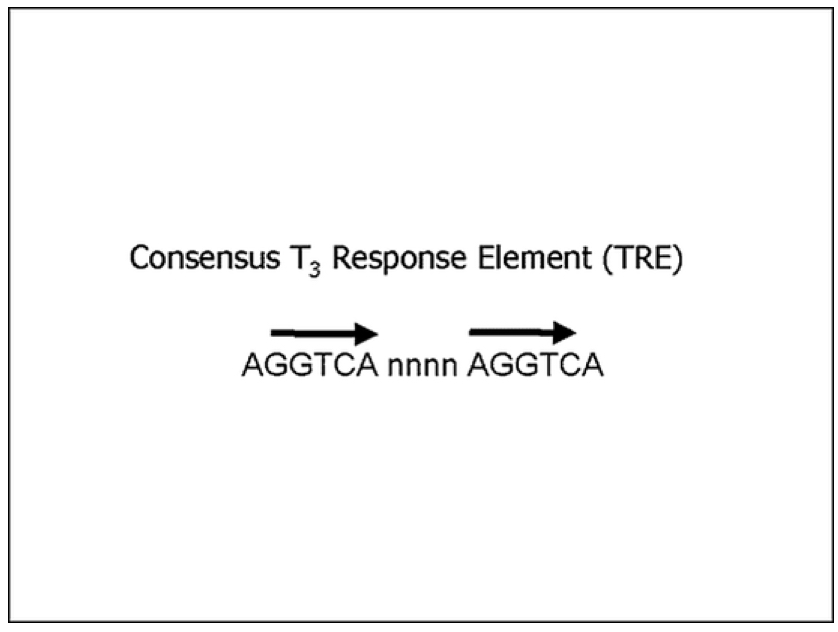
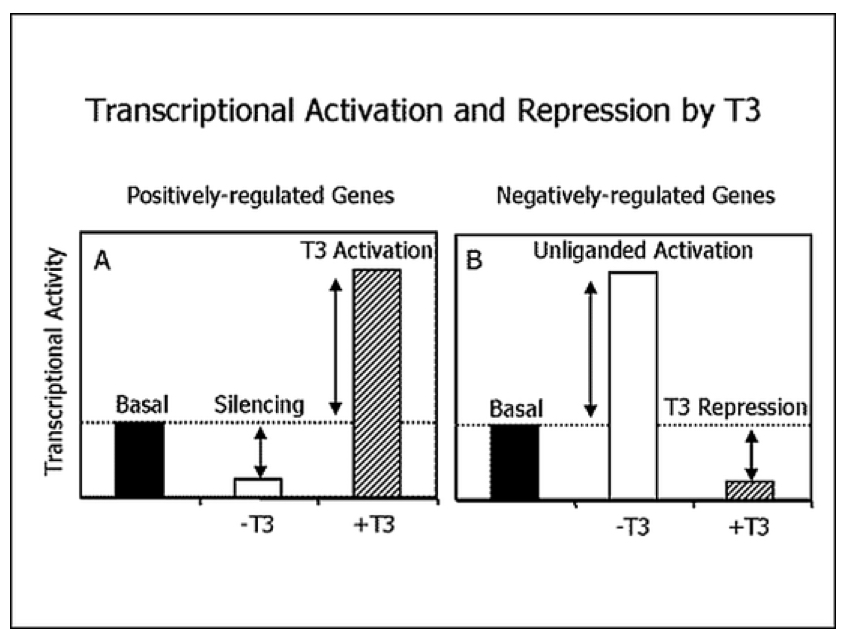
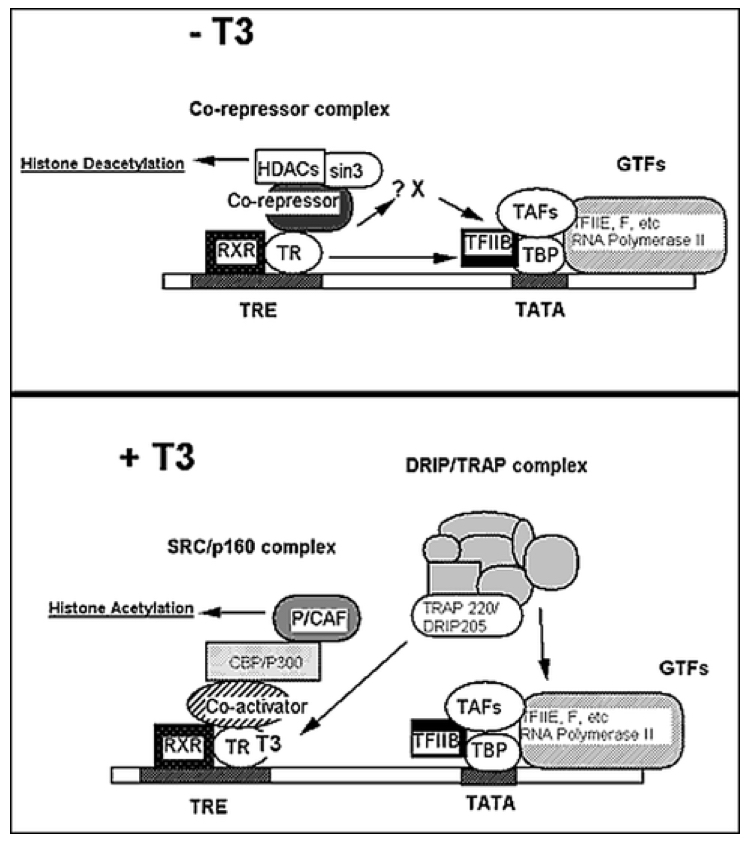
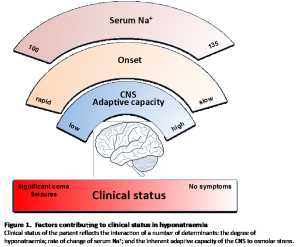

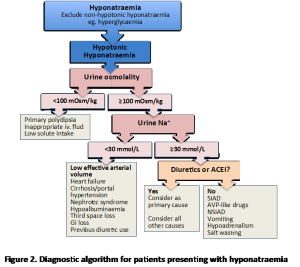
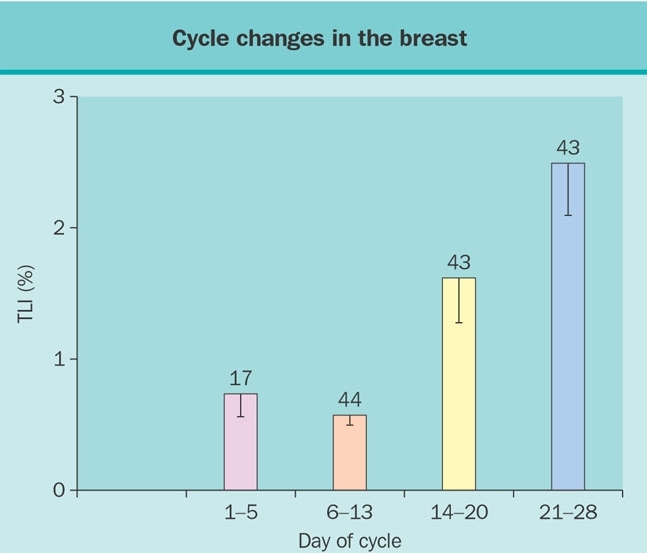 Figure 1. Influence of the cycle phase on breast total labeling index (TLI) of women less than 34 years of age according to whether cycles were natural or regulated by oral contraceptives (OC). (Reprinted with permission from Going JJ, Anderson TJ, Battersby et al. Proliferative and secretory activity in human breast during natural and artificial menstrual cycles (Am. J Pathol. 130:193-204, 1988).