Archives

Definitions, Classification, and Epidemiology of Obesity

ABSTRACT


Recent research has established the physiology of weight regulation, the pathophysiology that leads to unwanted weight gain with establishment of a higher body-weight set point, and the defense of the overweight and obese state even when reasonable attempts in lifestyle improvement are made. This knowledge has informed our approach to obesity as a chronic disease. The assessment of adiposity risk for the foreseeable future will continue to rely on cost-effective and easily available measures of height, weight, and waist circumference. This risk assessment then informs implementation of appropriate treatment plans and weight management goals. Within the United States, prevalence rates for generalized obesity (BMI > 30 kg/m2), extreme obesity (BMI > 40 kg/m2), and central obesity continue to rise in children and adults with peak obesity rates occurring in the 5th-6th decades. Women may have equal or greater obesity rates than men depending on race, but less central obesity than men. Obesity disproportionately affects people by race and ethnicity, with the highest prevalence rates reported in Black women and Hispanic men and women. Increasing obesity rates in youth (ages 2-19 years) are especially concerning. This trend will likely continue to fuel the global obesity epidemic for decades to come, worsening population health, creating infrastructural challenges as countries attempt to meet the additional health-care demands, and greatly increasing health-care expenditures world-wide. To meet this challenge, societal and economic innovations will be necessary that focus on strategies to prevent further increases in overweight and obesity rates.


INTRODUCTION


Unwanted weight gain leading to overweight and obesity has become a significant driver of the global rise in chronic, non-communicable diseases and is itself now considered a chronic disease. Because of the psychological and social stigmata that accompany developing overweight and obesity, those affected by these conditions are also vulnerable to discrimination in their personal and work lives, low self-esteem, and depression (1). These medical and psychological sequelae of obesity contribute to a major share of health-care expenditures and generate additional economic costs through loss of worker productivity, increased disability, and premature loss of life (2-4).


The recognition that being overweight or having obesity is a chronic disease and not simply due to poor self-control or a lack of will power comes from the past 70 years of research that has been steadily gaining insight into the physiology that governs body weight (homeostatic mechanisms involved in sensing and adapting to changes in the body’s internal metabolism, food availability, and activity levels so as to maintain fat content and body weight stability), the pathophysiology that leads to unwanted weight gain maintenance, and the roles that excess weight and fat maldistribution (adiposity) play in contributing to diabetes, dyslipidemia, heart disease, non-alcoholic fatty liver disease, obstructive sleep apnea, and many other chronic diseases (5,6).


Expression of overweight and obesity results from an interaction between an individual’s genetic predisposition to weight gain and environmental influences. Gene discovery in the field of weight regulation and obesity has identified several major monogenic defects resulting in hyperphagia accompanied by severe and early-onset obesity (7) as well as many more minor genes with more variable impact on weight and fat distribution, including age-of-onset and severity. Several of these major obesity genes now have a specific medication approved to treat affected individuals (8). However, currently known major and minor genes explain only a small portion of body weight variations in the population (7). Environmental contributors to obesity have also been identified (9) but countering these will likely require initiatives that fall far outside of the discussions taking place in the office setting between patient and provider since they involve making major societal changes regarding food quality and availability, work-related and leisure-time activities, and social and health determinants including disparities in socio-economic status, race, and gender.


Novel discoveries in the fields of neuroendocrine (6) and gastrointestinal control (10) of appetite and energy expenditure have led to an emerging portfolio of medications that, when added to behavioral and lifestyle improvements, can help restore appetite control and allow modest weight loss maintenance (8). They have also led to novel mechanisms that help to explain the superior outcomes, both in terms of meaningful and sustained weight loss as well as improvements or resolution of co-morbid conditions, following metabolic-bariatric procedures such as laparoscopic sleeve gastrectomy and gastric bypass (11,12). 


Subsequent chapters in this section of Endotext will delve more deeply into these determinants and scientific advances, providing a greater breadth of information regarding mechanisms, clinical manifestations, treatment options, and prevention strategies for those with overweight or obesity.


DEFINITION OF OVERWEIGHT AND OBESITY


Overweight and obesity occur when excess fat accumulation (globally, regionally, and in organs as ectopic lipids) increases risk for adverse health outcomes.  Like other chronic diseases, this definition does not require manifistation of an obesity-related complication, simply that the risk for one is increased. This allows for implementation of weight management strategies targeting treatment and prevention of these related conditions. It is important to point out that thresholds of excess adiposity can occur at different body weights and fat distributions depending on the person or population being referenced.


Ideally, an obesity classification system would be based on a practical measurement widely available to providers regardless of their setting, would accurately predict health risk (prognosis), and could be used to assign treatment stategies and goals. The most accurate measures of body fat adiposity such as underwater weighing, dual-energy x-ray absorptiometry (DEXA) scanning, computed tomograpy (CT), and magnetic resonance imaging (MRI) are impractical for use in everyday clinical encounters. Estimates of body fat, including body mass index (BMI, calculated by dividing the body weight in kilograms by height in meters squared) and waist circumference, have limitations compared to these imaging methods, but still provide relevant information and are easily obtained in a variety of practice settings.


It is worth pointing out two important caveats regarding cuurent thresholds used to diagnose overweight and obesity. The first is that although we favor the assignement of specific BMI cut-offs and increasing risk (Table 1), relationships between body weight or fat distribution and conditions that impair health actually represent a continum. For example, increased risk for type 2 diabetes and premature mortality occur well below a BMI of 30 kg/m2 (the threshold to define obesity in populations of European extraction) (13). It is in these earlier stages that preventative strategies to limit further weight gain and/or allow weight loss will have their greatest health benefits. The second is that historic relationships between increasing BMI thresholds and the precense and severity of co-morbidities have been disrupted as better treatments for obesity-complications become available. For example, in the past several decades, atherosclerotic cardiovascular (ASCVD) mortality has steadily declined in the US population (14) even as obesity rates have risen (see below). Although it is generally accepted that this decline in ASCVD deaths is due to better care outside the hospital during a coronary event (e.g., better coordination of “first responders” services such as ambulances and more widespread use by the public of cardiopulmonary resusitation and defibrillator units), advances in intensive care, smoking cessation, and in the office (increased use of aspirin, statins, PCSK9 inhibitors, and blood pressure medications) (15), these data have also been cited to support the claim that being overweight might actually protect against heart disease (16). In this regard, updated epidemiological data on the health outcomes related to being overweight or having obesity should include not just data on morbidity and mortality, but also health care metrics such as utilization and costs, medications used, and the number of treatment-related procedures performed.


CLASSIFICATION OF OVERWEIGHT, OBESITY, AND CENTRAL OBESITY


Fat Mass and Percent Body Fat


Fat mass can be directly measured by one of several imaging modalities, including DEXA, CT, and MRI, but these systems are impractical and cost prohibitive for general clinical use. Instead, they are mostly used for research. Fat mass can be measured indirectly using water (underwater weighing) or air displacement (BODPOD), or bioimpedance analysis (BIA). Each of these methods estimates the proportion of fat or non-fat mass and allows calcutation of percent body fat. Of these, BODPOD and BIA are often offered through fitness centers and clinics run by obesity medicine specialists. However, their general use in the care of patients who are overweight and with obesity is still limited. Interpretation of results from these procedures may be confounded by common conditions that accompany obesity, especially when fluid status is altered such as in congenstive heart failure, liver disease, or chronic kidney disease. Also, ranges for normal and abnormal are not well established for these methods and, in practical terms, knowing them will not change current recommendations to help patients achieve sustained weight loss.


Body Mass Index


Body mass index allows comparison of weights independently of stature across populations. Except in persons who have increased lean weight as a result of intense exercise or resistance training (e.g., bodybuilders), BMI correlates well with percentage of body fat, although this relationship is independently influenced by sex, age, and race (17). This is especially true for South Asians in whom evidence suggests that BMI-adjusted percent body fat is greater than other populations (18). In the United States, data from the second National Health and Nutrition Examination Survey (NHANES II) were used to define obesity in adults as a BMI of 27.3  kg/m2 or more for women and a BMI of 27.8  kg/m2 or more for men (19). These definitions were based on the gender-specific 85th percentile values of BMI for persons 20 to 29 years of age. In 1998, however, the National Institutes of Health (NIH) Expert Panel on the Identification, Evaluation, and Treatment of Overweight and Obesity in Adults adopted the World Health Organization (WHO) classification for overweight and obesity (Table 1) (20). The WHO classification, which predominantly applied to people of European ancestry, assigns increasing risk for comorbid conditions—including hypertension, type 2 diabetes mellitus, and cardiovascular disease—to persons with higher a BMI relative to persons of normal weight (BMI of 18.5 - 25  kg/m2) (Table 1). However, Asian populations are known to be at increased risk for diabetes and hypertension at lower BMI ranges than those for non-Asian groups due largely to predominance of central fat distribution and higer percentage fat mass (see below). Consequently, the WHO has suggested lower cutoff points for consideration of therapeutic intervention in Asians: a BMI of 18.5 to 23  kg/m2 represents acceptable risk, 23 to 27.5 kg/m2 confers increased risk, and 27.5  kg/m2 or higher represents high risk (21,22).


Table 1 Classification of Overweight and Obesity by BMI, Waist Circumference, and Associated Disease Risk. Adapted from reference (20).


BMI (kg/m2)

Obesity Class

Disease Risk* (Relative to Normal Weight and Waist Circumference)


Men ≤40 inches (≤ 102 cm) Women ≤ 35 inches (≤ 88 cm)

> 40 in (> 102 cm)

> 35 in (> 88 cm)


Underweight


< 18.5


-


-

Normal†

18.5–24.9


-

-

Overweight

25.0–29.9


Increased

High

Obesity

30.0–34.9

35.0–39.9

1

2

High

Very High

Very High

Very High

Extreme Obesity

≥ 40

3

Extremely High

Extremely High

*Disease risk for type 2 diabetes, hypertension, and cardiovascular disease.

†Increased waist circumference can also be a marker for increased risk even in persons of normal weight.


Fat Distribution (Central Obesity)


In addition to an increase in total body weight, a proportionally greater amount of fat in the abdomen or trunk compared with the hips and lower extremities has been associated with increased risk for metabolic syndrome, type 2 diabetes mellitus, hypertension, and heart disease in both men and women (23,24). Abdominal obesity is commonly reported as a waist-to-hip ratio, but it is most easily quantified by a single circumferential measurement obtained at the level of the superior iliac crest (20). For the practioner, waist circumference should be measured in a standardized way (20) at each patient’s visit along with body weight. The original US national guidelines on overweight and obesity categorized men at increased relative risk for co-morbidities such as diabetes and cardiovascular disease if they have a waist circumference greater than 102 cm (40 inches) and women if their waist circumference exceeds 88 cm (35 inches) (Table 1) (20). These waist circumference thresholds are also used to define the “metabolic syndrome” by the most recent guidelines from the American Heart Association and the National Lipid Association (e.g., triglyceride levels > 150 mg/dL, hypertension, elevated fasting glucose (100 – 125 mg/dL)) or prediabetes (hemoglobin A1c between 5.7 and 6.4%) (25,26). Thus, an overweight person with predominantly abdominal fat accumulation would be considered “high” risk for these diseases even if that person does not meet BMI criteria for obesity. Such persons would have “central obesity.” It is commonly accepted that the predictive value for increased health risk by waist circumference is in patients at lower BMI’s (< 35 kg/m2) since those with class 2 obesity or higher will nearly universally have waist circumferences that exceed disease risk cut-offs.


However, the relationships between central adiposity with co-morbidities are also a continuum and vary by race and ethnicity. For example, in those of Asian descent, abdominal (central) obesity has long been recognized to be a better disease risk predictor than BMI, especially for type 2 diabetes (27). As endorsed by the International Diabetes Federation (28) and summarized in a WHO report in 2008 (29), different countries and health organizations have adopted differing sex- and population-specific cut offs for waist circumference thresholds predictive of increased comorbidity risk. In addition to the US criteria, alternative thresholds for central obesity as measured by waist circumference include > 94 cm (37 inches) and > 80 cm (31.5 inches) for men and women of European anscestry and > 90 cm (35.5 inches) and > 80 cm (31.5 inches) for men and women of South Asian, Japanese, and Chinese origin (28,29), respectively. 


EPIDEMIOLOGY OF OVERWEIGHT AND OBESITY IN THE UNITED STATES


In the United States (US), data from the National Health and Nutrition Examination Survey using measured heights and weights shows that the steady increase in obesity prevalence in both children and adults over the past several decades has not waned, although there are exceptions among subpopulations as described in greater detail below. In the most recently published US report (2017-2020), 42.4% of adults (BMI ≥ 30 kg/m2) (30) and 20.9% of youth (BMI ≥ 95th percentile of age- and sex-specific growth charts) (31) have obesity, and the age-adjusted

prevalence of severe obesity (BMI ≥ 40 kg/m2) was 9.2% (30) (Figure 1).


Figure 1. Trends in age-adjusted obesity (BMI ≥ 30 kg/m2) and severe obesity (BMI ≥ 40 kg/m2) prevalence among adults aged 20 and over: United States, 1999–2000 through 2017–2018. Taken from reference (30).


Obesity and Severe Obesity in Adults:  Relationships with Age, Sex, and Demographics

Figure 2. Age-Adjusted Prevalence of Obesity and Severe Obesity in US Adults. National Health and Nutrition Examination Survey data, prevalence estimates are weighted and age-adjusted to the projected 2000 Census population using age groups 20-39, 40-59, and 60 or older. Significant linear trends (P < .001) for all groups except for obesity among non-Hispanic Black men, which increased from 1999-2000 to 2005-2006 and then leveled after 2005-2006. Data taken from reference (31).


On average, the obesity rate in US adults has nearly tripled since the 1960’s (Reference (32) and Figure 2). These large increases in the number of people with obesity and severe obesity, while at the same time the level of overweight has remained steady (32,33), suggests that the “obesogenic” environment is disproportionately affecting those portions of the population with

the greatest genetic potential for weight gain (34). This currently leaves slightly less than 30% of the US adult population as having a healthy weight (BMI between 18.5 and 25 kg/m2).


Men and women now have similar rates of obesity and the peak rates of obesity for both men and women in the US occur between the ages of 40 and 60 years (Figures 2 and 3). In studies that have measured body composition, fat mass also peaks just past middle age in both men and women, but percent body fat continues to increase past this age, particularly in men

because of a proportionally greater loss in lean mass (35-37). The menopausal period has also been associated with an increase in percent body fat and propensity for central (visceral) fat distribution, even though total body weight may change very little during this time (38-41).


The rise in obesity prevalence rates has disproportionately affected US minority populations (Figure 2). The highest prevelance rates of obesity by race and ethnicity are currently reported in Black women, native americans, and Hispanics (Figure 2 and reference (42)). In general, women and men who did not go to college were more likely to have obesity than those who did, but for both groups these relationships varied depending on race and ethnicity (see below). Amongst women, obesity prevelance rates decreased with increasing income in women (from 45.2% to 29.7%), but there was no difference in obesity prevalence between the lowest (31.5%) and highest (32.6%) income groups among men (43).


Figure 3. Prevalence of obesity among adults aged 20 and over, by sex and age: United States, 2017–2018. Taken from reference (30).


The interactions of socieconomic status and obesity rates varied based on race and ethnicity (43). For example, the expected inverse relationship between obesity and income group did not hold for non-Hispanic Black men and women in whom obesity prevelance was actually higher in the highest compared to lowest income group (men) or showed no relationship to income by racial group at all (women) (43). Obesity prevalence was lower among college graduates than among persons with less education for non-Hispanic White women and men, Black women, and Hispanic women, but not for Black and Hispanic men.  Asian men and women have the lowest obesity prevelance rates, which did not vary by eduction or income level (43).


Central Obesity


As discussed above, central weight distribution occurs more commonly in men than women and increases in both men and women with age. In one of the few datasets that have published time-trends in waist circumference, it has been shown that over the past 20 years, age-adjusted waist circumferences have tracked upward in both US men and women (Figure 4). Much of this likely reflects the population increases in obesity prevelance since increasing fat mass and visceral fat track together (52).


Figure 4. Age-adjusted mean waist circumference among adults in the National Health and Nutrition Examination Survey 1999-2012. Adapted from (51).


Pediatrics


Childhood obesity is a risk factor for adulthood obesity (44-46). In this regard, the similar tripling of obesity rates in US youth (ages 2-19 years old)  (Figure 5) to 20.9% in 2018 (31) is worrisome and will contribute to the already dismal projections of the US adult population approaching 50% obesity prevelance by the year 2030 (47). Obesity prevalence was 26.2% among Hispanic children, 24.8% among non-Hispanic Black children, 16.6% among non-Hispanic White children, and 9.0% among non-Hispanic Asian children (48). Like adults, obesity rates in children are greater when they are live in households with lower incomes and less education of the head of the household (49). In this regard, these obesity gaps have been steadily widening in girls, whereas the differences between boys has been relatively stable (49).


Figure 5. Trends in obesity among children and adolescents aged 2–19 years, by age: United States, 1963–1965 through 2017–2018. Obesity is defined as body mass index (BMI) greater than or equal to the 95th percentile from the sex-specific BMI-for-age 2000 CDC Growth Charts. Taken from reference (50).


With regard to socieconomic status, the inverse trends for lower obesity rates and higher income and education (of households) held in all race and ethnic origin groups with the following exceptions:  obesity prevalence was lower in the highest income group only in Hispanic and Asian boys and did not differ by income among non-Hispanic Black girls (49).


Historically, international obesity rates have been lower than in the US, and most developing countries considered undernutrition to be their topmost health priority (53). However, international rates of overweight and obesity have been rising steadily for the past several decades and, in many countries, are now meeting or exceeding those of the US (Figure 6) (54,55). In 2016, 1.3 billion adults were overweight worldwide and, between 1975 to 2016, the number of adults with obesity increased over six-fold, from 100 million to 671 million (69 to 390 million women, 31 to 281 million men) (54). Especially worrisome have been similar trends in the youth around the world (Figure 6), from 5 million girls and 6 million boys with obesity in 1975 to 50 million girls and 74 million boys in 2016 (54), as this means the rise in obesity rates will continue for decades as they mature into adults. 


The growth in the wordwide prelance of overweight and obesity is thought to be primarily driven by economic and technological advancements in all developing societies (56,57). These forces have been ongoing in the US and other Western countries for many decards but are being experienced by many developing countries on a compressed timescale. Greater worker productivity in advancing economies means more time spent in sedentary work (less in manual labor) and less time spent in leisure activity. Greater wealth allows the purchase of televisions, cars, processed foods, and more meals eaten out of the house, all of which have been associated with greater rates of obesity in children and adults. More details and greater discussion of these issues can be found in Endotext Chapters on Non-excercise Activity Thermogenesis (58) and Obesity and the Environment (9).


Regardless of the causes, these trends in global weight gain and obesity are quickly creating a tremendous burden on health-care systems and cost to countries attempting to respond to the increased treatment demands (59). They are also feuling a rise in global morbity and mortality for chronic (non-communicable) diseases, especially for cardiovascular disease and type 2 diabetes mellitus, and especially in Asian and South Asian populations where rates of type 2 diabetes are currently exploding (15,60-63). Efforts need to be made to deliver adequate health care to those currently with obesity and, at the same time, find innovative and alternative solutions that allow economies to prosper and to incorporate technologies that will reverse current trends in obesity and obesity-related complications.


Figure 6: Trends in the number of adults, children, and adolescents with obesity and with moderate and severe underweight by region. Children and adolescents were aged 5–19 years. (Taken from (54)).


SUMMARY


Obesity is both a chronic disease in its own right and a primary contributor to other leading chronic diseases such as type 2 diabetes, dyslipidemia, hypertension, and cardiovascular diseases. In the clinic, obesity is still best defined using commonly available tools, including BMI and waist circumference; although it is hoped that newer imaging modalities allowing more precise quantification of amount and distribution of excess lipid depots will improve obesity risk assessment. The general rise in obesity taking place in the US over the past 50 years is now occurring globally. In the US, the prevalence rates of obesity in adult men and women are now similar at 40%, and minorities are disproportionately affected, including Blacks, Native Americans, and Hispanics, with obesity rates of 50% or higher. Particularly worrisome is the global increase in obesity prevalence in children and adolescents as these groups will continue to contribute to a rising adult obesity rates for several decades to come. As important as finding solutions that address the global logistical and financial challenges facing health-care systems attempting to meet current demands of obesity and weight-related co-morbidities will be finding innovative solutions that prevent and reverse current population weight gain trends.


REFERENCES


  1. Rubino F, Puhl RM, Cummings DE, Eckel RH, Ryan DH, Mechanick JI, Nadglowski J, Ramos Salas X, Schauer PR, Twenefour D, Apovian CM, Aronne LJ, Batterham RL, Berthoud HR, Boza C, Busetto L, Dicker D, De Groot M, Eisenberg D, Flint SW, Huang TT, Kaplan LM, Kirwan JP, Korner J, Kyle TK, Laferrere B, le Roux CW, McIver L, Mingrone G, Nece P, Reid TJ, Rogers AM, Rosenbaum M, Seeley RJ, Torres AJ, Dixon JB. Joint international consensus statement for ending stigma of obesity. Nature medicine. 2020;26(4):485-497.
  2. Ramasamy A, Laliberté F, Aktavoukian SA, Lejeune D, DerSarkissian M, Cavanaugh C, Smolarz BG, Ganguly R, Duh MS. Direct and Indirect Cost of Obesity Among the Privately Insured in the United States: A Focus on the Impact by Type of Industry. J Occup Environ Med. 2019;61(11):877-886.
  3. Ward ZJ, Bleich SN, Long MW, Gortmaker SL. Association of body mass index with health care expenditures in the United States by age and sex. PloS one. 2021;16(3):e0247307.
  4. Hammond RA, Levine R. The economic impact of obesity in the United States. Diabetes, metabolic syndrome and obesity : targets and therapy. 2010;3:285-295.
  5. Schwartz MW, Seeley RJ, Zeltser LM, Drewnowski A, Ravussin E, Redman LM, Leibel RL. Obesity Pathogenesis: An Endocrine Society Scientific Statement. Endocr Rev. 2017;38(4):267-296.
  6. Affinati AH, Myers MG, Jr. Neuroendocrine Control of Body Energy Homeostasis. In: Feingold KR, Anawalt B, Boyce A, Chrousos G, de Herder WW, Dhatariya K, Dungan K, Hershman JM, Hofland J, Kalra S, Kaltsas G, Koch C, Kopp P, Korbonits M, Kovacs CS, Kuohung W, Laferrere B, Levy M, McGee EA, McLachlan R, Morley JE, New M, Purnell J, Sahay R, Singer F, Sperling MA, Stratakis CA, Trence DL, Wilson DP, eds. Endotext. South Dartmouth (MA): MDText.com, Inc. Copyright © 2000-2022, MDText.com, Inc.; 2000.
  7. Farooqi IS, O'Rahilly S. The Genetics of Obesity in Humans. In: Feingold KR, Anawalt B, Boyce A, Chrousos G, de Herder WW, Dhatariya K, Dungan K, Hershman JM, Hofland J, Kalra S, Kaltsas G, Koch C, Kopp P, Korbonits M, Kovacs CS, Kuohung W, Laferrere B, Levy M, McGee EA, McLachlan R, Morley JE, New M, Purnell J, Sahay R, Singer F, Sperling MA, Stratakis CA, Trence DL, Wilson DP, eds. Endotext. South Dartmouth (MA): MDText.com, Inc. Copyright © 2000-2022, MDText.com, Inc.; 2000.
  8. Tchang BG, Aras M, Kumar RB, Aronne LJ. Pharmacologic Treatment of Overweight and Obesity in Adults. In: Feingold KR, Anawalt B, Boyce A, Chrousos G, de Herder WW, Dhatariya K, Dungan K, Hershman JM, Hofland J, Kalra S, Kaltsas G, Koch C, Kopp P, Korbonits M, Kovacs CS, Kuohung W, Laferrere B, Levy M, McGee EA, McLachlan R, Morley JE, New M, Purnell J, Sahay R, Singer F, Sperling MA, Stratakis CA, Trence DL, Wilson DP, eds. Endotext. South Dartmouth (MA)2000.
  9. Lee A, Cardel M, Donahoo WT. Social and Environmental Factors Influencing Obesity. In: Feingold KR, Anawalt B, Blackman MR, Boyce A, Chrousos G, Corpas E, de Herder WW, Dhatariya K, Dungan K, Hofland J, Kalra S, Kaltsas G, Kapoor N, Koch C, Kopp P, Korbonits M, Kovacs CS, Kuohung W, Laferrere B, Levy M, McGee EA, McLachlan R, New M, Purnell J, Sahay R, Shah AS, Singer F, Sperling MA, Stratakis CA, Trence DL, Wilson DP, eds. Endotext. South Dartmouth (MA): MDText.com, Inc. Copyright © 2000-2022, MDText.com, Inc.; 2000.
  10. Pucci A, Batterham RL. Endocrinology of the Gut and the Regulation of Body Weight and Metabolism. In: Feingold KR, Anawalt B, Boyce A, Chrousos G, de Herder WW, Dhatariya K, Dungan K, Hershman JM, Hofland J, Kalra S, Kaltsas G, Koch C, Kopp P, Korbonits M, Kovacs CS, Kuohung W, Laferrere B, Levy M, McGee EA, McLachlan R, Morley JE, New M, Purnell J, Sahay R, Singer F, Sperling MA, Stratakis CA, Trence DL, Wilson DP, eds. Endotext. South Dartmouth (MA)2000.
  11. O'Brien P. Surgical Treatment of Obesity. In: Feingold KR, Anawalt B, Boyce A, Chrousos G, de Herder WW, Dhatariya K, Dungan K, Hershman JM, Hofland J, Kalra S, Kaltsas G, Koch C, Kopp P, Korbonits M, Kovacs CS, Kuohung W, Laferrere B, Levy M, McGee EA, McLachlan R, Morley JE, New M, Purnell J, Sahay R, Singer F, Sperling MA, Stratakis CA, Trence DL, Wilson DP, eds. Endotext. South Dartmouth (MA)2000.
  12. Kim TY, Kim S, Schafer AL. Medical Management of the Postoperative Bariatric Surgery Patient. In: Feingold KR, Anawalt B, Boyce A, Chrousos G, de Herder WW, Dhatariya K, Dungan K, Hershman JM, Hofland J, Kalra S, Kaltsas G, Koch C, Kopp P, Korbonits M, Kovacs CS, Kuohung W, Laferrere B, Levy M, McGee EA, McLachlan R, Morley JE, New M, Purnell J, Sahay R, Singer F, Sperling MA, Stratakis CA, Trence DL, Wilson DP, eds. Endotext. South Dartmouth (MA)2000.
  13. Willett WC, Dietz WH, Colditz GA. Guidelines for healthy weight. N Engl J Med. 1999;341(6):427-434.
  14. Mozaffarian D, Benjamin EJ, Go AS, Arnett DK, Blaha MJ, Cushman M, Das SR, de Ferranti S, Despres JP, Fullerton HJ, Howard VJ, Huffman MD, Isasi CR, Jimenez MC, Judd SE, Kissela BM, Lichtman JH, Lisabeth LD, Liu S, Mackey RH, Magid DJ, McGuire DK, Mohler ER, 3rd, Moy CS, Muntner P, Mussolino ME, Nasir K, Neumar RW, Nichol G, Palaniappan L, Pandey DK, Reeves MJ, Rodriguez CJ, Rosamond W, Sorlie PD, Stein J, Towfighi A, Turan TN, Virani SS, Woo D, Yeh RW, Turner MB, American Heart Association Statistics C, Stroke Statistics S. Heart Disease and Stroke Statistics-2016 Update: A Report From the American Heart Association. Circulation. 2016;133(4):e38-e360.
  15. Collaborators GBDO, Afshin A, Forouzanfar MH, Reitsma MB, Sur P, Estep K, Lee A, Marczak L, Mokdad AH, Moradi-Lakeh M, Naghavi M, Salama JS, Vos T, Abate KH, Abbafati C, Ahmed MB, Al-Aly Z, Alkerwi A, Al-Raddadi R, Amare AT, Amberbir A, Amegah AK, Amini E, Amrock SM, Anjana RM, Arnlov J, Asayesh H, Banerjee A, Barac A, Baye E, Bennett DA, Beyene AS, Biadgilign S, Biryukov S, Bjertness E, Boneya DJ, Campos-Nonato I, Carrero JJ, Cecilio P, Cercy K, Ciobanu LG, Cornaby L, Damtew SA, Dandona L, Dandona R, Dharmaratne SD, Duncan BB, Eshrati B, Esteghamati A, Feigin VL, Fernandes JC, Furst T, Gebrehiwot TT, Gold A, Gona PN, Goto A, Habtewold TD, Hadush KT, Hafezi-Nejad N, Hay SI, Horino M, Islami F, Kamal R, Kasaeian A, Katikireddi SV, Kengne AP, Kesavachandran CN, Khader YS, Khang YH, Khubchandani J, Kim D, Kim YJ, Kinfu Y, Kosen S, Ku T, Defo BK, Kumar GA, Larson HJ, Leinsalu M, Liang X, Lim SS, Liu P, Lopez AD, Lozano R, Majeed A, Malekzadeh R, Malta DC, Mazidi M, McAlinden C, McGarvey ST, Mengistu DT, Mensah GA, Mensink GBM, Mezgebe HB, Mirrakhimov EM, Mueller UO, Noubiap JJ, Obermeyer CM, Ogbo FA, Owolabi MO, Patton GC, Pourmalek F, Qorbani M, Rafay A, Rai RK, Ranabhat CL, Reinig N, Safiri S, Salomon JA, Sanabria JR, Santos IS, Sartorius B, Sawhney M, Schmidhuber J, Schutte AE, Schmidt MI, Sepanlou SG, Shamsizadeh M, Sheikhbahaei S, Shin MJ, Shiri R, Shiue I, Roba HS, Silva DAS, Silverberg JI, Singh JA, Stranges S, Swaminathan S, Tabares-Seisdedos R, Tadese F, Tedla BA, Tegegne BS, Terkawi AS, Thakur JS, Tonelli M, Topor-Madry R, Tyrovolas S, Ukwaja KN, Uthman OA, Vaezghasemi M, Vasankari T, Vlassov VV, Vollset SE, Weiderpass E, Werdecker A, Wesana J, Westerman R, Yano Y, Yonemoto N, Yonga G, Zaidi Z, Zenebe ZM, Zipkin B, Murray CJL. Health Effects of Overweight and Obesity in 195 Countries over 25 Years. N Engl J Med. 2017;377(1):13-27.
  16. Schenkeveld L, Magro M, Oemrawsingh RM, Lenzen M, de Jaegere P, van Geuns RJ, Serruys PW, van Domburg RT. The influence of optimal medical treatment on the 'obesity paradox', body mass index and long-term mortality in patients treated with percutaneous coronary intervention: a prospective cohort study. BMJ Open. 2012;2(1):e000535.
  17. Jackson AS, Stanforth PR, Gagnon J, Rankinen T, Leon AS, Rao DC, Skinner JS, Bouchard C, Wilmore JH. The effect of sex, age and race on estimating percentage body fat from body mass index: The Heritage Family Study. Int J Obes Relat Metab Disord. 2002;26(6):789-796.
  18. Jackson AS, Ellis KJ, McFarlin BK, Sailors MH, Bray MS. Body mass index bias in defining obesity of diverse young adults: the Training Intervention and Genetics of Exercise Response (TIGER) study. Br J Nutr.2009;102(7):1084-1090.
  19. Najjar MF, Rowland M. Anthropometric reference data and prevalence of overweight, United States, 1976-80. Vital Health Stat 11. 1987(238):1-73.
  20. Clinical Guidelines on the Identification, Evaluation, and Treatment of Overweight and Obesity in Adults--The Evidence Report. National Institutes of Health. Obes Res. 1998;6 Suppl 2:51S-209S.
  21. WHO Expert Consultation. Appropriate body-mass index for Asian populations and its implications for policy and intervention strategies. Lancet. 2004;363(9403):157-163.
  22. S VM, Nitin K, Sambit D, Nishant R, Sanjay K. ESI Clinical Practice Guidelines for the Evaluation and Management of Obesity In India. Indian J Endocrinol Metab. 2022;26(4):295-318.
  23. Janssen I, Katzmarzyk PT, Ross R. Waist circumference and not body mass index explains obesity-related health risk. Am J Clin Nutr. 2004;79(3):379-384.
  24. Balkau B, Deanfield JE, Despres JP, Bassand JP, Fox KA, Smith SC, Jr., Barter P, Tan CE, Van Gaal L, Wittchen HU, Massien C, Haffner SM. International Day for the Evaluation of Abdominal Obesity (IDEA): a study of waist circumference, cardiovascular disease, and diabetes mellitus in 168,000 primary care patients in 63 countries. Circulation. 2007;116(17):1942-1951.
  25. Grundy SM. Metabolic syndrome scientific statement by the American Heart Association and the National Heart, Lung, and Blood Institute. Arterioscler Thromb Vasc Biol. 2005;25(11):2243-2244.
  26. Jacobson TA, Ito MK, Maki KC, Orringer CE, Bays HE, Jones PH, McKenney JM, Grundy SM, Gill EA, Wild RA, Wilson DP, Brown WV. National lipid association recommendations for patient-centered management of dyslipidemia: part 1--full report. J Clin Lipidol. 2015;9(2):129-169.
  27. Fujimoto WY, Bergstrom RW, Boyko EJ, Leonetti DL, Newell-Morris LL, Wahl PW. Susceptibility to development of central adiposity among populations. Obes Res. 1995;3 Suppl 2:179S-186S.
  28. Alberti KG, Zimmet P, Shaw J. Metabolic syndrome--a new world-wide definition. A Consensus Statement from the International Diabetes Federation. Diabetic medicine : a journal of the British Diabetic Association.2006;23(5):469-480.
  29. Waist circumference and waist–hip ratio: report of a WHO expert consultation. Geneva, Switzerland: World Health Organization; 2008:1-39.
  30. Hales C, Carroll M, Fryar C, Ogden C. Data from: Prevalence of obesity and severe obesity among adults: United States, 2017–2018. NCHS Data Brief, no 360. Hyattsville, MD: National Center for Health Statistics.2020.
  31. Ogden CL, Fryar CD, Martin CB, Freedman DS, Carroll MD, Gu Q, Hales CM. Trends in Obesity Prevalence by Race and Hispanic Origin-1999-2000 to 2017-2018. JAMA. 2020;324(12):1208-1210.
  32. Fryar CD, Carroll MD, Ogden CL. Prevalence of Overweight, Obesity, and Extreme Obesity Among Adults: United States, 1960–1962 Through 2011–2012. National Center for Health Statistics; 2014.
  33. Friedman JM. A war on obesity, not the obese. Science. 2003;299(5608):856-858.
  34. Prentice AM. Obesity--the inevitable penalty of civilisation? Br Med Bull. 1997;53(2):229-237.
  35. Mott JW, Wang J, Thornton JC, Allison DB, Heymsfield SB, Pierson RN, Jr. Relation between body fat and age in 4 ethnic groups. Am J Clin Nutr. 1999;69(5):1007-1013.
  36. Gallagher D, Ruts E, Visser M, Heshka S, Baumgartner RN, Wang J, Pierson RN, Pi-Sunyer FX, Heymsfield SB. Weight stability masks sarcopenia in elderly men and women. American journal of physiology Endocrinology and metabolism. 2000;279(2):E366-375.
  37. Hughes VA, Frontera WR, Roubenoff R, Evans WJ, Singh MA. Longitudinal changes in body composition in older men and women: role of body weight change and physical activity. Am J Clin Nutr. 2002;76(2):473-481.
  38. Ley CJ, Lees B, Stevenson JC. Sex- and menopause-associated changes in body-fat distribution. Am J Clin Nutr. 1992;55:950-954.
  39. Svendsen OL, Hassager C, Christiansen C. Age- and menopause-associated variations in body composition and fat distribution in healthy women as measured by dual-energy X-ray absorptiometry. Metabolism.1995;44(3):369-373.
  40. Panotopooulos G, Ruiz JC, Raison J, Guygrand B, Basdevant B, Basdevant A. Menopause, fat and lean distribution in obese women. Maturitas. 1996;25:11-19.
  41. Lovejoy JC, Champagne CM, de Jonge L, Xie H, Smith SR. Increased visceral fat and decreased energy expenditure during the menopausal transition. Int J Obes (Lond). 2008;32(6):949-958.
  42. Data from: Summary Health Statistics Tables: National Health Interview Survey.Table A-15. Body mass index among adults aged 18 and over, by selected characteristics: United States, 2016. National Center for Health Statistics. Deposited 2016. https://ftp.cdc.gov/pub/Health_Statistics/NCHS/NHIS/SHS/2016_SHS_Table_A-15.pdf.
  43. Ogden CL, Fakhouri TH, Carroll MD, Hales CM, Fryar CD, Li X, Freedman DS. Prevalence of Obesity Among Adults, by Household Income and Education - United States, 2011-2014. MMWR Morb Mortal Wkly Rep.2017;66(50):1369-1373.
  44. Singh AS, Mulder C, Twisk JW, van Mechelen W, Chinapaw MJ. Tracking of childhood overweight into adulthood: a systematic review of the literature. Obes Rev. 2008;9(5):474-488.
  45. Rosenbaum M. Special Considerations Relevant to Pediatric Obesity. In: Feingold KR, Anawalt B, Boyce A, Chrousos G, de Herder WW, Dhatariya K, Dungan K, Hershman JM, Hofland J, Kalra S, Kaltsas G, Koch C, Kopp P, Korbonits M, Kovacs CS, Kuohung W, Laferrere B, Levy M, McGee EA, McLachlan R, Morley JE, New M, Purnell J, Sahay R, Singer F, Sperling MA, Stratakis CA, Trence DL, Wilson DP, eds. Endotext. South Dartmouth (MA)2000.
  46. Ward ZJ, Long MW, Resch SC, Giles CM, Cradock AL, Gortmaker SL. Simulation of Growth Trajectories of Childhood Obesity into Adulthood. N Engl J Med. 2017;377(22):2145-2153.
  47. Ward ZJ, Bleich SN, Cradock AL, Barrett JL, Giles CM, Flax C, Long MW, Gortmaker SL. Projected U.S. State-Level Prevalence of Adult Obesity and Severe Obesity. N Engl J Med. 2019;381(25):2440-2450.
  48. Stierman B, Afful J, Carroll MD, Chen T-C, Davy O, Fink S, Fryar CD, Gu Q, Hales CM, Hughes JP, Ostchega Y, Storandt RJ, Akinbami LJ. National Health and Nutrition Examination Survey 2017–March 2020 Prepandemic Data Files Development of Files and Prevalence Estimates for Selected Health Outcomes. National Health Statistics Reports. Hyattsville, MD: National Center for Health Statistics2021.
  49. Ogden CL, Carroll MD, Fakhouri TH, Hales CM, Fryar CD, Li X, Freedman DS. Prevalence of Obesity Among Youths by Household Income and Education Level of Head of Household - United States 2011-2014. MMWR Morb Mortal Wkly Rep. 2018;67(6):186-189.
  50. Fryar CD, Carroll MD, Afful J. Prevalence of overweight, obesity, and severe obesity among children and adolescents aged 2–19 years: United States, 1963–1965 through 2017–2018. NCHS Health E-Stats. 2020.
  51. Ford ES, Maynard LM, Li C. Trends in mean waist circumference and abdominal obesity among US adults, 1999-2012. JAMA. 2014;312(11):1151-1153.
  52. Lemieux S, Prud'homme D, Bouchard C, Tremblay A, Despres JP. Sex differences in the relation of visceral adipose tissue accumulation to total body fatness. Am J Clin Nutr. 1993;58(4):463-467.
  53. York DA, Rossner S, Caterson I, Chen CM, James WP, Kumanyika S, Martorell R, Vorster HH, American Heart A. Prevention Conference VII: Obesity, a worldwide epidemic related to heart disease and stroke: Group I: worldwide demographics of obesity. Circulation. 2004;110(18):e463-470.
  54. NCD Risk Factor Collaboration (NCD-RisC). Worldwide trends in body-mass index, underweight, overweight, and obesity from 1975 to 2016: a pooled analysis of 2416 population-based measurement studies in 128.9 million children, adolescents, and adults. Lancet. 2017;390(10113):2627-2642.
  55. Finucane MM, Stevens GA, Cowan MJ, Danaei G, Lin JK, Paciorek CJ, Singh GM, Gutierrez HR, Lu Y, Bahalim AN, Farzadfar F, Riley LM, Ezzati M, Global Burden of Metabolic Risk Factors of Chronic Diseases Collaborating G. National, regional, and global trends in body-mass index since 1980: systematic analysis of health examination surveys and epidemiological studies with 960 country-years and 9.1 million participants. Lancet.2011;377(9765):557-567.
  56. Popkin BM, Horton S, Kim S, Mahal A, Shuigao J. Trends in diet, nutritional status, and diet-related noncommunicable diseases in China and India: the economic costs of the nutrition transition. Nutr Rev.2001;59(12):379-390.
  57. Levine JA, Kotz CM. NEAT--non-exercise activity thermogenesis--egocentric & geocentric environmental factors vs. biological regulation. Acta Physiol Scand. 2005;184(4):309-318.
  58. von Loeffelholz C, Birkenfeld AL. Non-Exercise Activity Thermogenesis in Human Energy Homeostasis. In: Feingold KR, Anawalt B, Boyce A, Chrousos G, de Herder WW, Dhatariya K, Dungan K, Hershman JM, Hofland J, Kalra S, Kaltsas G, Koch C, Kopp P, Korbonits M, Kovacs CS, Kuohung W, Laferrere B, Levy M, McGee EA, McLachlan R, Morley JE, New M, Purnell J, Sahay R, Singer F, Sperling MA, Stratakis CA, Trence DL, Wilson DP, eds. Endotext. South Dartmouth (MA)2000.
  59. Withrow D, Alter DA. The economic burden of obesity worldwide: a systematic review of the direct costs of obesity. Obes Rev. 2011;12(2):131-141.
  60. Bragg F, Tang K, Guo Y, Iona A, Du H, Holmes MV, Bian Z, Kartsonaki C, Chen Y, Yang L, Sun Q, Dong C, Chen J, Collins R, Peto R, Li L, Chen Z, China Kadoorie Biobank Collaborative G. Associations of General and Central Adiposity With Incident Diabetes in Chinese Men and Women. Diabetes Care. 2018;41(3):494-502.
  61. Global BMIMC, Di Angelantonio E, Bhupathiraju Sh N, Wormser D, Gao P, Kaptoge S, Berrington de Gonzalez A, Cairns BJ, Huxley R, Jackson Ch L, Joshy G, Lewington S, Manson JE, Murphy N, Patel AV, Samet JM, Woodward M, Zheng W, Zhou M, Bansal N, Barricarte A, Carter B, Cerhan JR, Smith GD, Fang X, Franco OH, Green J, Halsey J, Hildebrand JS, Jung KJ, Korda RJ, McLerran DF, Moore SC, O'Keeffe LM, Paige E, Ramond A, Reeves GK, Rolland B, Sacerdote C, Sattar N, Sofianopoulou E, Stevens J, Thun M, Ueshima H, Yang L, Yun YD, Willeit P, Banks E, Beral V, Chen Z, Gapstur SM, Gunter MJ, Hartge P, Jee SH, Lam TH, Peto R, Potter JD, Willett WC, Thompson SG, Danesh J, Hu FB. Body-mass index and all-cause mortality: individual-participant-data meta-analysis of 239 prospective studies in four continents. Lancet. 2016;388(10046):776-786.
  62. Ogurtsova K, da Rocha Fernandes JD, Huang Y, Linnenkamp U, Guariguata L, Cho NH, Cavan D, Shaw JE, Makaroff LE. IDF Diabetes Atlas: Global estimates for the prevalence of diabetes for 2015 and 2040. Diabetes Res Clin Pract. 2017;128:40-50.
  63. Wang Y, Zhao L, Gao L, Pan A, Xue H. Health policy and public health implications of obesity in China. The lancet Diabetes & endocrinology. 2021;9(7):446-461.

Non-Invasive Techniques In Pediatric Dyslipidemia

ABSTRACT


Symptomatic and overt atherosclerosis in children is rare. The earliest lesion of atherosclerosis develops in childhood, but may not correlate with traditional markers of atherosclerosis. Children are considered low risk populations for atherosclerosis. The use of non-invasive imaging can have a role to identify early subclinical vascular changes. Imaging techniques are becoming useful adjuncts in conjunction with traditional lipid markers. These techniques have been extensively used in children and have provided indirect evidence for premature atherosclerosis, risk stratification, treatment effectiveness, and longitudinal tracking of adult cardiovascular risk. Use of imaging may be a useful adjunct in combination with traditional cardiovascular risk factors to assess dyslipidemia in children.


INTRODUCTION


Medical imaging is an important modality used to create visual representation of the body for clinical analysis and interventions. The use of imaging in children can play an important role identifying subclinical disease of dyslipidemia. Identification can be clinically useful for risk stratification and treatment intervention.  The use of imaging in children was previously reserved for research but with improved methodologies have been shown to be a prospective clinical tool for children with dyslipidemia. The combination of imaging and traditional risk assessment has improved our knowledge of the natural history of atherosclerosis in children and adolescents.    


Symptomatic atherosclerosis rarely occurs in children with the exception of children with homozygous familial hypercholesterolemia. Vascular progression in children with atherosclerosis is usually minor and clinically asymptomatic.  Longitudinal studies have demonstrated that the atherosclerosis process can be accelerated in individuals with multiple risk factors or high-risk conditions. Early identification would allow for early intervention to delay the natural process of atherosclerosis.     


Multiple non-invasive imaging modalities have been used in children for the assessment of subclinical vascular changes, such as vessel endothelium thickening (cIMT), mechanical changes (pulse wave velocity), physiological changes (flow-mediated dilation), and arterial structure changes (CT and MRI). Non-invasive techniques do not require radiation exposure and is preferred over imaging techniques that utilize radiation. 


Table 1. Imaging Modalities to Assess for Subclinical Atherosclerosis

Technique

Abbreviation

Principle

Invasive

Radiation

Carotid intimal & medial thickness

cIMT

Arterial wall thickness

No

No

Pulse-waved velocity

Pulse-wave analysis

PWV


PWA


Stiffness in arteries

No

No

Flow mediated dilation

FMD

Endothelial function

No

No

Echocardiogram

ECHO

Anatomical changes

No

No

Ultrasound

U/S

Velocity, Size

No

No

Coronary artery calcification

CAC

Plaque composition

No

Yes

Computed Tomography

CT

Stenosis, composition

No

Yes

Magnetic Resonance Imaging

MRI

Stenosis, composition

No

No

Coronary Angiography

CA

Stenosis

Yes

Yes


The use of non-invasive methods has improved our knowledge and ability to risk stratify children and track longitudinal vascular changes into adulthood. It has been established that children that enter adulthood with multiple risk factors will have premature progression of atherosclerosis as a young adults and adults. The i3C meta-analysis demonstrated the number of abnormal childhood CV risk factors was predictive of elevated adult cIMT measurements.


SUBCLINICAL ATHEROSCLEROSIS IN CHILDREN


Autopsy studies have demonstrated that atherosclerosis substrate begins in childhood (1).  The initial process is microscopic lesions and transitions to macroscopic changes particularly in places that are prone to the development of atherosclerosis. Areas are predisposed to atherosclerosis include arterial bifurcation sites in the common carotid, coronaries, and abdominal aorta. The accumulation of lipid substrate is deposited in the intima of arteries and forms the fatty streak. These early lesions are generally non-occlusive lesions.  The Bogalusa heart study demonstrated the prevalence of fatty streak in coronary arteries in children 2-15 years of age with 50% of surface vessel involvement (2).  The degree of progression increased with greater number of risk factors in the Pathological Determinants of Atherosclerosis in Youth (PDAY) study (3).   


Subclinical atherosclerotic changes in children can manifest as dysfunctional arterial vasodilation, alterations of arterial elasticity (compliance and distensibility), and thickening of arterial walls.  


The arterial wall consists of three layers (figure 1). The tunica externa or tunica adventitia (outermost layer) is composed of connective tissue and collagen. The tunica media (middle layer) is made up of smooth muscle cells and elastic tissues. The pediatric arterial vessel is composed of more elastin than collagen. The tunica intima (innermost layer) consists of endothelial cells. The endothelium is a single cell layer lining the vascular lumen and has an important role in maintaining vascular integrity.  


Figure 1. Components of the endothelial arterial wall. (Reprinted): Reference 38.

Atherosclerosis is characterized by the formation of lipid substrates, calcium, and other substances in the arterial wall that results in arterial wall thickening and progression to arterial plaques (figure 2). The pathological substrate for vascular dysfunction is mediated by endothelial dysfunction. Endothelial changes are a complex mechanism, but is composed of oxidative stress, loss of vasoactive substrates, inflammatory substances, and prothrombotic state. This cluster of harmful stimuli accelerates and compounds the mechanism of endothelial dysfunction. This process is the underlying mechanism of clinical myocardial infarctions and stroke.  


Figure 2. Arterial progression model of atherosclerosis. Earliest substrate manifest as “fatty streak” in children. Further progression is accelerated by additional cardiac risk factors.


The substrate of atherosclerosis develops in childhood as the fatty streak. Development of the fatty streak can be evident by 3 years of age. Premature progression can be accelerated by additional risk factors.


Our understanding of the atherosclerotic natural process in children is based on imaging studies in individuals with autosomal dominant Familial Hypercholesterolemia (FH).  Familial hypercholesterolemia is a disease of increased LDL cholesterol plasma concentrations that accumulates in the arterial vessel wall. This process has been accelerated in children with homozygous FH.  Children with homozygous FH manifest as early endothelial dysfunction and have been observed to have increased carotid intimal-media thickness. Carotid intimal thickness has been used as a surrogate end-point marker with statin intervention in children with FH.


RISK FACTORS FOR PREMATURE ATHEROSCLEROSIS


The prevalence of obesity in children has stabilized over the recent years. However, the rate of morbid obesity continues to increase (4). Obesity is associated with an increased metabolic demand. Arterial stiffness is impacted by increased blood volume (preload) and alterations of afterload.  Previous studies have demonstrated a linear relationship between obesity in childhood and increased cIMT in young adults (5).  Indirect measure of subclinical atherosclerosis measured by cIMT and FMD have been observed in obese adolescents and young adults (6). Individuals with the largest increase in BMI during childhood and adolescents that remained obese had greatest changes in cIMT (7).  


Chronic elevated blood pressure has an important role in vascular changes. Elevated blood pressure is a complex relationship that is affected by several factors including the sympathetic nervous system, renin-angiotensin-aldosterone system, and stimulation of vascular smooth muscle proliferation.  Children with hypertension have evidence of left ventricular hypertrophy (LVH), increased LV mass, carotid intima-medial thickening (CIMT), and vascular endothelial dysfunction. Increased LV mass is a prominent imaging marker for clinical evidence of target-organ damage (8). A left ventricular mass index above 51 g/m2.7 has been associated with a greater risk of adverse cardiovascular outcome (9).  


The combination of insulin resistance and hyperglycemia are linked with endothelial dysfunction and mediators of inflammation. Children with diabetes compared with those without diabetes are at increased risk for other atherogenic factors, such as hypertension and dyslipidemia. Mixed dyslipidemia pattern is characterized by high Apo-B (increased small dense LDL particles and cholesterol ester rich VLDL remnants) and low Apo-A (low HDL particles) (11). The TG/HDL-c ratio is a surrogate atherogenic index of mixed dyslipidemia.  TG/HDL-c ratio was shown to be an independent determinant of arterial stiffness in obese adolescents using brachial artery distensibility (BrachD) and carotid-femoral pulse wave velocity (PWV) (10).


Metabolic syndrome (MS) has been established as a cluster of CV risk factors including hypertension, overweight/obesity, dyslipidemia (high triglycerides, low HDL), and insulin resistance.  However, the relationship between childhood metabolic syndrome and CVD events are not well characterized and there has been no consensus in the pediatric population (11). The components of MS are considered independent risk factors associated with vascular dysfunction (12).       


NON-INVASIVE IMAGING TECHNIQUES


Carotid Intima-Media Thickness (CIMT)


The use of cIMT technique is a useful surrogate technique to assess vessel intimal thickness in children with dyslipidemia. Subclinical changes in children are manifested as diffuse thickening of the intima-media space rather than a discrete lipid core or an advance lipid lesion.   


The imaging method utilizes high resolution B-mode 2-dimensional (2D) ultrasonography with a high-frequency (7 to 12-MHz) linear array transducer for assessment of carotid intimal and medial vessel. Imaging measurements are traditionally conducted on the common carotid artery at the far-wall of the vessel. Changes to the intimal-medial thickness in the far-wall have correlated with direct histological examination.  Most pediatric studies have focused on assessment of the carotid artery far wall. The distance between the leading edge of the first echo-bright line (lumen-intima interface) and the leading edge of the second echo-bright line (media-adventitia interface) is defined as the carotid intimal-media interface (figure 3) (13). An abnormal cIMT is a thickened sub-intimal layer due to atherogenic particle deposition and inflammatory process.


Figure 3. Carotid endothelial structures by B-mode ultrasound.


Imaging acquisition is obtained with 2D grayscale imaging along the longitudinal axis of the artery.  Measurement values should be recorded at end diastole and calculated by mean IMT measurement.  Reproducibility of the fall-wall in the carotid artery has been validated and reproducible in previous pediatric studies.


Several studies have demonstrated indirect evidence for early development of atherosclerosis in children. Increased cIMT has been demonstrated in pediatric patients with familial hypercholesterolemia (FH), hypertension, obesity, diabetes, and metabolic syndrome (14,15,16, 17,18). The use of cIMT has been used to evaluate cardiovascular risk in pediatric populations with high-risk conditions and chronic medical conditions, such as juvenile rheumatoid arthritis, end-stage renal disease, and Kawasaki disease (19,20,21).


The use of cIMT has been utilized to show treatment effectiveness of statins in children with familial hypercholesterolemia. In a study of 214 children with heterozygous FH who were 8-18 years of age, were randomly assigned to the pravastatin treated group and compared with the placebo group. After 2 years of treatment with a statin, cIMT showed significant regression in the pravastatin group. Longitudinal follow-up of 186 children with early initiation of statin in children with FH after 4.5 years delayed the progression of cIMT changes. Data indicated that early treatment with a statin delayed the progression of atherosclerosis in adolescents and young adults (22). The CHARON study assessed the effect of 2-year treatment with rosuvastatin on cIMT in children with HeFH. The result of the study showed a significant reduction in the progression of atherosclerosis, as assessed by cIMT in children with HeFH compared with untreated, unaffected siblings (23).


Numerous longitudinal studies have demonstrated the association between CV risk factors developed in childhood and premature atherosclerotic changes into adulthood. In the Bogalusa study, childhood measurements of LDL-C levels and BMI positively predicted increased cIMT in a cohort of 486 adults aged 25-37 years (24).  The Muscatine study demonstrated childhood total cholesterol levels and BMI predicted cIMT changes in a cohort of 725 adults (25). In a meta-analysis of i3C study (International Childhood Cardiovascular Cohort Consortium), a combined analysis of prospective studies showed the number of abnormal childhood CV risk factors (i.e., cholesterol, triglycerides, blood pressure, BMI) were longitudinally predictive of adult cIMT. This process was the greatest in children with risk factors developed at 9 years of age or greater (26).


Arterial Stiffness


There are several indices of arterial stiffness measurements. Functional measurement such as pulse wave velocity (PWV), pulse wave analysis (PWA), ambulatory arterial stiffness index (24-hour ambulatory blood pressure monitoring), and assessment of endothelial dysfunction (flow-mediated dilation).


Stiffer arterial vessels require greater force to expand and accommodate flow to perfuse tissues and organs. Arterial distensibility and compliance changes are a complex mechanism of hemodynamic factors, extrinsic factors and intraluminal influences.  


Pulse wave velocity measures the speed of the pressure pulse from the heart as it circulates through the blood vessels. Measurement of the pulse wave (indicator of blood flow) to travel a given distance between 2 sites (carotid to femoral) in the arterial system is measured and recorded (figure 4). A faster PWV is an indicatory of stiffer arterial vessel. PWA is an indirect measure of arterial stiffness that analyzes arterial waveform reflections. PWA is a supplement to PWV analysis. Augmentation index is a parameter derived from systolic peak differences. Risk factors associated with higher PWV include BMI, blood pressure, heart rate, dyslipidemia (27).


Figure 4. Tonometric pulse wave velocity. The arterial time difference between two sites is calculated as the PWV.


Arterial stiffness is associated with traditional CV risk factors and metabolic alterations including obesity, impaired glucose tolerance, and dyslipidemia. Risk stratification using triglyceride to high-density lipoprotein cholesterol ratio (TG/HDL-C) was tested as an independent predictor of arterial stiffness in obese children. The cohort of 893 subjects aged 10 to 26 years old that demonstrated higher TG/HDL-C ratio had the stiffest vessels measured by brachial artery distensibility (BrachD), augmentation index, and carotid-femoral pulse-wave velocity (28). In young individuals with T1DM with poor glycemic control, higher levels of traditional CV risk factors were independently associated with accelerated arterial aging using PWV and augmentation index (29).


Flow-mediated dilation (FMD) is a technique used to assess peripheral macrovascular endothelial function. Endothelial dysfunction is characterized by a complex imbalance of proatherogenic factors such as vasoconstriction, platelet alterations, cellular dysfunction, and inflammation. Endothelial changes are an early reversible stage in the progression of atherosclerosis.


The technique measures the nitric oxide-mediated vasodilation produced by increased blood flow after a period of ischemia (Reactive hyperemia). The method requires inflating upper extremity blood pressure at suprasystolic pressures for a short period of time that occludes blood flow. After a period of time, the occlusion is released and functional increased shear stress is generated as signal amplitude.  Both diameter and blood velocity are assessed before and after occlusion with results being reported as a percent change from baseline. A lower index measurement indicated poor endothelial function. A lower artery reactivity has been identified in children with obesity, family history of premature coronary disease and type I DM (30, 31, 32).  A study of 50 children (aged 9 to 18 years) with FH were randomized to simvastatin or placebo for 28 weeks. A control group of 19 non-FH children were matched. Baseline FMD was impaired in the children with FH compared to non-FH group. After treatment there was a significant improvement of endothelial dysfunction towards normal values after short term statin therapy (33).


Echocardiography


Traditionally transthoracic echocardiography is an image modality that utilizes an ultrasound beam to acquire anatomical images through m-mode imaging and 2D imaging. The use of echocardiogram can be useful to assess subclinical changes of epicardial fat mass, valvular changes, and aortic vessel stenosis. 


Subclinical adipose changes to epicardial thickness may have a role in the development of cardiovascular disease.  Studies in children with greater epicardial adipose tissue is associated with larger left ventricular mass, higher blood pressures, and atherogenic lipid profiles (34) Epicardial fat thickness can be visualized using standard parasternal long-axis and short-axis imaging planes of the right ventricle (figure 5). The epicardial fat is the echo-free space between the outer wall of the myocardium and visceral layer of the pericardium. The thickness is measured perpendicularly on the free wall of the right ventricle at end-systole. Echocardiographic measurement might serve as a simple tool for the assessment of cardio-metabolic risk stratification (35).


Figure 5. Epicardial fat thickness by 2D echocardiogram in modified parasternal view. (Dashed lines represent epicardial fat structure).


A cohort of 33 young patients with homozygous FH were found to have subclinical FH valvulopathy present in 64% of patients (36). Most commonly on the aortic valve and mitral valve. The majority of the patients with valvular changes did not have valvular calcification. Isolated case studies in homozygous FH individuals have presented with heart failure and new systolic murmurs. Echocardiogram is useful in demonstrating supravalvular aortic stenosis due to endothelial dysfunction.  Some cases required surgical aortic root replacement (37). Stenosis occurred despite patients receiving aggressive statin treatment and apheresis.  


Advance Imaging Modalities


Advance imaging modalities such as cardiac magnetic resonance imaging (C-MRI) and computed tomography (CT) imaging are useful methods in understanding anatomical changes and tissue characterization.  Clinical decision to utilize CT or MRI in pediatrics is debated on the risk of radiation exposure (CT imaging) and the imaging resolution limitations of each modality. The use of CT or MRI is generally not a useful tool to assess subclinical changes in the pediatric population with dyslipidemia. MRI has demonstrated abdominal aorta atheroma formation in adolescents with severe dyslipidemia (38). The use of MRI is being considered as potential research technique for assessment of subclinical abdominal aortic wall changes.    


Coronary artery calcification with electron-beam computed tomography (CT) is used to assess the presence and extent of calcified plaque in the coronary arteries that is associated with atherosclerosis. The coronary artery calcium (CAC) score is a helpful prognostic tool and used as a method to assess risk classification for adult atherosclerosis cardiovascular disease (ASCVD). The use of CAD is not recommended as a subclinical technique since the development of calcification generally does not occur until the fourth decades of life. CAC has been utilized in a study of children with familial hypercholesterolemia (39). The use of CAC technique has been limited in pediatrics.


Myocardial perfusion imaging is reserved for adults with advanced cardiovascular risk and disease. The use of perfusion imaging in children is not recommended. Myocardial perfusion is helpful in children with Kawasaki (40) and congenital heart defects with coronary artery manipulation.    


Invasive coronary angiography is the “gold standard” and direct assessment of coronary arterial stenosis. Utilization of angiography should be reserved to children with presumed advance atherosclerosis, such as homozygous FH or rare genetic dyslipidemia. Angiography technique is not a useful modality for subclinical evaluation in children.


Ultrasound Imaging


The use of sound waves is a useful non-invasive imaging modality in the evaluation of pediatric subclinical atherosclerosis. Ultrasound can contribute to early detection of renal artery changes and risk stratification attributed to atherosclerosis. Early atherosclerosis stress and inflammation affect the proximal renal arteries causing increased velocity shear stress and longitudinal narrowing. Long term pathological changes develop into atherosclerotic renal artery stenosis (ARAS) in the adult population. Arterial vascular changes are characterized by increased systolic blood pressure an indicator of preclinical atherosclerosis in children.


Renal size (length) is a marker of kidney mass and renal function. Carotid-IMT has been shown to be a surrogate maker for renal function. Ultrasound parameters in 515 prepubertal children (lean, overweight, obese) demonstrated renal size and associated carotid-IMT and systolic BP may play a role in the assessment of renal vascular function and early assessment of cardiovascular risk in children (41).  


SUMMARY


Utilizing imaging techniques in children with dyslipidemia has been extensively used and a valuable tool in our understanding of atherosclerosis process in children. Imaging has been shown to be safe, reliable, and reproducible. With further developments and research, imaging may provide a useful practical tool in the general evaluation of children with dyslipidemia. In combination with family history, traditional CV risk factors, and biochemical markers the use of imaging techniques will refine our clinical awareness for better cardiovascular health metrics and promotion of ideal cardiovascular health in children.  


REFERENCES


  1. McGill HC Jr, McMahan CA, Zieske AW, Sloop GD, Walcott JV, Troxclair DA, Malcom GT, Tracy RE, Oalmann MC, Strong JP. Associations of coronary heart disease risk factors with the intermediate lesion of atherosclerosis in youth. The Pathobiological Determinants of Atherosclerosis in Youth (PDAY) Research Group. Arterioscler Thromb Vasc Bio. 2000;20(8):1998.
  2. Li S, Chen W, Srinivasan SR, Bond MG, Tang R, Urbina EM, Berenson GS. Childhood cardiovascular risk factors and carotid changes in adulthood: the Bogalusa Heart Study. JAMA, 2003;290 (17):2271.
  3. McGill HC Jr, McMahan CA. Determinants of atherosclerosis in the young. Pathobiological Determinants of Atherosclerosis in Youth (PDAY) Research Group. Am J Cardiol. 1998;82(10B):30T.
  4. Kelly AS, Barlow SE, Rao G, et al. Severe obesity in children and adolescents: Identification, associated health risks, and treatment approaches: A scientific statement from the American Heart Association. Circulation. 2013:128: 00-00.
  5. Davis, PH, Dawson JD, Riley WA, Lauer RM. Carotid intimal-medial thickness is related to cardiovascular risk factors measured from childhood through middle age: The Muscatine Study. Circulation. 2001;104(23):2815.
  6. Ryder JR, Dengel DR, Jacobs DR Jr, Sinaiko AR, Kelly AS, Steinberger J. Relations among adiposity and insulin resistance with flow-mediated dilation, carotid intima-media thickness and arterial stiffness in children. J Pediatr. 2016 Jan;168-:205-11.
  7. Dawson JD, Sonka M, Blecha MB, Lin W, Davis PH. Risk factors associated with aortic and carotid intima-media thickness in adolescents and young adults: the Muscatine Offspring Study. J AM Coll Cardiol. 2009;53(24):2273.
  8. Armstrong AC, Gidding S, Gjesdal O, Wu C, Bluemke DA, Lima JA. LV mass assessed by echocardiography and CMR, cardiovascular outcomes and medical practice. JACC Cardiovasc Imaging. 2012:5(8);837-848
  9. Lang RM, Bandano LP, Mor-Avi V, et al. Recommendations for cardiac chamber quantification by echocardiography in adults: an update from the American Society of Echocardiography and the European Association of Cardiovascular Imaging. J AM Soc Echocardiogr. 2015;28(1):1-39.e14
  10. Urbina EM, Khoury PR, McCoy CE, Dollan LM, Daniels S, Kimball TR. Triglyceride to HDL-C ratio and increased arterial stiffness in children, adolescents, and young adults. Pediatrics. 2013:121(4): 1-7.
  11. Steinberger J, Daniels SR, Eckel RH, Hayman L, Lustig RH, McCrindle B, Mietus-Synder ML. Progress and Challenges in metabolic syndrome in children and adolescents: a scientific statement from the American Heart Association Atherosclerosis, Hypertension and Obesity in the Young Committee of the Council on Cardiovascular Disease in the Young; Council on Cardiovascular Nursing; and Council on Nutrition, Physical Activity and Metabolism. Circulation. 2009;119(4):628.
  12. Morrison JA, Friedman LA, Gray-McGuire C. Metabolic syndrome in children predicts adult cardiovascular disease 25 years later: the Princeton Lipid Research Clinics follow-up Study. Pediatrics. 2007;120(2):340.
  13. Stein JH, Korcarz CE, Hurst RT. Use of carotid ultrasound to identify subclinical vascular disease and evaluate cardiovascular disease risk: a consensus statement from the American Society of Echocardiography Carotid Intima-Media Thickness Task Force. Endorsed by the Society for Vascular. Journal of the American Society of Echocardiography. 2008:21(2): 93-111. 
  14. Kusters DM, Weigman A, Kastelein JP, Hutten BA. Carotid intima-media thickness in children with familial hypercholesterolemia. Circulation Research. 2014;114:307-310.
  15. Lande MB, Carson NL, Roy J, Meagher C. Effects of childhood primary hypertension on carotid intima media thickness. Hypertension. 2006;48:40-44.
  16. Weberru H, Pirzer R, Bohm B, Pozza RD, Netz H, Oberhoffer R. Intima-media thickness and arterial function in obse and non-obese children. BMC Obesity. 2016;2.
  17. Rad MP, Farrokh D, Vakili R, Omidbakhsh M, Mohammadi M. The association between carotid intima-media thickness and the duration of Type 1 diabetes in children. Iran J Pediatri. 2014;24(3):249-254.
  18. Gooty V, Sinaiko A, Ryder J, Dengel D, Jacobs D, Steinberger J. Association between carotid intima media thickness, age, and cardiovascular risk factors in children and adolescents. Metab Syndr Relat Disorder. 2018;16(3):122-126.
  19. Borh AH, Fuhlbrigge R. Pedersen FK, Ferranti SD, Muller K. Premature subclinical atherosclerosis in children and young adults with juvenile idiopathic arthritis. A review considering preventive measures. Pediatric Rheumatology. 2016;14;3.
  20. Val ML et al. Cardiovascular risk in children and adolescents with end stage renal disease. Clinics. 2019:74:e859.
  21. Meena RS, Rohit M, Gupta A, Singh S. Carotid intima-media thickness in children with Kawasaki disease. Rheumatol Int. 2014;34(8):1117-21
  22. Rodenburg J, Vissers MN, Wiegman A, Trotsenburg AS, Van der Graff A, De Groot E, Wijburg FA, Kastelein JP, Hutten B. Statin treatment in children with familial hypercholesterolemia. Circulation. 2007;116:664-668.
  23. Braamskamp M, et al. Effect of rosuvastatin on carotid intima-media thickness in children with heterozygous familial hypercholesterolemia: the CHARON study (Hypercholesterolemia in children and adolescents taking rosuvastatin open label). Circulation. 2017;136(4):359-366.
  24. Li S, Chen W, Srinivasan SR, Bond MG, Tang R, Urbina EM, Berenson GS. Childhood cardiovascular risk factors and carotid vascular changes in adulthood: the Bogalusa Heart Study. JAMA. 2003;290(17)2271.
  25. Davis PH, Dawson JD, Riely WA, Lauer RM. Carotid intimal-medial thickness is related to cardiovascular risk factors measured from childhood through middle age: the Muscatine study. Circulation. 2001(23):2815.
  26. Juonala M, Magnussen CG, Venn A, Dwyer T, Burns TL, Davis PH, Chen W, Srinivasan SR, Daniels SR, Kahonen M, Laitinen T, Taittonen L, Berenson GS, Viikari JS, Raitakari OT. Influence of age on associations between childhood risk factors and carotid intima-media thickness in adulthood:the cardiovascular risk in the young finns study, the childhood determinants of adult health study, the Bogalusa heart study, and the muscatine study for the international childhood cardiovascular cohort (i3C) consortium. Circulation. 2010;122(24):2514.
  27. Urbina EM, et al. Noninvasive assessment of subclinical atherosclerosis in children and adolescents: recommendations for standard assessment for clinical research: a scientific statement from the American heart association. Hypertension. 2009;54:919-950.
  28. Urbina EM, Khoury PR, McCoy CE, Dollan LM, Daniels S, Kimball TR. Triglyceride to HDL-C ratio and increased arterial stiffness in children, adolescents, and young adults. Pediatrics. 2013;121(4):1-7.
  29. Urbina EM, et al. Burden of cardiovascular risk factors over time and arterial stiffness in youth with type 1 diabetes mellitus: the SEARCH for diabetes in youth study. J Am Heart Assoc. 2019;8
  30. Bruyndonckx L, Hoymans V, Craenenbroeck A, Vissers, D, Vrints C, Ramet J, Conraads V. Asessment of endothelial dysfunction in childhood obesity and clinical use. Oxid Med Cell Longev. 2013.
  31. Clarkson P, Celermajer DS, Powe AJ, Donald AE, Henry AE, Deanfield JE. Endothelium-dependent dilatation is impaired in young healthy subjects with a family history of premature coronary disease. Circulation. 1997:96:3378-3383.
  32. Nascimento AM, Sequeira IJ, Vasconcelos DF, Gandolfi L, Pratesi R, Nobrega YK. Endothelial dysfunction in children with type 1 diabetes mellitus. Arch Endocrinol Metab. 2017:61:2359-4295.
  33. Jongh SD, Lilien MR, Roodt JO, Stroes ES, Dakker HD, Kastelein JJ. Early statin therapy restores endothelial function in children with familial hypercholesterolemia. JACC. 2002;(40):2117-21.
  34. Manco M, Morandi A, Marigliano M, Rigotti F, Manfredi R, Maffeis C. Epicardial fat, abdominal adiposity and insulin resistance in obese pre-pubertal and early pubertal children. Atherosclerosis. 2013:226: 490-495.
  35. Lacobellis G, Willens H. Echocardiographic Epicardial Fat: A review of research and clinical applications. State of the art review article. J Am Soc Echocardiogr. 2009:22: 1311-9.
  36. Fahed AC, Shibbani K, Andary RR, Arabi MT, Habib RH, Nguyen DD, Haddad FF, Moubarak E, Nemer G, Azar S, Bitar FF. Premature valvular heart disease in homozygous familial hypercholesterolemia. Cholesterol. 2017.
  37. Prajapati R, Agrawal V. Familial hypercholesterolemia supravalvular aortic stenosis and extensive atherosclerosis. Indian Heart J. 2018;(70):575-577.
  38. Skilton MR, Celermajer DS, Cosmi E, Crispi F, Gidding SS, Raitakari OT, Urbina EM. Natural history of atherosclerosis and abdominal aortic intima-media thickness: rationale, evidence, and best practice for detection of atherosclerosis in the young. J Clin Med. 2019;(8):1201.
  39. Gidding SS, Bookstein LC, Chomka EV. Usefulness of electron beam tomography in adolescents and young adults with heterozygous familial hypercholesterolemia. Circulation. 1998;(98):2580-2583.
  40. Kashyap R, Mittal BR, Bhattachary A, Manojkumar R, Singh S. Exercise myocardial perfusion imaging to evaluate inducible ischemia in children with Kawasaki disease. Nucl Med Commun. 2011;(2):137-42.
  41. Lizarraga-Mollinedo E, Martinez-Calcerrada JM,Padros-Fornieles C, Riera-Perez E, Prats-Puig A,de Zegher F, Ibanez L, Bassols J, Lopez-Bermejo A. Renal size and cardiovascular risk in prepuberal children. Sci Rep.2019;9(1):5265


Secondary Hypertriglyceridemia

ABSTRACT


Hypertriglyceridemia (HTG) is often secondary to obesity-related insulin resistance (1,2), which is caused by excessive intake of fats and carbohydrates without compensatory utilization of these calories, but other common and rare causes should be considered (3,4,5). Genetic influences, gestational conditions, and nutrition in infancy and childhood contribute to HTG associated with formation of an atherogenic dyslipidemia profile consisting of high TG, low high-density lipoprotein-cholesterol (HDL-C), increased LDL particle number, smaller LDL size and density, and elevated apolipoprotein B. Very high TG levels generally result from defective disposal by lipoprotein lipase and can cause pancreatitis. Defining and treating the underlying cause are necessary to restore the lipids and lipoproteins to normal. Renal, hepatic, endocrine, immune, and pharmacological causes are in the differential diagnosis. Rare diseases such as lipodystrophy and glycogen storage disease are particularly challenging and require specific management strategies. Prevention of acute pancreatitis by lowering TG is a priority when TG is very high (> 1000 mg/dl), and lifestyle modification is the basis of management for all cases with high and moderately high levels. Since TG metabolism is associated with generation of an atherogenic dyslipidemia profile, predictors of coronary artery disease (CAD) such as LDL-C and non-HDL-C become targets when they exceed cut points.


INTRODUCTION


This chapter is an overview of causes of hypertriglyceridemia (HTG) that begin during gestation and present in childhood and adolescence, either interacting with genetic background or directly contributing to the TG levels. These disorders are common, such as obesity, or less common such as glycogen storage disease and lipodystrophy for which treatment can be more challenging. Also, both common and unique pharmaceutical agents need to be considered as causes since treatment modification can contribute to reversing the HTG. Dyslipidemia presenting in adolescence is often associated with one or more components of the metabolic syndrome, i.e., obesity, hypertension, and impaired glucose tolerance, and presents with high TG and low HDL-C (6,7,8, 9,10) however, a wide variety of other causes can contribute to the differential diagnosis of HTG. Genetic background, gestational factors, nutrition during infancy and childhood, demographic, and environmental factors are important considerations. Also, understanding how TG is distributed among lipoproteins and how it influences lipoprotein composition and subsequent lipolysis, uptake by receptors and the arterial wall provides important background for understanding associations with specific diagnoses and when treatment can be effective.


DIET


Although the Cardiovascular Health Integrated Lifestyle Diet (CHILD 1) (11) recommends a balanced diet of carbohydrates (50%), which includes fiber, fat (30%) of which no more than 10% of total calories come from saturated fats, and protein (20%), these guidelines are often not well adhered to. Nutritional intake by many individuals comprises additional consumption of nonessential calories consisting of fats, both saturated and trans fats, as well as carbohydrates such as High-Energy Fructose Corn Syrup (HFCS) and sucrose. This coupled with a decrease in physical activity and increased time spent in leisure activities (i.e., screen time) leads to excessive weight gain, often starting at a young age, metabolic syndrome, and insulin resistance. In an active pediatric preventive cardiology program, the number of children referred because of secondary hypertriglyceridemia and obesity is approximately twice that of children referred for Familial Hypercholesterolemia (12). As excessive consumption of fat and sugar will result in increased levels of triglycerides, it is important to understand both these metabolic pathways and nutritional management is the first step in any treatment algorithm (13).


Because of the 2011 NHLBI recommendations for universal screening between 9 and 11 years of age, pediatric medical providers are encouraged to evaluate patients at this time with a non-fasting non-HDL cholesterol (14). However, children with additional risk factors notably including a BMI >95th %ile, should be screened with a fasting lipid profile as early as 2 years of age. Other children in this category include those whose parent or grandparent have a known history of a cardiac event such as myocardial infarction (mother or grandmother <65 years of age; father or grandfather <55 years of age), children with diabetes or hypertension.


Dietary consumption of HFCS has increased rapidly since its discovery in 1965 (15). It is a low-cost sweetener, similar in taste to granulated sugar (sucrose), made from cornstarch and is commonly used in two forms. The first form HFCS is widely used commercially in some beverages, processed foods, cereals, and baked goods; the second HFCS is used in manufacturing of soft drinks (the numerical values reflect the percent fructose) (16). Although there is some dispute whether HCFS has led to the increase in obesity (17), it is apparent that both forms are consumed in larger quantity in the American diet. In 2018, the average American consumed approximately 22.l pounds of HFCS and 40.3 pounds of refined cane and beet sugar (18).


Both sucrose and HFCS are rapidly absorbed during digestion and hydrolyzed by the enzyme sucrase to form glucose and fructose in the microvilli lining the duodenum (19). Unlike fat metabolism which is slow, both fructose and glucose are usually metabolized within two hours in individuals who are not diabetic (20). Whereas most dietary glucose will pass through the liver and be used by skeletal muscle to form ATP for cell energy or processed by fat cells to glycerol

phosphate for triglyceride synthesis and stored energy, fructose is almost exclusively metabolized in the liver (Figure 1). The first step of fructose metabolism is the conversion to fructose 1-phosphate (F-1-P) by the enzyme fructokinase. F-1-P can then form either glycerol or dihydroxyacetone (DHAP). Whereas glycerol will form glycerol-3 Phosphate (G3P), DHAP can either form G3P or be isomerized to glyceraldehyde 3-phosphate (Ga-3-P). Ga-3-P will be oxidized to form pyruvate and reduced to lactate or be decarboxylated to form acetyl CoA. Acetyl CoA is a central intermediate in metabolism and can form a variety of byproducts including cholesterol, ATP, and fatty acids. G3P can then combine with fatty acids to form triglyceride which the liver packages as VLDL, the latter circulated in the blood stream. Hepatic glucose can either undergo glycogenesis which forms glycogen or glycolysis which can form DHAP. Like fructose metabolism, DHAP can form either G3P or Ga-3-P. From here the two pathways are similar to fructose metabolism with the ultimate formation of triglyceride which is then released from the liver within VLDL.

Figure 1. Fructose and Glucose Metabolism.

TG-RICH LIPOPROTEIN COMPOSITION


Triglyceride (TG) is normally located in the core of spherical circulating plasma lipoproteins. In the fasting state, VLDL is typically composed of 55% TG and 22% cholesterol, LDL has 5% TG and 50% cholesterol, and HDL has 5% TG and 20% cholesterol (21). Increases in hepatic

production of VLDL account for the majority of HTG cases resulting in a disproportionate increase in TG. However, VLDL is 22% cholesterol, which also is increased when VLDL production is excessive or when its disposal is defective leading to an elevation of the total cholesterol. In contrast, intestinally derived chylomicrons increase after meals and contain 90% triglyceride and only 3% cholesterol, but are efficiently catabolized by lipoprotein lipase, and their resulting remnant particles are taken up by hepatic receptors. Normally, TG reaches a peak 3 to 6 hours after a fat-containing meal and declines until there are no chylomicrons after ten hours of fasting. However, when disposal mechanisms are defective, chylomicrons account for very high TG levels and VLDL particles compete for lipolysis by lipoprotein lipase. Under these conditions the ratio of triglyceride to cholesterol approaches 10 to1, whereas the ratio is closer to 5 to1 when VLDL predominates. Excessive cholesterol enrichment of VLDL approaching a 1:1 ratio occurs when disposal of chylomicron and VLDL remnants are delayed – a defect usually presenting in adulthood and termed familial dysbetalipoproteinemia, a disorder attributed to variation in the amino acid sequence of Apo E (22).


NON-HDL CHOLESTEROL IN HTG


Since increased TG levels are often associated with atherogenic dyslipidemia, early plaque formation can occur. The Bogalusa Heart Study found that TG, total cholesterol and LDL-C in children and young adults aged 2 to 39 years of age were associated with post-mortem lesions in the coronary arteries and aorta (23), findings supported by the autopsy-based Pathological Determinants of Atherosclerosis in Youth (PDAY) study (24). While HTG has long been known as a biomarker associated with an increased risk of atherosclerotic cardiovascular disease (ASCVD) (25), the role for TG in atherosclerosis has remained less clear than for LDL-C but recent data supports a compelling role for TG and TG-rich lipoproteins as a cause of ASCVD rather simply as a biomarker (26,27,28). Consistently stronger prediction by non-HDL-C than LDL-C indicates that the cholesterol content of TG-rich lipoproteins (VLDL, IDL) represented by non-HDL-C can be regarded as a better predictor of risk than TG. This is also supported by the PDAY study in which non-HDL-C was associated with fatty streaks and raised lesions (29), and risk factors, including non-HDL-C and low HDL-C, accelerated progression of flat fatty streaks to raised lesions in the second decade. Childhood non-HDL-C, TG, Apo B, and Apo B:Apo A-I ratio all predicted carotid IMT after more than 20 years of follow-up, with non-HDL-C being superior to TG. (30) Therefore, targeting non-HDL-C in cases with intermediate triglyceride levels is a useful and productive strategy endorsed by the 2011 NHLBI (National Heart Lung and Blood Institute) Expert Panel’s recommendations (14).


TG METABOLISM IN THE SETTING OF INSULIN RESISTANCE


Common secondary HTG occurs in insulin resistant states such as obesity and type 2 diabetes (T2D) and can often become modified or exacerbated by other secondary causes. Since the abnormal lipid metabolism in insulin resistance has been extensively studied it serves as a foundation for understanding secondary dyslipidemia and potential for exacerbation by other causes (Figure 2).


Figure 2. Lipoprotein Metabolism in Insulin Resistance. A combination of excess production and disposal processes results in secondary HTG and atherogenic dyslipidemia in the insulin resistant state. Chylomicrons and VLDL production originating from the intestine and liver are increased. Mobilization of free fatty acids (FFA) from fat cells by hormone sensitive and TG lipases (HSL/TGL) provides the liver with substrate for VLDL formation. Dietary intake of fat provides the intestine with TG for chylomicron formation, which is upregulated in insulin resistance. Hepatic VLDL containing excess Apo C-III relative to Apo E is increased; Apo C-III delays receptor-mediated hepatic uptake of VLDL and chylomicron remnants resulting in formation of intermediate density lipoproteins (IDL, not shown) and smaller and denser low-density lipoproteins (LDL). Lipoprotein lipase (LPL) is inhibited by Apo C-III and decreased by insulin resistance and/or deficiency. Cholesterol ester transfer protein (CETP) is upregulated resulting in exchange of TG and cholesterol ester (CE), leading to TG enrichment of LDL and HDL. Both become substrates for hepatic triglyceride lipase (HTGL), which is upregulated and acts on TG-enriched HDL and LDL to make them smaller, atherogenic and dysfunctional. Apolipoproteins A-I, B-48, B-100, C-I, C-II, C-III (C), and E are labelled and play important roles in lipoprotein metabolism.


HTG PREVALENCE


In the U.S., the latest prevalence data for HTG comes from the 1999 - 2006 NHANES study, which found prevalence rates of 5.9% in normal weight children, 13.8% in overweight children and 24.1% in obese children (31). Given that Skinner et al found a positive linear trend for all definitions of overweight and obesity among children 2-19 years old, most prominently among adolescents and children aged 2 to 5 years (32), the current prevalence of HTG is almost


certainly significantly higher. Abnormal TG levels for children are generally classified on the basis of cut points based on population norms recommended by the American Academy of Pediatrics and the American Heart Association (33). The 50th to 95th percentile values for TG in children are presented in Table 1. Acceptable levels in children defined by the Expert Panel on Integrated Guidelines for Cardiovascular Health (14) are summarized in Table 2.


Table 1. Triglyceride Levels for Males and Females 5-19 Years of Age

Percentile

Males

Females

5-9 yrs

10-14 yrs

15-19 yrs

5-9 yrs

10-14 yrs

15-19 yrs

50th

48

58

68

57

68

64

75th

58

74

88

74

85

85

90th

70

94

125

103

104

112

95th

85

111

143

120

120

126

Mean concentration of triglycerides (mg/dL). Adapted from: Tamir I, Heiss G, Glueck CJ,

Christensen B, Kwiterovich P, Rifkind B. Lipid and lipoprotein distributions in white children ages 6–19 yrs: the Lipid Research Clinics Program Prevalence Study. J Chronic Dis. 1981; 34(1):27– 39.


Table 2. Acceptable Lipid levels for Children - Expert Panel on Integrated Guidelines for Cardiovascular Health (14)


Acceptable

Borderline

High

Total Cholesterol

<170

170-199

≥200

LDL-C

<110

110-129

≥130

Non-HDL-C

< 120


Triglycerides


0-9 years

<75

75-99

≥100

10-19 years

<90

90-129

≥130


The non-HDL-C which is equally accurate when measured on a fasting or non-fasting lipid panel reflects the sum of all apolipoprotein (Apo)-B-containing, triglyceride-rich lipoprotein subfractions (LDL, VLDL, Intermediate-Density Lipoprotein (IDL), lipoprotein (a), and chylomicron remnants. As triglycerides increase, there is a corresponding increase in the non–HDL-C level which correlates with Apo B much better than LDL-C. Hypertriglyceridemia can be diagnosed if TG level is ≥100 mg/dL in children (<10 year) or ≥130 mg/dL in adolescents (10–19 years) based on an average of two fasting measurements. Severe secondary hyper-TG, defined as levels above 1000 mg/dL, presents a risk for acute pancreatitis, especially when lipoprotein lipase-mediated clearance is saturated (> 800 mg/dL) causing the triglyceride to attain very high levels often exceeding 1000 mg/dL, with appearance of chylomicrons on standing plasma. Moderate HTG, defined as levels 150-499 mg/dL, is a risk factor for CVD. These children tend to be undertreated despite potential for reversal and primary prevention of cardiovascular disease (34).


MEASUREMENT ASPECTS


Although the non-HDL-cholesterol does not require fasting, the standard lipid profile which includes total cholesterol (TC), LDL-C, HDL-C, TG, and very low-density lipoprotein-cholesterol (VLDL-C) should be performed in pediatric patients in the fasting state (at least 8 hours) and guideline directed therapy is based on fasting values. Currently, some laboratories still use a calculated value for VLDL-C and LDL-C based on the Friedewald Formula (35) which estimates the VLDL-C by a fixed ratio of 5 (VLDL-C = TG/5). Because of the significant deviation from linearity at high TG levels (typically 400 mg/dL is used as a cut-point), VLDL-C and LDL-C values are not reported. This is especially important in dyslipidemias where both the TG and LDL-C can be elevated (i.e., familial combined hyperlipidemia) or where the TG level is severely elevated as a result of genetic and/or nutritional factors because it can lead to an under appreciation of the extent of the LDL-C elevation, the latter being especially important for guideline-directed therapy to lower cholesterol and in particular, LDL-C. Recently several equations have been developed that improved the accuracy of the calculated LDL-C. The Martin-Hopkins equation uses an adjustable factor based on lipid profiles from the Very Large Database of Lipids where TG levels were directly measured on samples separated using vertical spin density-gradient ultracentrifugation rather than a fixed ratio to calculate VLDL-C and subsequently the LDL-C (36). While this equation is more accurate than the Friedewald equation at high TG levels, there is still significant error for TG> 400 mg/dL addressed by the extended Martin/Hopkins calculation (37) and the Sampson equation (38). The Sampson equation was derived using beta quantification LDL-C values (the “gold standard” for LDL-C values) using multiple least squares regression analysis to derive a fixed equation to calculate the LDL-C value. All three equations have been proven to be superior to the Friedewald equation and many laboratories have already incorporated these equations when reporting lipid measures. Several pediatric studies have specifically addressed these improved methods to calculate VLDL-C and LDL-C (39,40,41).


GENETIC BACKGROUND


Commonly encountered HTG is usually multigenic and results from small-effect variants (single nucleotide polymorphisms) in many genes or heterozygotes in genes such as APOA5, GCKR, LPL, and APOB that have larger effects and together, more than 20% of susceptibility is accounted for by common and rare variants (42). The population frequency of the HTG phenotype was shown in the Copenhagen General Population Study in which a small percentage have a non-fasting TG level greater than 1000 mg/dL, whereas the majority have intermediate levels ranging from greater than the 95th percentile to 500 mg/dL and higher, often secondary to an underlying disorder (43).


Gene-Environment Interaction


Heterozygous relatives of cases with autosomal recessive familial chylomicronemia carry loss-of-function mutations in genes such as LPL, APOC2, APOA5, LMF1, and GPIHBP are generally


asymptomatic. Although they have close to normal lipids they may develop severe HTG (44) when exposed to exogenous factors such as alcohol, oral estrogen treatment, obesity, and pregnancy posing a risk for acute pancreatitis (45,46). These observations suggest that adolescent carriers, such as siblings of severely affected homozygotes, should be identified by genotyping to detect carriage of a single allele. If identified as carriers, they should be advised on avoiding risk factors such as alcohol and pharmaceutical agents discussed further in this review.


Susceptibility to environmental factors is common; for example, a typical case scenario occurs in a child with a mild increase in LDL-C who develops an increase in triglyceride and non-HDL-C during adolescence. The HTG is worsened by the onset of obesity and participation in social activities involving alcohol consumption and taking oral estrogens as birth control pills. Since insulin resistance and T2D have become more common in adolescence, the gene-environment interaction results in mixed dyslipidemia (47) with variable elevations in TG and cholesterol (48). The interaction is common in cases with a pedigree suggestive of familial combined hyperlipidemia (FCHL) reported to have a prevalence of 1 per 100 and characterized by variable lipid profiles among family members with apparent dominant inheritance, but some have a high cholesterol and others have a high triglyceride or elevations in both. The phenotype has also been defined as having elevated Apo B and TG levels in at least two affected family members, and has been associated with several variants including USF1, supporting a multigenic rather than a monogenic origin as originally thought (49).


Mendelian Randomization


The important role of genetics in determining HTG associated risk is highlighted by recent Mendelian randomization studies in which individuals carrying a protective mutation were compared to unaffected carriers over a lifetime. Recent studies on loss of function APOC3 mutations are a classic example. As compared with non-carriers, carriers of APOC3mutations had 39% lower TG levels, 16% lower LDL-C levels, and 22% higher HDL-C levels (50). The risk of coronary heart disease was reduced by 40% and was attributed to the lifetime effect of the normal or low levels. These remarkable findings were replicated in a Danish study with similar reductions in TG and cardiovascular disease in individuals with the protective APOC3 mutations (51). Randomization occurs in populations when sorted according to genotype and provides study design analogous to that used in pharmaceutical trials, but with the added benefit that exposure to lower levels of atherogenic lipoproteins in the genetically protected arm of the study begins at birth and continue over the lifespan. These landmark studies contribute evidence that a low TG and an associated improved lipid profile is beneficial, and supports interventions such as lifestyle, and pharmaceutical lowering when indicated, beginning at young ages.


DEVELOPMENTAL FACTORS


A sequence of factors, beginning during gestation, influence the development of hypertriglyceridemia (HTG) later in life (Figure 3).


Figure 3. Developmental Influences. Metabolic processes are programmed during gestation and early childhood and are influenced by disease states and environmental factors such as dietary excess and inactivity. The HTG is associated with atherogenic dyslipidemia consisting of increased non-HDL-C (non-high-density lipoprotein-cholesterol), LDL-P (LDL particle number), Apo B (apolipoprotein B), decreased HDL-C (high density lipoprotein cholesterol) and decreased Apo A-I.


Maternal nutrition and placental function affect nutrient supply for fetal growth and influence subsequent development of the metabolic syndrome (52). Overweight children who were small for gestational age (SGA) have increased risk for components of the metabolic syndrome compared to overweight children who were appropriate for gestation age (AGA). These effects on growth are attributed to restriction in intrauterine growth (53). After gestational programming, nutritional and endocrine factors play a role during childhood and affect development of risk factors including dyslipidemia (Figure 3). Preterm infants have higher meal frequency than older children and adults, but less efficient fat digestion and absorption, making it difficult to cope with a high fat intake relative to their body weight (54). Consequently, HTG is a frequent occurrence. Since pancreatic lipase and bile salt secretion is often inadequate for facilitating absorption of fat and its utilization as a source of energy, premature babies often fail to thrive and need exogenous fat as a component of total intravenous parenteral nutrition titrated according to the TG level (55). If lipoprotein lipase is genetically defective plasma clearance is even more compromised and severe HTG occurs during lipid infusions. If clinical circumstances necessitate that fats be restricted, essential omega-3 and omega-6 fatty acids are supplied for development of the brain and retina, and medium chain TG are an effective energy source without raising TG levels since they are directly transported to the liver via the portal system (56).


Increases in obesity, particularly as abdominal fat, during childhood predict the metabolic syndrome and compound the effect of an abnormal birth weight (57). Also, low adiponectin has been associated with insulin resistance, particularly in African American youth and compounds dyslipidemia (58). The adrenal axis may be involved; urinary free cortisol is associated with the metabolic syndrome in children (59), but the role of cortisol is controversial. Conversion of cortisone to cortisol by 11 beta -hydroxysteroid dehydrogenase type 1 (11 beta -HSD1) results in cortisol excess leading to insulin resistance, hypertension, and dyslipidemia. Inhibition of the enzyme results in reversal of metabolic syndrome criteria providing potential for pharmaceutical intervention (60). Normal puberty causes a transient increase in insulin resistance, attributed to maturational increases in sex and growth hormones, and may increase prevalence of both the metabolic syndrome and type 2 diabetes (61).


SECONDARY CAUSES OF HYPERTRIGLYCERIDEMIA


While primary HTG is associated with relatively rare monogenic and more common polygenic forms, there are many secondary non-genetic factors. The lipid abnormalities associated with these causes are summarized in Table 3.


Table 3. Secondary HTG Causes, Lipid Effects and Mechanism


Disease

TG

Chol

HDL-C

Mechanism


a). HTG (variable hypercholesterolemia)


Obesity

++

sdLDL + Apo B

-

Hepatic production


Type 2 diabetes

++

sdLDL + Apo B

-

Hepatic production and deficient disposal


Type 1 diabetes

+ or

++

+

-

Hepatic production and deficient disposal


NAFLD

++

sdLDL

_

Hepatic production of large VLDL


GSD 1

++

++


Hepatic production


Bile duct obstruction


+++


LpX formation from albumin, globulin & lipids.


Cushing’s disease

+

+

-

Insulin resistance effects


Lipodystrophy

++


-

Secondary LPL deficiency and diabetes


Stress and trauma

+

+


Increased stress hormones


Pregnancy

+

+


Progesterone effects


CRI

++

+

-

Similar to metabolic syndrome


HIV

+

+


Inflammation, treatments, lipodystrophy


Rheumatoid arthritis

+

+


Inflammation, cytokines


Lupus

+

+


Inflammation, cytokines


Gammopathies

+

+


Antibodies to LDL-R and LPL


b) Hypercholesterolemia (variable HTG)


Lysosomal acid lipase def.


++

-

Excess cholesterol synthesis (high liver enzymes and excess cholesterol storage),


Bile duct obstruction


+++


LpX formation from albumin, globulin & lipids.


Hypothyroidism

+

++


LDL receptor deficiency


Growth hormone deficiency


+


LDL receptor deficiency


Nephrotic syndrome

+

++


Increased synthesis (low fatty acids)


Saturated and trans fats


+


Dietary excess and LDL-R down-regulation


Anorexia nervosa


+


Nutrient deficiencies


Endocrine


OBESITY


In early 2023, the AAP published a clinical pathway guideline aimed at treatment interventions for the 14.4 million children and adolescents who are now obese, noting that it is the most common chronic pediatric disease in the United States (62). It focuses on the child’s health status, family system, community context, and the resources for treatment to create the best evidence-based treatment plan. These include 13 Key Action Statements some of which pediatricians and other children healthcare providers are already engaged in including assessing for overweight/obesity, various screening including social determinants of health, and diagnostic studies. As with all children and adolescents, universal lipid screening is recommended but screening should also include screening for pre-diabetes and a hepatic profile to evaluate for the presence of fatty liver disease. Intervention can take place in the medical home or using the chronic care model, engaging in a family-centered non-stigmatizing approach. Referrals for overweight and obese children as young as 2 years-of-age may be referred for intensive health behavior and lifestyle treatment. Pharmacotherapy can be initiated by the pediatric healthcare provider at age 12 as an adjunct to health behavior and lifestyle treatment. At age 13, adolescents with BMI ≥ 120% of the 95th percentile for age and sex may be referred to metabolic and bariatric surgery programs.


Obesity has prevailed as the most prominent cardiovascular risk factor beginning in childhood and associated with dietary factors such as excessive consumption of refined carbohydrates, saturated fat and trans fatty acids which not only contribute to weight gain but also cause dyslipidemia (32). Children and adolescents are increasingly referred for obesity associated with dyslipidemia constituting HTG coupled with small dense LDL and low HDL-C (63,64), and with resistance to insulin in muscle and adipose tissue leading to increased plasma insulin and free fatty acids (65). Consumption of high amounts of carbohydrate and fat, being physically unfit, and having close relatives with similar presentations and progression to T2D or manifestations of the metabolic syndrome is often evident (66). Physical characteristics include being overweight or obese; the distribution of fat is generalized but consistently associated with an increased waist circumference, the latter strongly predicting adolescent-onset risk factors (67,68). The skin is hyper-pigmented and thickened at characteristic locations around the neck, knees, elbows, and sites of friction. This condition, called acanthosis nigricans, is associated with insulin resistance (69) and thought by many to be a central component of the metabolic syndrome for which American Indian and Hispanic ethnic groups are particularly predisposed, but Caucasians and African Americans also have high rates (69).


Resistance to insulin action results in mobilization of adipocyte TG and increased fatty acid availability for uptake by muscle and an inverse association with insulin resistance (70). The increased hepatic supply of fatty acids coupled with insulin-stimulated hepatic TG synthesis results in increased VLDL formation and HTG (71) constituting a component of Apo B-containing VLDL particles (72, 73); and increased chylomicron production contributes to the TG level (Figure 2) (74). The effect on lipoproteins is significant since it alters function in favor of atherogenesis. An entropic mechanism involves TG-rich particles exchanging their TG for cholesterol ester via cholesterol-ester transfer protein (CETP) thereby enriching LDL and HDL with TG; a process that is increased by insulin resistance (75). Both LDL and HDL become substrates for hepatic TG lipase, which is up-regulated (76) leading to formation of small dense LDL and small HDL prone to degradation (77, 78).


TYPE 2 DIABETES


Atherogenic dyslipidemia with increased triglyceride and low HDL-C precedes the onset of prediabetes and T2D in association with persisting insulin resistance (79). LDL glycation and oxidation is increased (80, 81) accounting for increased atherogenesis (82). In the Treatment Options for T2D in Adolescents and Youth (TODAY) trial, 699 adolescents were studied in three treatment groups receiving metformin alone, metformin with rosiglitazone, and metformin with intensive lifestyle. Twenty one percent (21%) had a high triglyceride or were on a lipid-lowering medication at baseline and 23 % had a high level after three years. During this same period Apo B increased from a mean value of 76.6 mg/dl to 80.1 mg/dl associated with deterioration in glycemic control attributed to a decline in β-cell function. However, the intensive lifestyle arm had significantly lower TG levels after three years (83). The data indicate that T2D in youth is associated with significant cardiovascular risk and difficult to control requiring a multidisciplinary approach (84).


TYPE 1 DIABETES


Children with type 1 diabetes (T1D) tend to have elevations in TG and cholesterol when insulin is insufficient, reflecting the dependence of lipoprotein lipase on insulin for synthesis and secretion. Increased triglyceride and cholesterol correct after two weeks of intensified insulin delivery (85), and the low HDL-C increases after two months (86). When cases present with severe insulin deficiency and ketoacidosis, TG and cholesterol attain very high levels but normalize on standard treatment with insulin and intravenous fluids (87, 88). These changes reflect the role of insulin in lipoprotein lipase transcription, synthesis, and secretion. Intensified insulin delivery increases Apo A-I and HDL-C even when control of the diabetes reflected by glycosylated hemoglobin remains unchanged (89). However, the relatively normal lipid profiles seen in treated patients with T1D is a paradox since the risk for CVD persists and remains a frequent cause of death (90), but development of renal complications plays a compounding role (91). Subcutaneous insulin bypasses physiological insulin delivery to the liver, and also results in a delayed plasma insulin peak compared to physiological insulin secretion from the pancreas (92), but the resulting delay in chylomicron clearance was not found to be associated with glucose control or elevated fasting TG in adolescents. However, potentially atherogenic apoB-48 containing remnants are increased after a meal challenge (93) and increases in free fatty acids, a correlate of post-prandial TG (94), are harmful to the endothelium by inducing pro-inflammatory effects (95).


Apo C-III, a correlate of triglyceride, has been implicated in the pathogenesis of atherosclerosis (96) in hyperglycemic and insulin resistant states and may have an atherosclerotic role in T1D. The Apo C-III promoter contains both a carbohydrate response element that is responsive to glucose fluctuations (97) and an insulin response element (98) making it susceptible to both glucose fluctuations and insulin deficiency since it is normally down-regulated by insulin. Observations in patients with T1D provide supportive evidence that increased Apo C-III is associated with poor glucose control (99, 100) and being overweight (101). In the DCCT/EDIC T1D cohort with a significant adolescent aged population at onset, Apo C-III was associated with retinopathy (102) and albuminuria (103), implicating Apo C-III and associated TG-rich lipoproteins in microvascular disease (104).


LIPODYSTROPHY


Congenital and autoimmune lipodystrophies (105) are a group of genetic and acquired disorders characterized by loss of body fat, either partial or generalized (106). The degree of fat loss determines the severity of metabolic complications such as HTG, ectopic fat accumulation, insulin resistance, and progression to diabetes. Loss of adipocytes results in progressive LPL deficiency and chylomicronemia. Reduction in fat intake is effective in reducing risk for pancreatitis; however, insulin resistance and high carbohydrate intake may result in excess VLDL production requiring the use of prescription omega-3 fatty acids and fibrates. Metformin is the drug of choice for diabetes but trial evidence is lacking for the specific use of glucose-lowering agents in lipodystrophy (106). Loss of adipocytes also leads to acquired leptin deficiency and severe hyperphagia making dietary management of HTG, glucose intolerance, and overt diabetes difficult. Recent approval of recombinant leptin (metreleptin, Amylin Pharmaceuticals) has greatly improved outcomes and quality of life; treatment trials for children are in process. Although formation of leptin antibodies has attenuated the effects (107), follow-up studies suggest that low titers may not result in significant decline in the clinical response.


HYPOTHYROIDISM


Overt hypothyroidism, either autoimmune or congenital, commonly presents in childhood and at onset may be characterized by an increase in LDL-C and Apo B because of a reduced number of LDL receptors (85). In subclinical hypothyroidism the lipid profile is characterized by normal or slightly elevated total cholesterol levels and LDL-C in adults (108) but this observation has been less evident in children (109).


GROWTH HORMONE


Growth hormone deficiency and excess are both causes of hyperlipidemia. GH deficiency down-regulates the LDL receptor (110) and can result in elevations in total cholesterol and LDL-C that are reduced by treatment (111); whereas excess GH tends to mobilize fatty acids and increase VLDL triglyceride (112, 113), as seen in cases with acromegaly or gigantism in childhood.


Heptic


NON-ALCOHOLIC FATTY LIVER DISEASE (NAFLD)


NAFLD, manifesting as ectopic fat deposition in the liver, is observed in obese children and adolescents in association with increased visceral fat and features of metabolic syndrome (114). The condition is associated with insulin resistance and high TG independent of intra-myocellular fat.


HEPATITIS C


Hepatitis C is associated with steatosis and a unique dysmetabolic syndrome characterized by insulin resistance, inflammation-induced atherosclerosis but a low cholesterol level.(115) The virus interferes with distal steps in cholesterol synthesis and with Apo B secretion. Risk for atherosclerosis is attributed to vascular inflammation (116, 117).


GLYCOGEN STORAGE DISEASE (GSD)


GSDs are associated with HTG (118, 119) and present as significant diagnostic and therapeutic challenges since the onset is at an early age. Type I GSD is caused by a recessively inherited defect in glucose-6-phosphatase, and accounts for more than 60% of the GSD types involving the liver and results in the highest TG levels due to excessive VLDL production. It presents during the first year of life with severe hypoglycemia and hepatomegaly caused by the accumulation of hepatic glycogen. Increased VLDL production is associated with TG-rich particles containing excess Apo C-III and Apo E (120). In addition, the metabolic consequences of impeded glucose formation and excessive anaerobic glycolysis manifest as hypoglycemia with lactic acidemia, hyperuricemia and dyslipidemia. Impaired growth factor production and acidosis result in poor growth and delayed puberty. Many of these effects, including impaired growth, can be reversed by sustained correction of hypoglycemia with dietary sources of complex carbohydrate. Restoration of euglycemia results in less stress-hormone induced stimulation of metabolic excesses derived from activated anaerobic glycolysis. Continuous complex carbohydrate feeding regimens are prescribed as frequent meals and supplementation with corn-starch. However, to effectively normalize the TG, frequent corn-starch dosing is needed to achieve blood glucose levels continuously above 75 mg/dL, especially at night. This approach involves high carbohydrate intakes, which in the long term may increase VLDL production often resulting in requirement for lipid lowering medications.


Renal


Nephrosis is associated with increased cholesterol synthesis and increased TG attributed to lipoprotein lipase inhibition (121). A two-phase dyslipidemia occurs in which TG hydrolysis by lipoprotein lipase is impaired when albumin levels are too low to remove fatty acids at an adequate rate after hydrolysis (122). Association with atherosclerosis is in part attributed to increases in Lp(a) and Apo C-III (123,124). Findings in chronic kidney disease in children resemble those in adults and simulate atherogenic dyslipidemia seen in the metabolic syndrome.


Immune


Immune causes are rare in adults and children but should be considered in specific clinical situations. HIV (human immunodeficiency virus) is associated with partial lipodystrophy and insulin resistance. The lipid profile before treatment shows a high triglyceride, low HDL-C, and small dense LDL (125), and subsequent treatment with protease inhibitors can make the situation worse (126). In gammopathies such as in Hodgkin’s disease, antibodies can sequester factors required for LPL activity (127) or they can impede lipoprotein uptake by receptors (128). Although less frequent than in adults, monoclonal or oligoclonal gammopathies, predominantly IgG mediated, occur in children with various autoimmune diseases, hematologic diseases, malignancies, transplantations, and immunodeficiencies (129).


PHARMACOLOGICAL CAUSES


Pharmacological agents have significant effects on plasma lipids. In some cases the mechanism is known but is frequently uncertain or unknown. The potential for causing dyslipidemia is particularly important in a patient that has an underlying genetic predisposition. Changing the offending medication or treating the dyslipidemia are both options, especially when the disease requires long term management and alternative medications are limited or not available. Each medication class has characteristic effects on the lipid profile but some, such as glucocorticoids, oral estrogens, and alcohol, may increase HDL-C and others may increase both cholesterol and triglyceride (Table 4).


Table 4. Classes of Medications and Examples Causing Hypertriglyceridemia in Childhood


Medication Class

TG

TC

HDL-C

Examples


Glucocorticoids

++

+

+

prednisone, hydrocortisone


Oral estrogens

+

+

+

ethinyl estradiol


Anabolic steroids

+

+

-

depo-testosterone, oxandrolone


Estrogen receptor blockade

+


tamoxifen


Retinoids

+


-

isotretinoin


Immune suppressants

+

+


cyclosporine, sirolimus, tacrolimus

Protease inhibitors

+


-

ritonavir, nelfinovir and indinivir


Diuretics

++


-

chlorthiazide, diuril


Antipsychotics

+


-

clozapine, olanzapine, cimetidine


Beta blockers

+


-

propranolol, labetelol


Bile acid sequestrants

+


cholestyramine, colestipol, cholesevelam


Alcohol

+


+

spirits, wines, beers


Glucocorticoids


Glucocorticoids, especially in high doses, cause significant combined dyslipidemia and the effects on lipids may be compounded by other medications, the disease itself, or the patient’s genetic background. Lipid changes during treatment of chronic illnesses show elevations in triglyceride and LDL-C due to increased production, with variable changes in HDL-C but often increases (130). The effects may depend on the preparation used, dose and disease being treated (131). Combination drug therapy with L-asparaginase, an inhibitor of lipoprotein lipase, used for the induction phase in leukemia therapy can cause marked elevations in TG and is also diabetogenic (132). Lipid-lowering to prevent acute pancreatitis and thrombotic events is possible without stopping the chemotherapy.


Estrogens


Oral estrogens such as ethinyl estradiol usually prescribed with progestogen as oral contraceptives increase the production rate of Apo B-containing lipoproteins but the increase is counterbalanced by an increased catabolic rate (133). This finding accounts for only a slight increase in cholesterol and triglyceride within the normal range in adolescent girls (134), however interaction with obesity is possible with respect to LDL-C and fasting glucose (135). Reducing the dose of estrogen from the previously prescribed high dose preparations was effective in offsetting cardiovascular risk, however interactions with other risk factors such as smoking may occur (136).


Estrogen receptor blockade with tamoxifen has been associated with mild hyper-TG in women treated for breast cancer or its prevention, but it has rare use in childhood except for treatment of pubertal gynecomastia.


Retinoids


Retinoids such as isotretinoin (Accutane, 13-cis-retinoic acid) is indicated for treatment of severe nodular acne and can be prescribed for as long as 20 weeks, but careful monitoring is required. Severe HTG resulting from lipoprotein lipase inhibition frequently occurs, and can cause acute pancreatitis (137, 138). It acts via retinoic acid and retinoid x receptors (116) and there is also ongoing interest in use for cancer therapy and chemoprevention (139, 140).


Immune Suppressants


Cyclosporine (141), sirolimus (142), and tacrolimus are used in transplant patients and immune-mediated diseases in children requiring long term treatment and monitoring when indicated (143, 144). The mechanism is via down-regulation of hepatic 7alpha-hydroxylase and myocyte and adipocyte lipoprotein lipase down-regulation (145).


Protease Inhibitors


Protease inhibitors are associated with HTG and low HDL-C and add to the effects of the lipodystrophy syndrome occurring before anti-retroviral treatment of human immunodeficiency virus infections in pediatric cases, particularly during adolescence (146). Drugs such as ritonavir, nelfinovir and indinivir cause more severe dyslipidemia than others (147).

Nucleoside reverse transcriptase inhibitors can also cause TG and cholesterol elevations (148).


Bile Acid Sequestrants


Bile acid sequestrants should be avoided in cases with mixed dyslipidemia since they elevate TG (149). Fibrates or omega-3s, although effective in lowering TG, may transiently raise LDL-C during lipolysis of VLDL and conversion to LDL.


Diuretics


Diuretics including thiazides and loop diuretics such as furosemide alone or as combination therapy for hypertension raise cholesterol and TG and lower HDL-C in a dose dependent manner and more so in African Americans (150).


Beta-Blockers


Beta-blockers increase TG and lower HDL-C especially preparations without alpha-blocking activity but have rare indication in childhood since combination therapy for hypertension does not have trial evidence, (151) but they are used for management of arrhythmias.


Antipsychotics


Antipsychotics have pediatric psychiatric indications and agents such as clozapine and olanzapine induce HTG. However, it is not clear if the effect is independent of HTG induced by increased appetite and resulting weight gain typical of this class of medications and may require prescription changes or behavioral modification when possible (152).


Anabolic Steroids


Covert use of anabolic steroids in adolescent athletes and should be suspected with HTG and unusually low HDL-C levels. Medical use of oxandrolone for growth or androgens for aplastic anemia is rare and seldom has an indication.


Alcohol


Alcohol consumption has dyslipidemic effects, particularly with chronic use (153), and promotes development of fatty liver disease and associated HTG (154), particularly in susceptible Hispanic adolescents or in those with underlying genetic predisposition. As with steroids and estrogens, a typical presentation is with a markedly increased TG level with a higher-than-expected HDL-C (Table 4).


MANAGEMENT


General


Obesity and insulin resistance associated with dietary excess and inactivity should be assessed as potential targets in the therapeutic plan. If the identifiable cause(s) of secondary HTG cannot be corrected or optimally managed, as in patients with severe disorders or on essential drug therapy for their underlying diseases, lifestyle management is a priority. A six month trial of weight management by restricting excessive calories, saturated fat, and refined carbohydrate in the diet is recommended by the NHLBI Expert Panel (14). There is also consensus that diet, exercise and behavioral modalities should be used in combination for successful outcomes in children (155), which are dependent on self-motivation, family support, and access to skilled instruction, preferably provided by a dietitian with pediatric experience. A comprehensive team approach for use of exercise and behavioral modalities is considered optimal. Successful programs serve as role models for providers, particularly from centers with resources for team approaches similar to those designed for obesity management (156).


Drug Therapy


Treatment of the primary disorder is the first priority, i.e., treating HTG associated with T2D diabetes requires specific therapies based on the severity of the TG elevation and response to lifestyle. Rare disorders require specific therapies such as complex carbohydrates for maintaining euglycemia in GSD, and leptin therapy for lipodystrophy (discussed above). If pharmaceutical agents are the cause, modification of the treatment plan can be considered in consultation with the primary specialist. Sunil et al recently summarized medications targeted for HTG (157) as well as hypercholesterolemia and the former are summarized in figure 4 and several are discussed in detail herein, Unfortunately, none of these medications are approved below age 18 years-of-age, therefore treatment of HTG in children and adolescents is largely restricted to lifestyle changes. The most important aspect of dietary counseling is also discerning if the HTG is associated with insulin resistance where lowering simple sugars and carbohydrates is key or hyperchylomicronemia where fat restriction is paramount or where these disorders overlap.


Figure 4. Triglyceride lowering medications. From Ref. 157.


STATINS


Statins which are not described in figure 4 lower cholesterol, specifically LDL-C and have minimal effect on HTG. However, for commonly encountered dyslipidemia there is good reason to follow established guidelines to reduce the future CVD risk through the use of statin therapy (14). If a six-month trial of intensive lifestyle is not effective in reaching the recommended goal, the LDL-C and non-HDL-C become targets using appropriate agents such as statins. As discussed previously, non-HDL-C is a preferred target for individuals with mild to moderate TG elevations (150-499 mg/dl) as recommended by the 2011 expert NHLBI panel (14). For LDL-C and non-HDL-C above 95thpercentiles in the presence of HTG and at least one other risk factor, statin therapy is indicated selecting from approved statins for children over age 10 years (15). The reported statin association with type 2 diabetes (158,159) should be considered when obesity and associated genetic risk for diabetes is present.


It should be emphasized that when statin treatment is indicated for drug-induced hypercholesterolemia, care should be taken to avoid interactions with drugs that are metabolized by pathways utilizing cytochrome P450 enzymes, such as CYP3A4 for atorvastatin, lovastatin and simvastatin and CYP2C9 for fluvastatin and rosuvastatin (159). Drugs such as clarithromycin, cyclosporine A, diltiazem, erythromycin, ketoconazole, itraconazole, mibefradil, midazolam, nefazodone, nifedipine, protease inhibitors, quinidine, sildenafil, terbinafine, verapamil and warfarin are CYP3A4 utilizers and will raise the statin levels when used together, thus increasing risk of toxicity. Likewise, alprenolol, diclofenac, fluconazole, hexobarbitoal, n-desmethyldiazepan, tolbutamide and warfarin are CYP2C9 utilizers and will be incompatible with fluvastatin and rosuvastatin. Several of these drugs have common pediatric usage including certain antibiotics and antifungal agents.


FIBRATES


Based on adult evidence of harmful effects of TG-rich lipoproteins, small dense LDL, and remnant lipoproteins derived from VLDL and chylomicrons (160) and the metabolic effects of TG and associated increase in fatty acids (161), pharmacological TG lowering in childhood is indicated for selected cases resistant to lifestyle (14). Individuals with severe isolated HTG at risk for acute pancreatitis should have a trial of a TG-lowering agent such as a fibrate (i.e., gemfibrozil or fenofibrate), beginning with the lowest available dose while monitoring for adverse effects. Fibrates, approved for use over age 18 years, have limited trial evidence in children but a fibrate (bezafibrate, not available in the United States) was shown to be safe when used for children with familial hypercholesterolemia before statins were available for use (162). It is however notable that few adult trials have shown benefit of fibrates on cardiovascular event reduction. Niacin while historically used (163), no longer has a place in the management of dyslipidemia.


OMEGA-3 FATTY ACIDS


Omega-3-fatty acids have appeal as a potential TG-lowering agent for children because of their relatively low adverse effect profile and recent availability as a prescription grade preparation following purification to remove heavy metals and fatty acids (164). Although adults have had up to 30% TG lowering with 4-gram doses, 2 gram doses are less effective and increased LDL-C is a recognized adverse effect (165,166). but the LDL-C to HDL-C ratio is unchanged (167). A retrospective survey of children treated for TG lowering with omega-3 fatty acids at a dose of 0.5 to 1 gram per day, did not show significant TG lowering suggesting that prescription of relatively low doses may not be helpful. The study supports use of higher doses in combination with lifestyle measures. A high purity prescription form of icosapent ethyl (eicosapentaenoic acid ethyl ester), lowers TG while lowering LDL particle concentration and LDL-C in cases with TG over 500mg/L (168, 169), but it is not yet available for use under 18 years of age, however it appears to be a reasonable consideration for testing in pediatric settings. The free fatty acid form as shown in the EpanoVa fOr Lowering Very high triglyceridEs (EVOLVE) trial is effective for TG-lowering (170), but not yet available for use in children. Non-prescription marine omega-3s can be safely used if patients are instructed on what to look for on the label (e.g., distilled, USP approved) and specific marine sources with high concentrations are recommended (171).


SEVERE SECONDARY HTG


Treatment for HTG with levels above 1000 mg/dl in patients with partial defects in chylomicron clearance by LPL or its co-factors requires total dietary fat restriction for 72 hours followed by dietary management in the longer term. The approach is similar to the management of homozygous familial chylomicronemia for which there is more information (172) (reviewed in another chapter). It should be recognized that small increments in fat can cause striking increases in plasma TG because when TG levels saturate LPL activity, any additional TG entering the plasma will face zero order kinetics and increase the TG in a non-linear fashion. TG can be substantially lowered by restricting dietary fat to less than 15% of the total daily caloric intake and cases vary in their response to fibrates depending on their effect on residual lipoprotein lipase and on suppression of hepatic TG production. Adherence to a very low-fat diet requires supplementation with linoleic acid and fat-soluble vitamins (A, D, E and K), but frequent monitoring is advised. Supplemental medium chain triglycerides (MCT) may be beneficial in providing additional calories and improving compliance. Fenofibrate can be helpful in cases with residual lipoprotein lipase activity and also may reduce hepatic TG production. New agents are being developed to increase clearance and/or reduce the production of triglyceride-rich lipoproteins, but their clinical efficacy, cost effectiveness, and indications, especially in children, are yet to be established (173).


CONCLUSION


In addition to obesity accompanied by metabolic syndrome, other common and rare causes of secondary dyslipidemia require diagnosis-specific management strategies. Identification and prioritization of reversible causes and risk factors, use of comprehensive lifestyle approaches, and optimal choice of medications based on guidelines can lead to improved outcomes. Lifestyle modification with selective prescription of medications designed to reduce risk of cardiovascular disease is indicated for individuals with intermediate TG levels ranging from 150­499 mg/dL, but severely elevated levels imposing risk for acute pancreatitis, require more intense dietary restriction combined with TG-lowering medications. The results of AAP’s recent recommendation of a more aggressive approach to treatment of childhood obesity await outcome data. Since non-HDL-C is a known predictor of cardiovascular disease and represents an estimate of all atherogenic lipoprotein particles TG-rich lipoproteins, it is recommended as a preferred target especially in most cases with intermediate elevations of TG.


REFERENCES


  1. Blackett PR, Wilson DP, McNeal CJ. Secondary hypertriglyceridemia in children and adolescents. Journal of clinical lipidology. 2015 Sep 1;9(5):S29-40.
  2. Jung MK, Yoo EG. Hypertriglyceridemia in obese children and adolescents. Journal of obesity & metabolic syndrome. 2018 Sep;27(3):143.
  3. Shah AS, Wilson DP. Primary hypertriglyceridemia in children and adolescents. Journal of Clinical Lipidology. 2015 Sep 1;9(5):S20-8.
  4. Shah AS, Wilson DP. Genetic disorders causing hypertriglyceridemia in children and adolescents. Endotext [Internet]. 2020 Jan 22.
  5. Sunil B, Ashraf AP. Childhood Hypertriglyceridemia: Is It Time for a New Approach?. Current Atherosclerosis Reports. 2022 Apr;24(4):265-75.
  6. Magge SN, Goodman E, Armstrong SC, Daniels S, Corkins M, de Ferranti S, Golden NH, Kim JH, Schwarzenberg SJ, Sills IN, Casella SJ. The metabolic syndrome in children and adolescents: shifting the focus to cardiometabolic risk factor clustering. Pediatrics. 2017 Aug 1;140(2).
  7. Reisinger C, Nkeh-Chungag BN, Fredriksen PM, Goswami N. The prevalence of pediatric metabolic syndrome—A critical look on the discrepancies between definitions and its clinical importance. International Journal of Obesity. 2021 Jan;45(1):12-24.
  8. Christian Flemming GM, Bussler S, Körner A, Kiess W. Definition and early diagnosis of metabolic syndrome in children. Journal of Pediatric Endocrinology and Metabolism. 2020 Jul 28;33(7):821-33.
  9. Weihe P, Weihrauch-Blüher S. Metabolic syndrome in children and adolescents: diagnostic criteria, therapeutic options and perspectives. Current obesity reports. 2019 Dec;8:472-9.
  10. Ford ES, Li C, Zhao G, Pearson WS, Mokdad AH 2008 Prevalence of the metabolic syndrome among U.S. adolescents using the definition from the International Diabetes Federation. Diabetes care 31:587-589
  11. Regis A. The CHILD 1 diet: from strategy to practicality. Pediatric Annals. 2013 Sep 1;42(9):e188-90.
  12. Selvarj K, Olave-Pichon A, Benuck I, et al. Characteristics of children referred to a lipid clinic before and after the universal screening guidelines. Clinical Pediatrics. (2019) 58(6):656-664.
  13. Capra ME, Biasucci G, Banderali G, Pederiva C. Nutritional Treatment of Hypertriglyceridemia in Childhood: From Healthy-Heart Counselling to Life-Saving Diet. Nutrients. 2023 Feb 22;15(5):1088.
  14. Expert Panel on Integrated Guidelines for Cardiovascular Health and Risk Reduction in Children and Adolescents: summary report. Pediatrics. (2011) 128:S213-56; Expert Panel on Integrated Guidelines for Cardiovascular Health and Risk Reduction in Children and Adolescents: full report. U.S. Department of Health and Human Services. (2011)]
  15. White JS. Sucrose, HFCS, and Fructose: History, Composition, Applications, and Production. Chapter 2 in J.M. Rippe (ed.), Fructose, High Fructose Corn Syrup, Sucrose and Health, Nutrition and Health. Springer Science+Business Media New York. (2014) ISBN 978-1-4899-8077-9
  16. High Fructose Corn Syrup Questions and Answers. U.S. Food and Drug Administration. (2018)
  17. White JS. Misconceptions about high-fructose corn syrup: Is it uniquely responsible for obesity, reactive dicarbonyl compounds, and advanced glycation endproducts? Journal of Nutrition. (2009) 139(6):1219S-1227S
  18. Lee JH, Duster M, Roberts T, Devinsky O. United States Dietary Trends Since 1800: Lack of Association Between Saturated Fatty Acid Consumption and Non-communicable Diseases. Front Nutr. 2022 Jan 13;8:748847. doi: 10.3389/fnut.2021.748847. PMID: 35118102; PMCID: PMC8805510.
  19. Drozdowski LA, Thomson AB. Intestinal sugar transport. World J Gastroenterol. (2006) 12(11):1657-70.
  20. Chernecky CC, Berger BJ. Glucose tolerance test (GTT,OGTT) – blood. In: Chernecky CC, Berger BJ, eds. Laboratory Tests and Diagnostic Procedures. 6th ed. Philadelphia, PA: Elsevier Saunders. (2013) 591-593
  21. Kwiterovich PO 2010 Lipid, apolipoprotein, and lipoprotein metabolism: implications for the diagnosis and treatment of dyslipidemia: Wolters Kluwer/Lippincott Williams & Wilkins
  22. Smelt AH, de Beer F 2004 Apolipoprotein E and familial dysbetalipoproteinemia: clinical, biochemical, and genetic aspects. Seminars in vascular medicine 4:249-257
  23. Berenson GS, Srinivasan SR, Bao W, Newman WP, 3rd, Tracy RE, Wattigney WA 1998 Association between multiple cardiovascular risk factors and atherosclerosis in children and young adults. The Bogalusa Heart Study. The New England journal of medicine 338:1650-1656
  24. McGill HC, Jr., McMahan CA, Zieske AW, Sloop GD, Walcott JV, Troxclair DA, Malcom GT, Tracy RE, Oalmann MC, Strong JP 2000 Associations of coronary heart disease risk factors with the intermediate lesion of atherosclerosis in youth. The Pathobiological Determinants of Atherosclerosis in Youth (PDAY) Research Group. Arteriosclerosis, thrombosis, and vascular biology 20:1998-2004
  25. Miller M, Stone NJ, Ballantyne C, Bittner V, Criqui MH, Ginsberg HN, Goldberg AC, Howard WJ, Jacobson MS, Kris-Etherton PM, Lennie TA. Triglycerides and cardiovascular disease: a scientific statement from the American Heart Association. Circulation. 2011 May 24;123(20):2292-333.
  26. Hussain A, Ballantyne CM, Saeed A, Virani SS. Triglycerides and ASCVD risk reduction: recent insights and future directions. Current Atherosclerosis Reports. 2020 Jul;22:1-0.
  27. Budoff M. Triglycerides and triglyceride-rich lipoproteins in the causal pathway of cardiovascular disease. The American journal of cardiology. 2016 Jul 1;118(1):138-45.
  28. Nordestgaard BG. Triglyceride-rich lipoproteins and atherosclerotic cardiovascular disease: new insights from epidemiology, genetics, and biology. Circulation research. 2016 Feb 19;118(4):547-63.
  29. McGill HC, Jr., McMahan CA, Herderick EE, Tracy RE, Malcom GT, Zieske AW, Strong JP 2000 Effects of coronary heart disease risk factors on atherosclerosis of selected regions of the aorta and right coronary artery. PDAY Research Group. Pathobiological Determinants of Atherosclerosis in Youth. Arteriosclerosis, thrombosis, and vascular biology 20:836-845
  30. Frontini MG, Srinivasan SR, Xu J, Tang R, Bond MG, Berenson GS 2008 Usefulness of childhood non-high density lipoprotein cholesterol levels versus other lipoprotein measures in predicting adult subclinical atherosclerosis: the Bogalusa Heart Study. Pediatrics 121:924-929
  31. Centers for Disease Control and Prevention (CDC) Prevalence of abnormal lipid levels among youths: United States, 1999–2006. MMWR Morb Mortal Wkly Rep. 2010;59:29–33
  32. Skinner AC, Ravanbakht SN, Skelton JA, Perrin EM, Armstrong SC. Prevalence of Obesity and Severe Obesity in US Children, 1999-2016. Pediatrics. 2018 Mar;141(3):e20173459. doi: 10.1542/peds.2017-3459. Erratum in: Pediatrics. 2018 Sep;142(3): PMID: 29483202; PMCID: PMC6109602.
  33. Kavey RE, Daniels SR, Lauer RM, Atkins DL, Hayman LL, Taubert K, American Heart A 2003 American Heart Association guidelines for primary prevention of atherosclerotic cardiovascular disease beginning in childhood. Circulation 107:1562-1566
  34. Wilson DP, McNeal C, Blackett P 2015 Pediatric dyslipidemia: recommendations for clinical management. Southern medical journal 108:7-14
  35. Friedewald WT, Levy RI, Fredrickson DS. Estimation of the concentration of low-density lipoprotein cholesterol in plasma, without use of the preparative ultracentrifuge. Clin Chem. (1972) 18:499-502.]
  36. Martin SS, Blaha MJ, Elshazly MB, Toth PP, Kwiterovich PO, Blumenthal RS, Jones SR. Comparison of a novel method vs the Friedewald equation for estimating low-density lipoprotein cholesterol levels from the standard lipid profile. Jama. 2013 Nov 20;310(19):2061-8.
  37. Sajja A, Park J, Sathiyakumar V, Varghese B, Pallazola VA, Marvel FA, et al. Comparison of Methods to Estimate LowDensity Lipoprotein Cholesterol in Patients With High Triglyceride Levels. JAMA Netw Open. 2021;4(10):e2128817
  38. Sampson M, Ling C, Sun Q, Harb R, Ashmaig M, Warnick R, Sethi A, Fleming JK, Otvos JD, Meeusen JW, Delaney SR. A new equation for calculation of low-density lipoprotein cholesterol in patients with normolipidemia and/or hypertriglyceridemia. JAMA cardiology. 2020 May 1;5(5):540-8.
  39. Steyn N, Rossouw HM, Pillay TS, Martins J. Comparability of calculated LDL-C with directly measured LDL-C in selected paediatric and adult cohorts. Clinica Chimica Acta. 2022 Dec 1;537:158-66.
  40. Chan KK, Dickerson JA. Assessment of LDL-C Calculation Using the Newly Adopted NIH LDL-C Equation in a Pediatric Population. Clinical Chemistry. 2022 Oct 6;68(10):1338-9.
  41. Garoufi A, Drakatos A, Tsentidis C, Klinaki E, Paraskakis I, Marmarinos A, Gourgiotis D. Comparing calculated LDL-C with directly measured LDL-C in healthy and in dyslipidemic children. Clinical biochemistry. 2017 Jan 1;50(1-2):16-22.
  42. Johansen CT, Hegele RA 2011 Genetic bases of hypertriglyceridemic phenotypes. Current opinion in lipidology 22:247-253
  43. Hegele RA, Ginsberg HN, Chapman MJ, Nordestgaard BG, Kuivenhoven JA, Averna M, Boren J, Bruckert E, Catapano AL, Descamps OS, Hovingh GK, Humphries SE, Kovanen PT, Masana L, Pajukanta P, Parhofer KG, Raal FJ, Ray KK, Santos RD, Stalenhoef AF, Stroes E, Taskinen MR, Tybjaerg-Hansen A, Watts GF, Wiklund O, European Atherosclerosis Society Consensus P 2014 The polygenic nature of hypertriglyceridaemia: implications for definition, diagnosis, and management. The lancet. Diabetes & endocrinology 2:655-666
  44. Brunzell JD, Schrott HG 2012 The interaction of familial and secondary causes of hypertriglyceridemia: role in pancreatitis. Journal of clinical lipidology 6:409-412
  45. Julien P, Vohl MC, Gaudet D, Gagne C, Levesque G, Despres JP, Cadelis F, Brun LD, Nadeau A, Ven Murthy MR 1997 Hyperinsulinemia and abdominal obesity affect the expression of hypertriglyceridemia in heterozygous familial lipoprotein lipase deficiency. Diabetes 46:2063-2068
  46. Gupta M, Liti B, Barrett C, Thompson PD, Fernandez AB. Prevention and management of hypertriglyceridemia-induced acute pancreatitis during pregnancy: a systematic review. The American Journal of Medicine. 2022 Jun 1;135(6):709-14.
  47. Kelishadi R, Poursafa P. A review on the genetic, environmental, and lifestyle aspects of the early-life origins of cardiovascular disease. Current problems in pediatric and adolescent health care. 2014 Mar 1;44(3):54-72.
  48. Zhang Z, Gillespie C, Welsh JA, Hu FB, Yang Q. Usual intake of added sugars and lipid profiles among the US adolescents: National Health and Nutrition Examination Survey, 2005–2010. Journal of Adolescent Health. 2015 Mar 1;56(3):352-9.
  49. Bello-Chavolla OY, Kuri-García A, Ríos-Ríos M, Vargas-Vázquez A, Cortés-Arroyo JE, Tapia-González G, Cruz-Bautista I, Aguilar-Salinas CA. Familial combined hyperlipidemia: current knowledge, perspectives, and controversies. Revista de investigacion clinica. 2018 Nov 15;70(5):224-36.
  50. Tg, Hdl Working Group of the Exome Sequencing Project NHL, Blood I, Crosby J, Peloso GM, Auer PL, Crosslin DR, Stitziel NO, Lange LA, Lu Y, Tang ZZ, Zhang H, Hindy G, Masca N, Stirrups K, Kanoni S, Do R, Jun G, Hu Y, Kang HM, Xue C, Goel A, Farrall M, Duga S, Merlini PA, Asselta R, Girelli D, Olivieri O, Martinelli N, Yin W, Reilly D, Speliotes E, Fox CS, Hveem K, Holmen OL, Nikpay M, Farlow DN, Assimes TL, Franceschini N, Robinson J, North KE, Martin LW, DePristo M, Gupta N, Escher SA, Jansson JH, Van Zuydam N, Palmer CN, Wareham N, Koch W, Meitinger T, Peters A, Lieb W, Erbel R, Konig IR, Kruppa J, Degenhardt F, Gottesman O, Bottinger EP, O'Donnell CJ, Psaty BM, Ballantyne CM, Abecasis G, Ordovas JM, Melander O, Watkins H, Orho-Melander M, Ardissino D, Loos RJ, McPherson R, Willer CJ, Erdmann J, Hall AS, Samani NJ, Deloukas P, Schunkert H, Wilson JG, Kooperberg C, Rich SS, Tracy RP, Lin DY, Altshuler D, Gabriel S, Nickerson DA, Jarvik GP, Cupples LA, Reiner AP, Boerwinkle E, Kathiresan S 2014 Loss-of-function mutations in APOC3, triglycerides, and coronary disease. The New England journal of medicine 371:22-31
  51. Jorgensen AB, Frikke-Schmidt R, Nordestgaard BG, Tybjaerg-Hansen A 2014 Loss-of-function mutations in APOC3 and risk of ischemic vascular disease. The New England journal of medicine 371:32-41
  52. Barker DJ, Thornburg KL 2013 Placental programming of chronic diseases, cancer and lifespan: a review. Placenta 34:841-845
  53. Reinehr T, Kleber M, Toschke AM 2009 Small for gestational age status is associated with metabolic syndrome in overweight children. European journal of endocrinology / European Federation of Endocrine Societies 160:579-584
  54. Lindquist S, Hernell O 2010 Lipid digestion and absorption in early life: an update. Current opinion in clinical nutrition and metabolic care 13:314-320
  55. Adamkin DH, Radmacher PG 2014 Current trends and future challenges in neonatal parenteral nutrition. Journal of neonatal-perinatal medicine
  56. Johnson PJ 2014 Review of macronutrients in parenteral nutrition for neonatal intensive care population. Neonatal network : NN 33:29-34
  57. Brufani C, Fintini D, Giordano U, Tozzi AE, Barbetti F, Cappa M 2011 Metabolic syndrome in italian obese children and adolescents: stronger association with central fat depot than with insulin sensitivity and birth weight. International journal of hypertension 2011:257168
  58. Lee S, Bacha F, Gungor N, Arslanian SA 2006 Racial differences in adiponectin in youth: relationship to visceral fat and insulin sensitivity. Diabetes care 29:51-56
  59. Reinehr T, Kulle A, Wolters B, Knop C, Lass N, Welzel M, Holterhus PM 2014 Relationships between 24-hour urinary free cortisol concentrations and metabolic syndrome in obese children. The Journal of clinical endocrinology and metabolism 99:2391-2399
  60. Schnackenberg CG, Costell MH, Krosky DJ, Cui J, Wu CW, Hong VS, Harpel MR, Willette RN, Yue TL 2013 Chronic inhibition of 11 beta -hydroxysteroid dehydrogenase type 1 activity decreases hypertension, insulin resistance, and hypertriglyceridemia in metabolic syndrome. BioMed research international 2013:427640
  61. Goran MI, Gower BA 2001 Longitudinal study on pubertal insulin resistance. Diabetes 50:2444-2450
  62. Clinical Practice Guideline for the Evaluation and Treatment of Children and Adolescents With Obesity. Pediatrics (2023) 151 (2): e2022060640. https://doi.org/10.1542/peds.2022-060640
  63. Copeland KC, Zeitler P, Geffner M, Guandalini C, Higgins J, Hirst K, Kaufman FR, Linder B, Marcovina S, McGuigan P, Pyle L, Tamborlane W, Willi S, Group TS 2011 Characteristics of adolescents and youth with recent-onset type 2 diabetes: the TODAY cohort at baseline. The Journal of clinical endocrinology and metabolism 96:159-167
  64. Giannini C, Santoro N, Caprio S, Kim G, Lartaud D, Shaw M, Pierpont B, Weiss R 2011 The triglyceride-to-HDL cholesterol ratio: association with insulin resistance in obese youths of different ethnic backgrounds. Diabetes care 34:1869-1874
  65. Olefsky JM, Farquhar JW, Reaven GM 1974 Reappraisal of the role of insulin in hypertriglyceridemia. The American journal of medicine 57:551-560
  66. Vassy JL, Shrader P, Yang Q, Liu T, Yesupriya A, Chang MH, Dowling NF, Ned RM, Dupuis J, Florez JC, Khoury MJ, Meigs JB 2011 Genetic associations with metabolic syndrome and its quantitative traits by race/ethnicity in the United States. Metabolic syndrome and related disorders 9:475-482
  67. Burns SF, Arslanian SA 2009 Waist circumference, atherogenic lipoproteins, and vascular smooth muscle biomarkers in children. The Journal of clinical endocrinology and metabolism 94:4914-4922
  68. Lee S, Bacha F, Arslanian SA 2006 Waist circumference, blood pressure, and lipid components of the metabolic syndrome. The Journal of pediatrics 149:809-816
  69. Stoddart ML, Blevins KS, Lee ET, Wang W, Blackett PR, Cherokee Diabetes S 2002 Association of acanthosis nigricans with hyperinsulinemia compared with other selected risk factors for type 2 diabetes in Cherokee Indians: the Cherokee Diabetes Study. Diabetes care 25:1009-1014
  70. Pan DA, Lillioja S, Kriketos AD, Milner MR, Baur LA, Bogardus C, Jenkins AB, Storlien LH 1997 Skeletal muscle triglyceride levels are inversely related to insulin action. Diabetes 46:983-988
  71. Tobey TA, Greenfield M, Kraemer F, Reaven GM 1981 Relationship between insulin resistance, insulin secretion, very low density lipoprotein kinetics, and plasma triglyceride levels in normotriglyceridemic man. Metabolism: clinical and experimental 30:165-171
  72. Basu A, Basu R, Shah P, Vella A, Rizza RA, Jensen MD 2001 Systemic and regional free fatty acid metabolism in type 2 diabetes. American journal of physiology. Endocrinology and metabolism 280:E1000-1006
  73. Zhang YL, Hernandez-Ono A, Ko C, Yasunaga K, Huang LS, Ginsberg HN 2004 Regulation of hepatic apolipoprotein B-lipoprotein assembly and secretion by the availability of fatty acids. I. Differential response to the delivery of fatty acids via albumin or remnant-like emulsion particles. The Journal of biological chemistry 279:19362-19374
  74. Nogueira JP, Maraninchi M, Beliard S, Padilla N, Duvillard L, Mancini J, Nicolay A, Xiao C, Vialettes B, Lewis GF, Valero R 2012 Absence of acute inhibitory effect of insulin on chylomicron production in type 2 diabetes. Arteriosclerosis, thrombosis, and vascular biology 32:1039-1044
  75. Coniglio RI, Merono T, Montiel H, Malaspina MM, Salgueiro AM, Otero JC, Ferraris R, Schreier L, Brites F, Gomez Rosso L 2012 HOMA-IR and non-HDL-C as predictors of high cholesteryl ester transfer protein activity in patients at risk for type 2 diabetes. Clinical biochemistry 45:566-570
  76. Deeb SS, Zambon A, Carr MC, Ayyobi AF, Brunzell JD 2003 Hepatic lipase and dyslipidemia: interactions among genetic variants, obesity, gender, and diet. Journal of lipid research 44:1279-1286
  77. Chapman MJ, Ginsberg HN, Amarenco P, Andreotti F, Boren J, Catapano AL, Descamps OS, Fisher E, Kovanen PT, Kuivenhoven JA, Lesnik P, Masana L, Nordestgaard BG, Ray KK, Reiner Z, Taskinen MR, Tokgozoglu L, Tybjaerg-Hansen A, Watts GF, European Atherosclerosis Society Consensus P 2011 Triglyceride-rich lipoproteins and high-density lipoprotein cholesterol in patients at high risk of cardiovascular disease: evidence and guidance for management. European heart journal 32:1345-1361
  78. Ginsberg HN 2002 New perspectives on atherogenesis: role of abnormal triglyceride-rich lipoprotein metabolism. Circulation 106:2137-2142
  79. Haffner SM, Stern MP, Hazuda HP, Mitchell BD, Patterson JK 1990 Cardiovascular risk factors in confirmed prediabetic individuals. Does the clock for coronary heart disease start ticking before the onset of clinical diabetes? Jama 263:2893-2898
  80. Cohen MP, Lautenslager G, Shea E 1993 Glycated LDL concentrations in non-diabetic and diabetic subjects measured with monoclonal antibodies reactive with glycated apolipoprotein B epitopes. European journal of clinical chemistry and clinical biochemistry : journal of the Forum of European Clinical Chemistry Societies 31:707-713
  81. Bowie A, Owens D, Collins P, Johnson A, Tomkin GH 1993 Glycosylated low density lipoprotein is more sensitive to oxidation: implications for the diabetic patient? Atherosclerosis 102:63-67
  82. Wang W, Khan S, Blackett P, Alaupovic P, Lee E 2013 Apolipoproteins A-I, B, and C-III in young adult Cherokee with metabolic syndrome with or without type 2 diabetes. Journal of clinical lipidology 7:38-42
  83. Today Study Group 2013 Lipid and inflammatory cardiovascular risk worsens over 3 years in youth with type 2 diabetes: the TODAY clinical trial. Diabetes care 36:1758-1764
  84. George MM, Copeland KC 2013 Current treatment options for type 2 diabetes mellitus in youth: today's realities and lessons from the TODAY study. Current diabetes reports 13:72-80
  85. Sherwin RS, Tamborlane WV, Genel M, Felig P 1980 Treatment of juvenile-onset diabetes by subcutaneous infusion of insulin with a portable pump. Diabetes care 3:301­308
  86. Dunn FL, Pietri A, Raskin P 1981 Plasma lipid and lipoprotein levels with continuous subcutaneous insulin infusion in type I diabetes mellitus. Annals of internal medicine 95:426-431
  87. Blackett PR, Holcombe JH, Alaupovic P, Fesmire JD 1986 Plasma lipids and apolipoproteins in a 13-year-old boy with diabetic ketoacidosis and extreme hyperlipidemia. The American journal of the medical sciences 291:342-346
  88. Weidman SW, Ragland JB, Fisher JN, Jr., Kitabchi AE, Sabesin SM 1982 Effects of insulin on plasma lipoproteins in diabetic ketoacidosis: evidence for a change in high density lipoprotein composition during treatment. Journal of lipid research 23:171-182
  89. Wilson DP, Fesmire JD, Endres RK, Blackett PR 1985 Increased levels of HDL-cholesterol and apolipoprotein A-I after intensified insulin therapy for diabetes. Southern medical journal 78:636-638
  90. Katz M, Laffel L 2015 Mortality in type 1 diabetes in the current era: two steps forward, one step backward. Jama 313:35-36
  91. Orchard TJ, Secrest AM, Miller RG, Costacou T 2010 In the absence of renal disease, 20 year mortality risk in type 1 diabetes is comparable to that of the general population: a report from the Pittsburgh Epidemiology of Diabetes Complications Study. Diabetologia 53:2312-2319
  92. Van Waarde WM, Odink RJ, Rouwe C, Stellaard F, Westers M, Vonk RJ, Sauer PJ, Verkade HJ 2001 Postprandial chylomicron clearance rate in late teenagers with diabetes mellitus type 1. Pediatric research 50:611-617
  93. Mangat R, Su JW, Lambert JE, Clandinin MT, Wang Y, Uwiera RR, Forbes JM, Vine DF, Cooper ME, Mamo JC, Proctor SD 2011 Increased risk of cardiovascular disease in Type 1 diabetes: arterial exposure to remnant lipoproteins leads to enhanced deposition of cholesterol and binding to glycated extracellular matrix proteoglycans. Diabetic medicine : a journal of the British Diabetic Association 28:61-72
  94. Lewis GF, O'Meara NM, Cabana VG, Blackman JD, Pugh WL, Druetzler AF, Lukens JR, Getz GS, Polonsky KS 1991 Postprandial triglyceride response in type 1 (insulin-dependent) diabetes mellitus is not altered by short-term deterioration in glycaemic control or level of postprandial insulin replacement. Diabetologia 34:253-259
  95. Goldberg IJ, Bornfeldt KE 2013 Lipids and the endothelium: bidirectional interactions. Current atherosclerosis reports 15:365
  96. Ooi EM, Barrett PH, Chan DC, Watts GF 2008 Apolipoprotein C-III: understanding an emerging cardiovascular risk factor. Clinical science 114:611-624
  97. Caron S, Verrijken A, Mertens I, Samanez CH, Mautino G, Haas JT, Duran-Sandoval D, Prawitt J, Francque S, Vallez E, Muhr-Tailleux A, Berard I, Kuipers F, Kuivenhoven JA, Biddinger SB, Taskinen MR, Van Gaal L, Staels B 2011 Transcriptional activation of apolipoprotein CIII expression by glucose may contribute to diabetic dyslipidemia. Arteriosclerosis, thrombosis, and vascular biology 31:513-519
  98. Altomonte J, Cong L, Harbaran S, Richter A, Xu J, Meseck M, Dong HH 2004 Foxo1 mediates insulin action on apoC-III and triglyceride metabolism. The Journal of clinical investigation 114:1493-1503
  99. Blackett P, Sarale DC, Fesmire J, Harmon J, Weech P, Alaupovic P 1988 Plasma apolipoprotein C-III levels in children with type I diabetes. Southern medical journal 81:469-473
  100. al Muhtaseb N, al Yousuf A, Bajaj JS 1992 Apolipoprotein A-I, A-II, B, C-II, and C-III in children with insulin-dependent diabetes mellitus. Pediatrics 89:936-941
  101. Krishnan S, Copeland KC, Bright BC, Gardner AW, Blackett PR, Fields DA 2011 Impact of type 1 diabetes and body weight status on cardiovascular risk factors in adolescent children. Journal of clinical hypertension 13:351-356
  102. Klein RL, McHenry MB, Lok KH, Hunter SJ, Le NA, Jenkins AJ, Zheng D, Semler A, Page G, Brown WV, Lyons TJ, Garvey WT, Group DER 2005 Apolipoprotein C-III protein concentrations and gene polymorphisms in Type 1 diabetes: associations with microvascular disease complications in the DCCT/EDIC cohort. Journal of diabetes and its complications 19:18-25
  103. Jenkins AJ, Yu J, Alaupovic P, Basu A, Klein RL, Lopes-Virella M, Baker NL, Hunt KJ, Lackland DT, Garvey WT, Lyons TJ, Group DER 2013 Apolipoprotein-defined lipoproteins and apolipoproteins: associations with abnormal albuminuria in type 1 diabetes in the diabetes control and complications trial/epidemiology of diabetes interventions and complications cohort. Journal of diabetes and its complications 27:447-453
  104. Yu JY, Lyons TJ 2013 Modified Lipoproteins in Diabetic Retinopathy: A Local Action in the Retina. Journal of clinical & experimental ophthalmology 4
  105. Agarwal AK, Garg A 2003 Congenital generalized lipodystrophy: significance of

         triglyceride biosynthetic pathways. Trends in endocrinology and metabolism: TEM 14:214­221

  1. Garg A 2011 Clinical review#: Lipodystrophies: genetic and acquired body fat disorders. The Journal of clinical endocrinology and metabolism 96:3313-3325
  2. Beltrand J, Lahlou N, Le Charpentier T, Sebag G, Leka S, Polak M, Tubiana-Rufi N, Lacombe D, de Kerdanet M, Huet F, Robert JJ, Chevenne D, Gressens P, Levy-Marchal C 2010 Resistance to leptin-replacement therapy in Berardinelli-Seip congenital lipodystrophy: an immunological origin. European journal of endocrinology / European Federation of Endocrine Societies 162:1083-1091
  3. Duntas LH 2002 Thyroid disease and lipids. Thyroid : official journal of the American Thyroid Association 12:287-293
  4. Catli G, Abaci A, Buyukgebiz A, Bober E 2014 Subclinical hypothyroidism in childhood and adolescense. Journal of pediatric endocrinology & metabolism : JPEM 27:1049-1057
  5. Rudling M, Norstedt G, Olivecrona H, Reihner E, Gustafsson JA, Angelin B 1992 Importance of growth hormone for the induction of hepatic low density lipoprotein receptors. Proceedings of the National Academy of Sciences of the United States of America 89:6983-6987
  6. Bengtsson BA, Abs R, Bennmarker H, Monson JP, Feldt-Rasmussen U, Hernberg-Stahl E, Westberg B, Wilton P, Wuster C 1999 The effects of treatment and the individual responsiveness to growth hormone (GH) replacement therapy in 665 GH-deficient adults.

         KIMS Study Group and the KIMS International Board. The Journal of clinical endocrinology and metabolism 84:3929-3935

  1. Angelin B, Rudling M 1994 Growth hormone and hepatic lipoprotein metabolism. Current opinion in lipidology 5:160-165
  2. Elam MB, Wilcox HG, Solomon SS, Heimberg M 1992 In vivo growth hormone treatment stimulates secretion of very low density lipoprotein by the isolated perfused rat liver. Endocrinology 131:2717-2722
  3. Cali AM, Caprio S 2009 Ectopic fat deposition and the metabolic syndrome in obese children and adolescents. Hormone research 71 Suppl 1:2-7
  4. Lonardo A, Adinolfi LE, Loria P, Carulli N, Ruggiero G, Day CP 2004 Steatosis and hepatitis C virus: mechanisms and significance for hepatic and extrahepatic disease. Gastroenterology 126:586-597
  5. Clark PJ, Thompson AJ, Vock DM, Kratz LE, Tolun AA, Muir AJ, McHutchison JG, Subramanian M, Millington DM, Kelley RI, Patel K 2012 Hepatitis C virus selectively perturbs the distal cholesterol synthesis pathway in a genotype-specific manner. Hepatology 56:49-56
  6. Domitrovich AM, Felmlee DJ, Siddiqui A 2005 Hepatitis C virus nonstructural proteins inhibit apolipoprotein B100 secretion. The Journal of biological chemistry 280:39802­39808
  7. Sever S, Weinstein DA, Wolfsdorf JI, Gedik R, Schaefer EJ 2012 Glycogen storage disease type Ia: linkage of glucose, glycogen, lactic acid, triglyceride, and uric acid metabolism. Journal of clinical lipidology 6:596-600
  8. Fernandes J, Alaupovic P, Wit JM 1989 Gastric drip feeding in patients with glycogen storage disease type I: its effects on growth and plasma lipids and apolipoproteins. Pediatric research 25:327-331
  9. Shah KK, O'Dell SD 2013 Effect of dietary interventions in the maintenance of normoglycaemia in glycogen storage disease type 1a: a systematic review and meta-analysis. Journal of human nutrition and dietetics : the official journal of the British Dietetic Association 26:329-339
  10. Kronenberg F 2005 Dyslipidemia and nephrotic syndrome: recent advances. Journal of renal nutrition : the official journal of the Council on Renal Nutrition of the National Kidney Foundation 15:195-203
  11. de Sain-van der Velden MG, Kaysen GA, Barrett HA, Stellaard F, Gadellaa MM, Voorbij HA, Reijngoud DJ, Rabelink TJ 1998 Increased VLDL in nephrotic patients results from a decreased catabolism while increased LDL results from increased synthesis. Kidney international 53:994-1001
  12. Attman PO, Alaupovic P 1990 Pathogenesis of hyperlipidemia in the nephrotic syndrome. American journal of nephrology 10 Suppl 1:69-75
  13. Saland JM, Ginsberg HN 2007 Lipoprotein metabolism in chronic renal insufficiency. Pediatric nephrology 22:1095-1112
  14. Feingold KR, Krauss RM, Pang M, Doerrler W, Jensen P, Grunfeld C 1993 The hypertriglyceridemia of acquired immunodeficiency syndrome is associated with an increased prevalence of low density lipoprotein subclass pattern B. The Journal of clinical endocrinology and metabolism 76:1423-1427
  15. Riddler SA, Li X, Chu H, Kingsley LA, Dobs A, Evans R, Palella F, Visscher B, Chmiel JS, Sharrett A 2007 Longitudinal changes in serum lipids among HIV-infected men on highly active antiretroviral therapy. HIV medicine 8:280-287
  16. Beaumont JL, Berard M, Antonucci M, Delplanque B, Vranckx R 1977 Inhibition of lipoprotein lipase activity by a monoclonal immunoglobulin in autoimmune hyperlipidemia. Atherosclerosis 26:67-77
  17. Nozaki S, Ito Y, Nakagawa T, Yamashita S, Sasaki J, Matsuzawa Y 1997 Autoimmune hyperlipidemia with inhibitory monoclonal antibodies against low density lipoprotein binding to fibroblasts in a case with multiple myeloma. Internal medicine 36:920-925
  18. Karafin MS, Humphrey RL, Detrick B 2014 Evaluation of monoclonal and oligoclonal gammopathies in a pediatric population in a major urban center. American journal of clinical pathology 141:482-487
  19. Sholter DE, Armstrong PW 2000 Adverse effects of corticosteroids on the cardiovascular system. The Canadian journal of cardiology 16:505-511
  20. Schroeder LL, Tang X, Wasko MC, Bili A 2014 Glucocorticoid use is associated with increase in HDL and no change in other lipids in rheumatoid arthritis patients. Rheumatology international
  21. Bhojwani D, Darbandi R, Pei D, Ramsey LB, Chemaitilly W, Sandlund JT, Cheng C, Pui CH, Relling MV, Jeha S, Metzger ML 2014 Severe hypertriglyceridaemia during therapy for childhood acute lymphoblastic leukaemia. European journal of cancer 50:2685-2694
  22. Duvillard L, Dautin G, Florentin E, Petit JM, Gambert P, Verges B 2010 Changes in apolipoprotein B100-containing lipoprotein metabolism due to an estrogen plus progestin oral contraceptive: a stable isotope kinetic study. The Journal of clinical endocrinology and metabolism 95:2140-2146
  23. Guazzelli CA, Lindsey PC, de Araujo FF, Barbieri M, Petta CA, Aldrighi JM 2005 Evaluation of lipid profile in adolescents during long-term use of combined oral hormonal contraceptives. Contraception 71:118-121
  24. Beasley A, Estes C, Guerrero J, Westhoff C 2012 The effect of obesity and low-dose oral contraceptives on carbohydrate and lipid metabolism. Contraception 85:446-452
  25. Chasan-Taber L, Stampfer MJ 1998 Epidemiology of oral contraceptives and cardiovascular disease. Annals of internal medicine 128:467-477
  26. Zane LT, Leyden WA, Marqueling AL, Manos MM 2006 A population-based analysis of laboratory abnormalities during isotretinoin therapy for acne vulgaris. Archives of dermatology 142:1016-1022
  27. McCarter TL, Chen YK 1992 Marked hyperlipidemia and pancreatitis associated with isotretinoin therapy. The American journal of gastroenterology 87:1855-1858
  28. Standeven AM, Thacher SM, Yuan YD, Escobar M, Vuligonda V, Beard RL, Chandraratna RA 2001 Retinoid X receptor agonist elevation of serum triglycerides in rats by potentiation of retinoic acid receptor agonist induction or by action as single agents. Biochemical pharmacology 62:1501-1509
  29. Freemantle SJ, Spinella MJ, Dmitrovsky E 2003 Retinoids in cancer therapy and chemoprevention: promise meets resistance. Oncogene 22:7305-7315
  30. Kuster GM, Drexel H, Bleisch JA, Rentsch K, Pei P, Binswanger U, Amann FW 1994 Relation of cyclosporine blood levels to adverse effects on lipoproteins. Transplantation 57:1479-1483
  31. Jankowska I, Czubkowski P, Socha P, Wierzbicka A, Teisseyre M, Teisseyre J, Pawlowska J 2012 Lipid metabolism and oxidative stress in children after liver transplantation treated with sirolimus. Pediatric transplantation 16:901-906
  32. Ballantyne CM, Podet EJ, Patsch WP, Harati Y, Appel V, Gotto AM, Jr., Young JB 1989 Effects of cyclosporine therapy on plasma lipoprotein levels. Jama 262:53-56
  33. Wissing KM, Unger P, Ghisdal L, Broeders N, Berkenboom G, Carpentier Y, Abramowicz D 2006 Effect of atorvastatin therapy and conversion to tacrolimus on hypercholesterolemia and endothelial dysfunction after renal transplantation. Transplantation 82:771-778
  34. Vaziri ND, Liang K, Azad H 2000 Effect of cyclosporine on HMG-CoA reductase, cholesterol 7alpha-hydroxylase, LDL receptor, HDL receptor, VLDL receptor, and lipoprotein lipase expressions. The Journal of pharmacology and experimental therapeutics 294:778-783
  35. Piloya T, Bakeera-Kitaka S, Kekitiinwa A, Kamya MR 2012 Lipodystrophy among HIV-infected children and adolescents on highly active antiretroviral therapy in Uganda: a cross sectional study. Journal of the International AIDS Society 15:17427
  36. Tsiodras S, Mantzoros C, Hammer S, Samore M 2000 Effects of protease inhibitors on hyperglycemia, hyperlipidemia, and lipodystrophy: a 5-year cohort study. Archives of internal medicine 160:2050-2056
  37. Jones R, Sawleshwarkar S, Michailidis C, Jackson A, Mandalia S, Stebbing J, Bower M, Nelson M, Gazzard BG, Moyle GJ 2005 Impact of antiretroviral choice on hypercholesterolaemia events: the role of the nucleoside reverse transcriptase inhibitor backbone. HIV medicine 6:396-402
  38. Crouse JR, 3rd 1987 Hypertriglyceridemia: a contraindication to the use of bile acid binding resins. The American journal of medicine 83:243-248
  39. Chobanian AV, Bakris GL, Black HR, Cushman WC, Green LA, Izzo JL, Jr., Jones DW, Materson BJ, Oparil S, Wright JT, Jr., Roccella EJ, National Heart L, Blood Institute Joint National Committee on Prevention DE, Treatment of High Blood P, National High Blood Pressure Education Program Coordinating C 2003 The Seventh Report of the Joint National Committee on Prevention, Detection, Evaluation, and Treatment of High Blood Pressure: the JNC 7 report. Jama 289:2560-2572
  40. National High Blood Pressure Education Program Working Group on High Blood Pressure in C, Adolescents 2004 The fourth report on the diagnosis, evaluation, and treatment of high blood pressure in children and adolescents. Pediatrics 114:555-576
  41. Libowitz MR, Nurmi EL. The burden of antipsychotic-induced weight gain and metabolic syndrome in children. Frontiers in Psychiatry. 2021 Mar 12;12:623681.
  42. Takahashi H, Ono M, Hyogo H, Tsuji C, Kitajima Y, Ono N, Eguchi T, Fujimoto K, Chayama K, Saibara T, Anzai K, Eguchi Y 2015 Biphasic effect of alcohol intake on the development of fatty liver disease. Journal of gastroenterology
  43. Pacifico L, Chiesa C, Anania C, De Merulis A, Osborn JF, Romaggioli S, Gaudio E 2014 Nonalcoholic fatty liver disease and the heart in children and adolescents. World journal of gastroenterology : WJG 20:9055-9071
  44. Richardson L, Paulis WD, van Middelkoop M, Koes BW 2013 An overview of national clinical guidelines for the management of childhood obesity in primary care. Preventive medicine 57:448-455
  45. Savoye M, Shaw M, Dziura J, Tamborlane WV, Rose P, Guandalini C, Goldberg-Gell R, Burgert TS, Cali AM, Weiss R, Caprio S 2007 Effects of a weight management program on body composition and metabolic parameters in overweight children: a randomized controlled trial. Jama 297:2697-2704
  46. Sunil B, Foster C, Wilson DP, Ashraf AP. Novel therapeutic targets and agents for pediatric dyslipidemia. Therapeutic Advances in Endocrinology and Metabolism. 2021 Nov;12:20420188211058323.
  47. Park ZH, Juska A, Dyakov D, Patel RV 2014 Statin-associated incident diabetes: a literature review. The Consultant pharmacist : the journal of the American Society of Consultant Pharmacists 29:317-334
  48. De Ferranti SD, Steinberger J, Ameduri R, Baker A, Gooding H, Kelly AS, Mietus-Snyder M, Mitsnefes MM, Peterson AL, St-Pierre J, Urbina EM. Cardiovascular risk reduction in high-risk pediatric patients: a scientific statement from the American Heart Association. Circulation. 2019 Mar 26;139(13):e603-34.
  49. Sacks FM, Alaupovic P, Moye LA, Cole TG, Sussex B, Stampfer MJ, Pfeffer MA, Braunwald E 2000 VLDL, apolipoproteins B, CIII, and E, and risk of recurrent coronary events in the Cholesterol and Recurrent Events (CARE) trial. Circulation 102:1886-1892
  50. Triglyceride Coronary Disease Genetics C, Emerging Risk Factors C, Sarwar N, Sandhu MS, Ricketts SL, Butterworth AS, Di Angelantonio E, Boekholdt SM, Ouwehand W, Watkins H, Samani NJ, Saleheen D, Lawlor D, Reilly MP, Hingorani AD, Talmud PJ, Danesh J 2010 Triglyceride-mediated pathways and coronary disease: collaborative analysis of 101 studies. Lancet 375:1634-1639
  51. Wheeler KA, West RJ, Lloyd JK, Barley J 1985 Double blind trial of bezafibrate in familial hypercholesterolaemia. Archives of disease in childhood 60:34-37
  52. Colletti RB, Neufeld EJ, Roff NK, McAuliffe TL, Baker AL, Newburger JW 1993 Niacin treatment of hypercholesterolemia in children. Pediatrics 92:78-82
  53. Bays H 2006 Clinical overview of Omacor: a concentrated formulation of omega-3 polyunsaturated fatty acids. The American journal of cardiology 98:71i-76i
  54. Harris WS 1997 n-3 fatty acids and serum lipoproteins: human studies. The American journal of clinical nutrition 65:1645S-1654S
  55. Park Y, Harris WS 2009 Dose-response of n-3 polyunsaturated fatty acids on lipid profile and tolerability in mildly hypertriglyceridemic subjects. Journal of medicinal food 12:803­808
  56. Harris WS, Windsor SL, Dujovne CA 1991 Effects of four doses of n-3 fatty acids given to hyperlipidemic patients for six months. Journal of the American College of Nutrition 10:220-227
  57. Chahal N, Manlhiot C, Wong H, McCrindle BW 2014 Effectiveness of Omega-3 Polysaturated Fatty Acids (Fish Oil) Supplementation for Treating Hypertriglyceridemia in Children and Adolescents. Clinical pediatrics 53:645-651
  58. Bays HE, Braeckman RA, Ballantyne CM, Kastelein JJ, Otvos JD, Stirtan WG, Soni PN 2012 Icosapent ethyl, a pure EPA omega-3 fatty acid: effects on lipoprotein particle concentration and size in patients with very high triglyceride levels (the MARINE study). Journal of clinical lipidology 6:565-572
  59. Kastelein JJ, Maki KC, Susekov A, Ezhov M, Nordestgaard BG, Machielse BN, Kling D, Davidson MH 2014 Omega-3 free fatty acids for the treatment of severe hypertriglyceridemia: the EpanoVa fOr Lowering Very high triglyceridEs (EVOLVE) trial. Journal of clinical lipidology 8:94-106
  60. Harris WS 1996 n-3 fatty acids and lipoproteins: comparison of results from human and animal studies. Lipids 31:243-252
  61. Hypertriglyceridemia in Children and Adolescents. 2023 Feb 22. In: Feingold KR, Anawalt B, Blackman MR, Boyce A, Chrousos G, Corpas E, de Herder WW, Dhatariya K, Dungan K, Hofland J, Kalra S, Kaltsas G, Kapoor N, Koch C, Kopp P, Korbonits M, Kovacs CS, Kuohung W, Laferrère B, Levy M, McGee EA, McLachlan R, New M, Purnell J, Sahay R, Singer F, Sperling MA, Stratakis CA, Trence DL, Wilson DP, editors. Endotext [Internet]. South Dartmouth (MA): com, Inc.; 2000–. PMID: 27809432.
  62. Goldberg IJ. Hypertriglyceridemia: impact and treatment. Endocrinology and metabolism clinics of North America. 2009 Mar 1;38(1):137-49.

Nutritional Management of Pediatric Dyslipidemia

ABSTRACT


Lifestyle therapies are important in helping to reduce risk of premature cardiovascular disease. A family-centered, behavioral approach to lifestyle modification is generally the most successful approach for children and adolescents. A registered dietitian nutritionist plays a pivotal role in implementing therapeutic lifestyle changes, uniquely trained to fully assess the child's nutrition status as well as outlining practical strategies to obtain the desired behavioral changes.  For all children and adolescents one year of age and older, the Cardiovascular Health Integrated Lifestyle Diet (CHILD-1 diet) is the first step in helping achieve the goal of a healthy lifestyle.  Key to this initial dietary recommendation is restricting saturated fat intake to <10% of daily calorie intake and reducing cholesterol consumption to <300 mg/day.  Those unable to achieve the desired goals while following a CHILD-1 diet should be advanced to the CHILD-2 diet after a three-month trial.  The CHILD-2 diet includes further restriction of saturated fat and cholesterol.  In addition to the CHILD-2 diet, supplementation with plant sterol and stanol esters, water-soluble psyllium fiber, or omega-3 fatty acids may help a child achieve the desired lipid goals.  Nutrition recommendations vary according to age, and parents/caregivers should be counseled accordingly. Each individual age range provides unique challenges, making ongoing nutrition counseling an important part of maintaining modifications in those following a lipid-lowering diet. Regular follow-up visits with appropriate monitoring of the child's understanding of, and satisfaction with, the diet, test results, readiness to change, and growth parameters is important for continued success.  The use of motivational interviewing during visits is frequently helpful in enhancing knowledge, maintaining interest, identifying barriers, and setting short- and long-term goals.


ROLE OF MEDICAL NUTRITION THERAPY IN PEDIATRIC DYSLIPIDEMIA


The National Lipid Association (NLA), American Heart Association (AHA), and American College of Cardiology (ACC) all regard lifestyle therapies as an important component in helping reduce risk of premature cardiovascular disease, alone or in conjunction with pharmacotherapies (1-4). Research of cardiovascular disease risk reduction has shown improper diets, especially those with excess energy intake, to be major contributors to hypercholesterolemia and obesity in children and adolescents (5).  Counseling of those at risk of premature atherosclerotic cardiovascular disease (ASCVD) focuses on (1) altering diet composition; (2) increasing physical activity; (3) calorie reduction for weight loss in those who are overweight and obese; (4) global reduction of risk factors associated with metabolic syndrome; and (5) cessation/avoidance of tobacco use (1). A behavioral approach to lifestyle modification provided by a registered dietitian nutritionist has been identified as the most consistently effective approach to evoke dietary change (5). In the pediatric population, both the child and family should be engaged in counseling efforts.


NUTRITION ASSESSMENT


Prior to providing recommendations for lipid-lowering diets, it is important to gather a comprehensive assessment of the child’s current nutritional status and the entire family's readiness to change. Identification of a family’s current healthcare beliefs and practices, nutritional status, and eating patterns can be a valuable resource in estimating future success in implementing and sustaining therapeutic lifestyle changes.  Growth charts, if available, should be reviewed to determine nutrition risks such as malnutrition or obesity. Anthropometric measures of note include the child's age- and sex- appropriate height, weight, body mass index (BMI), and BMI Z-score.  Although generally not formally assessed, the body weight and body mass index of the parent/caregiver as well as other family members should also be taken into account.  Food insecurity or financial barriers to diet modification should also be addressed, including use of the food assistance programs such as the Supplemental Nutrition Assistance Program (SNAP), Supplemental Nutrition Program for Women, Infants, and Children (WIC), National School Lunch Program (NSLP), and food pantries.  This allows modification of dietary recommendations to better align with child and family needs.


A diet recall or discussion regarding typical daily dietary intake is generally the most useful information to determine areas of dietary improvement (6). Special attention should be paid to the child’s main sources of meals, frequency of eating meals outside of the home, between-meal snacks, and baseline level of physical activity. Identifying use of nutritional supplements, herbal remedies, and dietary restrictions is also important, as these may affect baseline and follow-up lipid levels.


NUTRITION INTERVENTIONS


Dietary Guidelines


CHILD-1 (STEP 1 DIET)


The CHILD-1 diet (Table 1) is the first step in diet modification for all children 1 year of age and older, including those with a family history of early cardiovascular disease, obesity, dyslipidemia, diabetes mellitus, primary hypertension, or exposure to smoking at home. Parameters of this diet include restricting total fat intake to 25-30% of daily calories, saturated fat intake to less than 10% of daily calories, and limiting daily cholesterol intake to 300mg or less (5).  Polyunsaturated fatty acids should constitute up to 10% of daily caloric intake, while targeting a monounsaturated fatty acid intake of 10-15% of daily caloric intake (5). Trans fats should be avoided as they have been shown to increase LDL-C as well as decrease HDL-C. Common sources of saturated and unsaturated fats are outlined in Table 2. Reduction of sugar-sweetened beverage intake should be encouraged, as this has been associated with decreased obesity measures (5). In addition, a daily dietary fiber intake of at least the child’s age + 5g for young children and up to 14g per 1000 calories for older children should be encouraged (7). The American Academy of Pediatrics (AAP) recommends at least 1 hour of moderate-to-vigorous physical activity daily for children 5 years and older (8). This diet has shown to decrease total cholesterol and LDL-C, while lowering the incidence of obesity and insulin resistance. The CHILD-1 diet has been shown to be safe and effective, and may decrease LDL-C by an average of 12% from baseline values. Any resulting decrease in body weight for those who are overweight or obese may also increase levels of HDL-C and decrease triglyceride concentrations (9).


TABLE 1. EVIDENCE-BASED DIET FOR CHILDREN AND ADOLESCENTS: CHILD-1


Birth to 6 months

All babies should be exclusively breastfed until 6 months of age. Donor breast milk or iron-fortified infant formula may be utilized if maternal breastmilk is unavailable or contraindicated. No supplemental food is recommended.


6 to 12 months

Breastfeeding should be continued until at least 12 months of age while gradually adding solids; transition to iron-fortified infant formula until 12 months if if maternal breastmilk is unavailable or contraindicated.

Fat intake should not be restricted unless medically indicated.

No sweetened beverages should be offered; Limit other beverages to 100% fruit juice (≤4oz/day); Encourage water.


12 to 24 months

Transition to unflavored, reduced-fat cow’s milk. Fat content (2% to fat free) should be based on child’s growth, intake of other nutrient-dense foods, total fat intake, and family history of obesity or

cardiovascular disease

Avoid sugar-sweetened beverages; Limit 100% fruit juice to ≤4oz/day; Encourage water

Offer table foods with:

Total fat 30% of daily kcal intake

Saturated fat 8-10% daily kcal intake

Avoid trans fats

Mono- and polyunsaturated fat up to 20% daily kcal intake

Cholesterol <300mg/day

Limit sodium intake


2 to 10 years

Primary beverage should be unflavored, fat-free milk

Limit/avoid sugar-sweetened beverages; Limit 100% fruit juice to ≤4oz/day; Encourage water

Dietary fat:

Total fat 25-30% of daily kcal intake

Saturated fat 8-10% daily kcal intake

Avoid trans fats

Mono- and polyunsaturated fat up to 20% daily kcal intake

Cholesterol <300mg/day

Encourage high dietary fiber intake

Encourage at least 1 hour of moderate-to-vigorous physical activity daily for children >5 years


11 to 21 years

Primary beverages should be fat-free unflavored milk and water

Limit/avoid sugar-sweetened beverages; Limit 100% fruit juice to ≤4oz/day

Dietary fat:

Total fat 25-30% of daily kcal intake

Saturated fat 8-10% daily kcal intake

Avoid trans fats

Mono- and polyunsaturated fat up to 20% daily kcal intake

Cholesterol <300mg/day

Encourage high dietary fiber intake

Encourage at least 1 hour of moderate-to-vigorous physical activity daily

Encourage healthy eating habits such as daily breakfast, limiting fast-foods, and eating meals as a family.


 TABLE 2. COMMON DIETARY FAT SOURCES

Saturated Fat

Trans Fat

Monounsaturated Fat

Polyunsaturated Fat

Red meats

Poultry skin

Full fat dairy products

Butter

Deep fried food

Margarine

Shortening

Lard

Pastries

Processed foods

Fried or processed foods

Shortening

Pastries

Donuts

Baking mixes

Vegetable oils (olive, canola, sunflower, sesame, peanut)

Avocados

Natural peanut butter

Many nuts/seeds

Vegetable oils (corn, safflower, soybean)

Fatty fish (salmon, trout, mackerel)

Some nuts/seeds

*Note: Above lists are intended to provide examples and are not all-inclusive.


CHILD-2 (STEP 2 DIET)


If elevated levels of LDL-C and non-HDL-C persist after adequate compliance to the CHILD-1 diet for 3 months, transition to the CHILD-2 diet should be recommended (Table 3). Parameters of the CHILD-2 diet include further restriction of saturated fat intake to less than 7% of daily calories and a decrease in daily cholesterol intake to 200mg or less. This diet may be further modified, if necessary, to more specifically address elevated LDL-C, non-HDL-C, and elevated triglycerides (TG).  


TABLE 3. EVIDENCE-BASED NUTRITION RECOMMENDATIONS FOR PEDIATRIC DYSLIPIDEMIA


Nutrition Recommendations for LDL-Lowering

Indication:  Children and adolescents with familial hypercholesterolemia or persistent hypercholesterolemia.


Refer to a registered dietitian nutritionist for family-centered medical nutrition therapy.

Dietary fat:

Total fat 25-30% of daily kcal intake

Saturated fat ≤7% daily kcal intake

Avoid trans fats

Monounsaturated fat ~10% daily kcal intake

Cholesterol <200mg/day

Familial hypercholesterolemia patients may benefit from plant sterol and stanol esters up to 2g/day as a replacement for usual dietary fat sources.

Water-soluble fiber psyllium can be added to the CHILD-2 diet at a dose of 6g/day for children 2-12 years of age, and 12g/day for children ≥12 years of age.

Encourage at least 1 hour of moderate-to-vigorous physical activity daily while limiting sedentary screen time to <2 hours/day.


Nutrition Recommendations for TG-Lowering

Indication:  Children and adolescents with hypertriglyceridemia or persistent hypertriglyceridemia.


Refer to a registered dietitian nutritionist for family-centered medical nutrition therapy.

Dietary fat:

Total fat 25-30% of daily kcal intake

Saturated fat ≤7% daily kcal intake

Avoid trans fats

Monounsaturated fat ~10% daily kcal intake

Cholesterol <200mg/day

Reduce sugar intake.

Replace simple carbohydrates with complex carbohydrates.

Avoid sugar-sweetened beverages.

Increase dietary fish to increase omega-3 fatty acid intake.

Omega-3 fatty acid supplementation can be added at 1-4g/day for TG >200-499mg/dL.


The CHILD-2 LDL lowering diet places additional emphasis on dietary fiber intake and use of plant sterol/stanol esters, as appropriate. Dietary fiber, specifically soluble fiber intake, may help further reduce LDL-C. Supplemental water-soluble psyllium fiber may be added, though efficacy of supplementation varies in published trials. In children and adolescents with familial hypercholesterolemia, plant sterol and stanol esters may be safely incorporated at 2g/day to enhance LDL-C lowering effects (5). (See the nutrition supplementation section of this chapter for more information on supplemental therapies).


The CHILD-2 TG-lowering diet may be utilized in children and adolescents with moderate hypertriglyceridemia.  Dietary recommendations should encourage choosing complex carbohydrates, limiting simple carbohydrates, and restricting dietary fat intake. Sugar sweetened beverages should be discouraged. If overweight or obese, a gradual weight loss should be encouraged (5). Omega-3 supplementation may be beneficial in those with TG >200-499 mg/dL. (See Omega-3 supplementation section below).


In children and adolescents with severe hypertriglyceridemia or familial hypertriglyceridemia, the CHILD-2 TG-lowering diet, as well as restriction as low as 10-15% daily calories from fat, may be helpful in lowering TG and avoiding pancreatitis. It is imperative these children and adolescents be closely followed by a registered dietitian nutritionist to ensure all essential fatty acid and micronutrient needs are met, as well as maintaining a proper balance of calories from carbohydrates, fat, and protein (10,11).


NUTRITION SUPPLEMENTATION


Plant Sterol and Stanol Esters


Children and adolescents who have been unable to achieve lipid-lowering goals with dietary modification alone may utilize plant sterol and stanol esters for further LDL-C lowering. Recommended dose for children 2 years of age and older is 2g/day as a replacement for usual fat sources (5). As long-term studies on effectiveness have not been completed, plant sterol and stanol supplementation should be reserved for children and adolescents who do not achieve the desired LDL-C and non-HDL-C goals with diet modification alone (1). Therapeutic doses of plant sterol and stanol esters can be achieved through fortified foods or nutrition supplements, and appear to have increased efficacy when administered throughout the day rather than in a single dose (12,13).


Omega-3-Fatty Acids


In children and adolescents with fasting triglyceride levels >200-499 mg/dL, a trial of CHILD-2 TG-lowering diet and increased intake of fatty fish or omega-3 fatty acid supplementation may be beneficial (3). When increasing fatty fish in the diet, seafood choices high in EPA and DHA, but low in mercury are recommended (5). While research into the effects of fish oil supplementation is limited in the pediatric population, no safety concerns have been identified as yet. In adults, omega-3 supplementation has been shown to lower triglycerides by 30-40%, though some may cause an increase in LDL-C (14-18). Therapeutic doses of omega-3 fish oils are 1-4 g/day of the active ingredients (EPA+DHA).  If fish-oil supplementation is utilized, prescription formulas are recommended rather than over-the-counter fish-oil capsules, which are not FDA regulated (3,18).


Psyllium Fiber


This water-soluble fiber can be added to the CHILD-2 LDL-lowering diet to aide in lowering total and LDL-C cholesterol. While evidence for efficacy of psyllium fiber is insufficient for specific recommendation, many studies show significant reductions in total and LDL cholesterol when psyllium fiber is added to a CHILD-2 LDL-lowering diet.  Recommended doses are 6 g/day for children 2-12 years; 12 g/day for children 12 years and older. (5) Soluble fiber has been shown to be well-tolerated and safe for hypercholesterolemic children and adolescents 2 years of age and older (20-22).


AGE-BASED NUTRITION RECOMMENDATIONS


Birth to 12 Months


Fat plays a pivotal role in brain development, and should not be restricted in children <12 months, unless medically necessary.  If implementing, it is imperative that a knowledgeable and experienced dietitian nutritionist be involved in the child's care.  The American Academy of Pediatrics (AAP), Surgeon General’s Office, and World Health Organization (WHO) recommend that all babies be exclusively breastfed until 6 months of age (6). Breastfeeding should be continued until at least 12 months of age, with gradual addition of supplemental foods to the child’s diet. Iron-fortified formula may be utilized until 12 months of age if breastfeeding is reduced or discontinued. No sugar-sweetened beverages should be offered, and 100% fruit juice should be limited to 4 oz or less daily.  While extensive diet modification is not recommended at this age, previous studies have shown repeated dietary counseling, beginning as early as 7 months of age, decreases lipid risk factors of premature coronary heart disease (CHD) in children (23).


12-24 Months


The 2020-2025 Dietary Guidelines for Americans recommends a diet consisting of 30-40% calories from fat for children aged 1-3 years (7). Toddlers with family history of heart disease and hypercholesterolemia may transition to milk with reduced fat at 12 months of age to decrease saturated fat intake. This should be done only if the overall diet consistently supplies 30% daily calories from fat. Diets with less than 30% daily calories from fat should only be utilized when medically indicated and closely followed by a registered dietitian nutritionist. Nutrient-rich table foods should be offered, while avoiding concentrated sweets and trans fats (5).  Sugar-sweetened beverages should be avoided, while limiting 100% fruit juice consumption to 4 oz or less daily and encouraging water intake (5).


2-10 Years


At this age, focus should be placed on introducing a wide variety of vegetables, fruits, lean proteins, and complex carbohydrates.  Dietary recommendations include a total fat intake of 25-30% of daily calorie intake, limiting saturated fats, and avoiding trans fats (5). As milk is a main source of saturated fat at this age, fat-free unflavored milk is recommended.  Intake of sugar-sweetened beverages should be limited or avoided, limiting 100% fruit juice to 4 oz or less daily, and encouraging water intake.  For children with persistent elevations in LDL-C, the CHILD-2 diet described earlier in this chapter may be utilized (5).


This age presents unique challenges due to selective eating habits and increased consumption of foods prepared at day care facilities and school. The AHA notes that, at this age, regular breakfast consumption begins to decrease, while there is often an increase in foods prepared away from home, increased percent daily calories from snack foods, and an increased consumption of foods that are fried and of low-nutrient value (24). Families should be counseled on choosing nutritionally-dense foods, and encouraging dietary fiber intake (age + 5g daily). Physical activity with limited sedentary time should be encouraged, with a goal of at least 1 hour of moderate-to-vigorous activity daily for children 5 years and older (7).


10-21 Years


Recommendations for this population are similar to children 2-10 years of age.  Dietary recommendations remain the same with 25-30% of daily calorie intake from fat, limiting saturated fat to 8-10% of daily calories, and avoiding trans fats. The CHILD-2 diet can be utilized for children and adolescents with persistent elevations in LDL-C and TG (5). Intake of fat-free unflavored milk and water should be encouraged, while limiting or avoiding sugar-sweetened beverages. 100% fruit juice should also be limited to 4 oz or less daily. Foods high in dietary fiber are encouraged with a goal of 14g fiber per 1000 calories (7).


At this age, many children consume meals or snacks at school, after-school programs, restaurants, convenience stores, or vending machines. There is often an increase in choosing foods at home that require minimum preparation. Identifying a child’s main sources of nourishment is helpful in the counseling process (24). Family-centered education is helpful as parental role modeling is important to establish healthy eating at younger ages. As children and adolescents mature, education may be focused on maintaining healthy habits, such as eating breakfast daily, choosing a healthy lunch, and limiting fast food intake (5). Special considerations should also be made regarding the approach to discussions on weight and disordered eating patterns (3).


MONITORING AND EVALUATION


After the initial visit and nutritional counseling, it is recommended that children, adolescents, and their parent/caregiver continue to meet frequently with specially trained cardiovascular disease risk reduction healthcare professionals, including a lipid specialist and registered dietitian nutritionist to monitor the child's progress and efficacy of the lipid-lowering diet. Growth charts and updated laboratory studies should be reviewed with each visit to guide subsequent recommendations for diet modification or supplementation. In children and adolescents who are overweight or obese, moderate, gradual weight reduction has been shown to improve dyslipidemia and decrease insulin resistance. Regular follow-up visits, tracking growth, and evaluating the child’s and family’s readiness to change can help guide the dietitian nutritionist in providing appropriate and timely counseling. A family-centered approach, transitioning to a patient-centered focus in late adolescence, helps ensure the recommended therapeutic lifestyle changes are followed throughout life stages (3).


REFERENCES


  1. Jacobson TA, Maki KC, Orringer CE et al. National Lipid Association Recommendations for patient-centered management of dyslipidemia: Part 2. J Clin Lipidol. 2015; 9:S1-S122.
  2. Stone NJ, Robinson JG, Lichtenstein AH, et al. 2013 ACC/AHA guideline on the treatment of blood cholesterol to reduce atherosclerotic cardiovascular risk in adults: a report of the American College of Cardiology/American Heart Association Task Force on Practice Guidelines. J Am Coll Cardiol 2014; 63(25 Pt B):2889-934.
  3. Williams L, Baker-Smith CM, Bolick J, et al. Nutrition interventions for youth with dyslipidemia: a National Lipid Association clinical perspective. J Clin Lipidol. 2022;16(6):776-796.
  4. Arnett DK, Blumenthal RS, Albert MA, et al. 2019 ACC/AHA guideline on the primary prevention of cardiovascular disease: a report of the American College of Cardiology/American Heart Association Task Force on Clinical Practice Guidelines. Circulation. 209;140:e596-e646.
  5. Expert Panel on Integrated Guidelines for Cardiovascular Health and Risk Reduction in Children and Adolescents: National Heart, Lung, and Blood Institute. Expert Panel on Integrated Guidelines for Cardiovascular Health and Risk Reduction in Children and Adolescents: Summary Report. Pediatrics, 2011; 128(5): e1311-19.
  6. Griggs SS, Schille A. Lipid Disorders. Manual of Pediatric Nutrition. 5th Connecticut: People’s Medical Publishing House – USA; 2014.
  7. S. Department of Health and Human Services and U.S. Department of Agriculture. 2020-2025 Dietary Guidelines for Americans. 9th Edition. December 2020. Available at DietaryGuidelines.gov.
  8. American Academy of Pediatrics Committee on Nutrition. Pediatric Nutrition Handbook. 6th USA: American Academy of Pediatrics; 2009: 719-32.
  9. Yu-Poth S, Zhao G, Etherton T, et al. Effects of the National Cholesterol Education Program’s Step I and Step II dietary intervention programs on cardiovascular disease risk factors: a meta-analysis. Am J Clin Nutr 1999; 69: 632-46.
  10. Williams L, Wilson DP. Editorial Commentary: Dietary Management of Familial Chylomicronemia Syndrome. J Clin Lipidol 2016.
  11. Williams L, Rhodes K, Karmally W, et al. Familial Chylomicronemia Syndrome: Bringing to Life Dietary Recommendations Throughout the Lifespan. J Clin Lipidol 2018; 12: 908-919.
  12. Ras RT, Geleijnse JM, Trautwein EA. LDL-cholesterol-lowering effect of plant sterols and stanols across different dose ranges: a meta-analysis of randomized controlled studies. Br J Nutr. 2014;112:214-219.
  13. Demonty I, Ras RD, van der Knaap HCM, et al. Continuous dose-response relationship of the LDL-cholesterol-lowering effect of phytosterol intake. J Nutr. 2009;139:271-284.
  14. Kris-Etherton PM, Richter CK, Bowen KJ, et al. Recent clinical trials shed new light on the cardiovascular benefits of omega-3 fatty acids. Methodist Debakey Cardiovascular J. 2019;15(3):171-178.
  15. Miller ML, Wright CC, Browne B. Lipid-lowering medications for children and adolescents. J Clin Lipidol. 2015;9:S67-S76.
  16. Valaiyapathi B, Sunil B, Ashraf AP. Approach to hypertriglyceridemia in the pediatric population. Pediatr Rev. 2017;38:424-434.
  17. Chahal N, Manlhiot C, Wong H, et al. Effectiveness of omega-3 polysaturated fatty acids (fish oil) supplementation for treating hypertriglyceridemia in children and adolescents. Clin Pediatr. 2014;53(7):645-651.
  18. Fialkow J. Omega-3 fatty acid formulations in cardiovascular disease: dietary supplements are not substitutes for prescription products. Am J Cardiovasc Drugs. 2016;16:229-239.
  19. McKenney JM, Jenks BH, Shneyvas E, et al. A Softgel Dietary Supplement Containing Esterified Plant Sterols and Stanols Improves the Blood Lipid Profile of Adults with Primary Hypercholesterolemia: A Randomized, Double-Blind, Placebo-Controlled Replication Study. J Acad Nutr Diet 2014; 114(2):244-9.
  20. Ribas SA, Cunha DB, Sichieri R, et al. Effects of Psyllium on LDL-cholesterol Concentrations in Brazilian Children and Adolescents: A Randomized, Placebo-Controlled, Parallel Clinical Trial. Br J Nutr 2014; Nov 13: 1-8.
  21. Moreyra AE, Wilson AC, Koraym A. Effect of Combining Psyllium Fiber with Simvastatin in Lowering Cholesterol. Arch Intern Med 2005; 165(10): 1161-6.
  22. Wei ZH, Wang H, Chen XY, et al. Time- and Dose-dependent Effect of Psyllium on Serum Lipids in Mild-to-moderate Hypercholesterolemia: A Meta-analysis of Controlled Clinical Trials. Eur J Clin Nutr 2009; 63(7): 821-7.
  23. Kaitosaari T, Ronnermaa T, Raitakari O, et al. Effect of 7-Year Infancy-Onset Dietary Intervention on Serum Lipoproteins and Lipoprotein Subclasses in Healthy Children in the Prospective, Randomized Special Turku Coronary Risk Factor Intervention Project for Children (STRIP) Study. Circulation 2003; 108: 672-7.
  24. Gidding SS, Dennison BA, Birch LL, et al. Dietary Recommendations for Children and Adolescents: A Guide for Practitioners. Circulation 2005;112: 2061-75.

Genetics and Dyslipidemia

ABSTRACT


Pediatric primary or monogenic dyslipidemias are a heterogeneous group of disorders, characterized by severe elevation of cholesterol, triglycerides, or rarely a combination of the two. Monogenic hypercholesterolemias have elevated low-density lipoprotein-cholesterol (LDL-C) levels and very high risk of premature atherosclerotic disease. They are caused by mutations in genes involved in the receptor-mediated uptake of LDL by the LDL receptor (LDLR) in hepatocytes. Autosomal dominant familial hypercholesterolemia results from mutations in LDLR, apolipoprotein B-100 (APOB), or proprotein convertase subtilisin-like kexin type 9 (PCSK9). Autosomal recessive hypercholesterolemia is caused by mutations in the LDLR adaptor protein 1 (LDLRAP1) gene. Type 1 hyperlipoproteinemia (Familial Chylomicronemia Syndrome) have severe fasting hypertriglyceridemia secondary to accumulation of triglyceride (TG)-rich lipoproteins, especially chylomicrons. It results from muta­tions in one or more genes that compromise chylo­micron lipolysis and clearance. It has autosomal recessive inheritance caused by mutations in lipoprotein lipase (LPL), Apolipoprotein C-II(APOCII), Lipase maturation factor 1(LMF-1), Apolipoprotein A-V(APOAV), Glycosylphosphatidylinositolanchored high-density lipoprotein-binding protein 1(GPIHBP1). Familial combined hypercholesterolemia is a complex genetic disease and primarily a disorder of adults. There is strong evidence demonstrating a log-linear relationship between total cholesterol levels and coronary heart disease risk. Severe hypertriglyceridemia has an increased risk of acute pancreatitis. Universal lipid screening with measurement of non-fasting non-HDL cholesterol should be performed in all children ages 9 –11 years and 17–21 years. Advanced genetic testing and counseling play very important role in patients with genetic dyslipidemia.


INTRODUCTION


Dyslipidemias are heterogeneous group of disorders characterized by abnormal levels of circulating lipids and lipoproteins.  These abnormalities include elevations in cholesterol (hypercholesterolemia, Fredrickson Class IIa), triglycerides (hypertriglyceridemia, Frederickson Classes I, IV and V), or a combination of the two (Fredrickson Classes III or IIb). Genetic disorders of high-density lipoprotein or hypocholesterolemias are extremely rare and discussed in other Endotext chapters.


The etiology of genetic disorders are very complex, and can encompass from rare monogenic disorders due to single gene defects to complex polygenic basis (1). Meta-analysis of genome-wide association study identified 95 loci associated with abnormal total cholesterol (TC), low-density lipoprotein cholesterol (LDL-C), high-density lipoprotein cholesterol (HDL-C), and triglycerides (TG) (2). Recent studies have shown that most patients with HTG have a complex genetic etiology consisting of multiple genetic variants ranging in both frequency and effect. Patients with TG concentration of 200-1000 mgl/dL typically have polygenic or multigenic HTG. The genome-wide association (GWA) studies re-discovered associations known from prior genetic studies: that of HDL-C with CETP, and of LDL-C with APOE, and eventually identified more than 30 chromosomal loci with common variants associated with lipid levels.  Thus polygenic TG results from complex interplay of rare heterozygous variants with relatively large effects in APOA5, GCKR, LPL, APOB, APOE, CREBH, GPIHBP1 and rare variants in more than 30 genes together with secondary factors (3).  Polygenic risk scores use weighted summations of single nucleotide variants and are proposed as tools to improve the prediction of cardiovascular disease events independent of LDL-C, and their usefulness in clinical applications requires further studies (4).


Secondary dyslipidemias are multifactorial – combining underlying genetic predispositions with disease states such as diabetes, thyroid disease, or drug-related changes in lipid metabolism. Only monogenic disorders are discussed in this chapter.


MONOGENIC HYPERCHOLESTEROLEMIA


Monogenic hypercholesterolemias are a group of single gene defects with Mendelian transmission  characterized by elevated low-density lipoprotein-cholesterol (LDL-C) levels and very high risk of premature atherosclerotic disease (5)(Table 1).


Table 1. Monogenic Causes of Hypercholesterolemia (5)

Inheritance

Disease

Gene

Prevalence

Mechanism

Autosomal Dominant


Familial Hypercholesterolemia (FH)

LDLR (6,7)

1 in 270 (8)(heterozygous)

1 in 1.6 to 3 X 10⁵ (9-12) (homozygous)

↓LDL Clearance


Familial defective apo B-100

APOB (13)

1:1000 (10)(heterozygous)

1 in 4 X 10⁶ (homozygous)

↓LDL Clearance


FH3

PCSK9(14)

<1 in 10,000

↑Degradation of LDLR

Autosomal Recessive


Autosomal recessive hypercholesterolemia

LDLRAP1 (15)

<1 in 1 X 10⁶ (16)

↓LDL Clearance

Sitosterolemia

ABCG5/ABCG8 (17)

< 1 in 5x 10⁶

↓cholesterol excretion

↓LDL Clearance

Cerebrotendinous xanthomatosis

CYP27A1

3-5 in 1X10⁵

↓ conversion of cholesterol to chenodeoxycholic acid (CDCA) and cholic acid

Lysosomal Acid Lipase Deficiency

LIPA (18)

1 in 4 to 30 X 104

↓ hydrolysis of cholesterol esters and triglycerides


Autosomal Dominant Hypercholesterolemia


Autosomal dominant hypercholesterolemia (ADH) is characterized by severe life-long elevations in low-density lipoprotein-cholesterol (LDL-C) with a concomitant 10-20 fold-increased risk of premature coronary heart disease (CHD) compared with the general population (11). Autosomal dominant hypercholesterolemia is primarily caused by mutations in genes involved in the receptor-mediated uptake of LDL by the LDL receptor (LDLR) in hepatocytes (Figure 2).  


Thus far, three genes have been found to cause the disorder: LDLR (Online Mendelian Inheritance in Man [OMIM] # 143890, referred to as having familial hypercholesterolemia [FH]), apolipoprotein B-100 (APOB, OMIM # 107730, referred to as familial defective APOB), and proprotein convertase subtilisin-like kexin type 9 (PCSK9, OMIM # 603776, referred to as FH3) (5). In ADH cohorts, mutation detection rates vary - as high as 90% in ethnically homogenous populations (19-23) and as low as 40% in a multiethnic US cohort (24).


FAMILIAL HYPERCHOLESTEROLEMIA 


Brown and Goldstein (6) first demonstrated that autosomal dominant hypercholesterolemia is due to dysfunctional LDLR. Pathogenic changes in LDLR result in impaired uptake and processing of LDL particles, which leads to decreased LDL clearance and elevated serum cholesterol levels. Over 1700 mutations in LDLR have been described thus far, and roughly about 1000 are likely to be pathogenic (7,25-28). Mutations can be predicted to be pathogenic using scoring tools such as Sorting Intolerant from Tolerant (SIFT) (29), Polymorphism Phenotyping v2 (PolyPhen-2) (30), or Combined Annotation Dependent Depletion (CADD) (31). Guo et al (32) recently developed a prediction model using structural modeling and bioinformatics algorithm called “Structure-based Functional Impact Prediction for Mutation Identification” (SFIP-MutID) for FH with LDLR single missense mutations. Among autosomal dominant hypercholesterolemia patients with detectable mutations, LDLR mutations represent ~90% of cases, and recent large-scale exome sequencing studies have identified LDLR mutations as the most common genetic defect among all individuals with premature CHD (33).


FH can occur as either homozygous (or compound heterozygous) or heterozygous, with a gene dosage effect. Homozygous FH is rare with a frequency of 1 in 1,000,000, whereas heterozygous FH affects 1 in 250-500. Higher frequencies have been reported in homogenous ethnicities such as the Danish, French Canadians, South African Afrikaners, and Christian Lebanese (34,35). As expected, homozygotes are more severely affected than heterozygotes, with LDL-C that are typically > 500 mg/dL (36) (Figure 1). Heterozygotes have LDL-C between 190 and 500 mg/dL.  Recent literature has suggested that FH is more common and complex than previously thought and many patients have polygenic susceptibility rather than a monogenic cause (1).

Figure 1. Phenotypic Spectrum of Familial Hypercholesterolemia (FH). Clinical diagnosis of FH can be variable due to different underlying molecular mutations and additional genetic characteristics. LDL, low-density lipoprotein; APO, apolipoprotein B; PCSK9, pro-protein convertase subtilisin/kexin type 9; Lp(a), lipoprotein a; SNP = single nucleotide polymorphism. (Adapted from Strum, A.C., et al., Clinical Genetic Testing for Familial Hypercholesterolemia: JACC Scientific Expert Panel. J Am Coll Cardiol. 2018; 72(6):662-680 (9)).


FAMILIAL DEFECTIVE APO B-100 (FDB)


APOB-100 is the major apolipoprotein on LDL particles and helps the LDL-receptor bind LDL. FDB was first described phenotypically by Innerarity et al. in 1987 (37) after investigation by Vega and Grundy suggested that reduced binding of LDL to LDLR played a causative role in hypercholesterolemia. Mutations can occur in the  ApoB domain involved in the binding of APOB to the LDLR, reducing clearance of LDL from plasma and causing hypercholesterolemia (13). Mutations in ApoB account for approximately 5% of the FH cases (27). Approximately 0.1% of the Northern Europeans and US Caucasians are known to carry p.Arg3500Gln variant in ApoB, whereas p.Arg3500Trp variant in ApoB is seen among East Asians (38-40). The p.Arg3500Gln variant raises plasma LDL-C by approximately 60 to 70 mg/dL and thus have a milder effect on plasma LDL-c than mutations in LDLR or PCSK9, but has been associated with increased coronary artery calcification, and earlier coronary artery disease, likely due to increase in small dense LDL particles (41).


PRO-PROTEIN CONVERTASE SUBTILISIN/KEXIN TYPE 9 (PCSK9)


PCSK9 was discovered in 2003 as a serine protease that degrades hepatic LDLRs in the endosomes thereby reducing receptor availability. PCSK9 gain-of-function (GOF) mutations cause increased LDRr degradation and reduced recycling to the cell surface, causing reduced LDL uptake and an increase in LDL-C concentration (42). Interestingly, functional studies show that different variants have different mechanisms to achieve the enhanced degradation of LDLr (43-46).  Mutations upregulating activation of the PCSK9 gene were discovered in three French families with autosomal dominant hypercholesterolemia but no mutations in LDLR or ApoB (47). PCSK9 GOF mutations represent less than 1% of cases, with approximately 30 variants described to date (48). Currently there are two FDA approved human monoclonal antibodies to PCSK9:  alirocumab and evolocumab. They were approved in 2015 and work by neutralizing PCSK9, inhibiting the interaction between PCSK9 and the LDLR, leading to an increase in the number of LDL receptors and, finally, enhancing uptake of LDL particles.


Autosomal Recessive Hypercholesterolemia (ARH)


ARH is caused by bi-allelic mutations in the LDLR adaptor protein 1 (LDLRAP1) gene. LDLR adaptor protein (LDLRAP1 or ARH) promotes the clustering of LDLRs into the clathrin-coated pits on the basolateral surface of hepatocytes by coupling the cytoplasmic tail of LDLR to structural components of the clathrin-coated pit and thus is essential for LDLR-mediated endocytosis. Inactivating mutations in LDLRAP1 lead to retention of LDLRs on the apical surface, thus severely reducing LDL uptake (15).


Sitosterolemia, Lysosomal Acid Lipase Deficiency, and Cerebrotendinous Xanthomatosis are discussed in other Endotext chapters.


Clinical Features


FH should be suspected in any child with elevated LDL-C along with family history of elevated LDL-C, tendon xanthomas, premature CHD, or sudden premature cardiac death. Cholesterol esters deposit in peripheral tissues like Achilles and extensor tendons giving rise to tendon xanthomas and their accumulation in arterial walls lead to development of plaques and atherosclerosis.  Xanthomas are rarely seen in children and adolescents. However atherosclerosis is present from early childhood, and children with FH have endothelial dysfunction and increased carotid intima-media thickness (49).


There are three diagnostic tools available for FH (Figure 2-4):


  1. The US MedPed Program diagnostic criteria (50): It utilizes total cholesterol levels specific to an individual’s age and family history. The levels were derived from mathematical modeling using published cholesterol levels for FH individuals in the United States and Japan (Figure 2).
  2. The Simon Broome Register Group criteria (51): It utilizes cholesterol levels, clinical characteristics, molecular diagnosis, and family history (Figure 3).
  3. The Dutch Lipid Clinic Network criteria (52): It utilizes family history of hyperlipidemia or heart disease, clinical characteristics such as tendinous xanthomata, elevated LDL cholesterol, and/or an identified mutation (Figure 4).

Figure 2. US MedPed Program Diagnostic Criteria.

Figure 3. The Simon Broome Register Criteria.   

Figure 4. The Dutch Lipid Clinic Network Criteria.


LIPOPROTEIN(a)


Lipoprotein (a) [Lp(a)] consists of an LDL particle and apolipoprotein(a) [apo(a)] and has been shown to be associated with increased risk of atherosclerotic cardiovascular disease including CHD, myocardial infarction and ischemic strokes. An Lp(a) level >100 nmol/L) in Caucasians and >150 nmol/L in African American is considered a risk enhancing factor. National Lipid Association recommends measurement of Lp(a) in youth (< 20 years) with FH; family history of first-degree relatives with premature ASCVD; unknown cause of ischemic stroke; or a parent or sibling with elevated Lp(a) (53). Lp(a) is discussed in another Endotext chapter.


FAMILIAL CHYLOMICRONEMIA SYNDROME (FCS) (TYPE 1 HYPERLIPOPROTEINEMIA)


Type 1 hyperlipoproteinemia (T1HLP, OMIM# 238600) or familial chylomicronemia syndrome is characterized by severe fasting hypertriglyceridemia secondary to accumulation of triglyceride (TG)-rich lipoproteins, especially chylomicrons. It results from muta­tions in one or more genes that compromise chylo­micron lipolysis and clearance; mostly due to biallelic loss of function mutations in lipoprotein lipase (LPL) gene (3,54-56), or rarely due to mutations in apolipoprotein CII (APOC2), lipase maturation factor 1 (LMF1), glycosyl-phosphatidylinositol anchored high-density lipoprotein-binding protein 1 (GPIHBP1), and apolipoprotein AV (APOA5) (57,58). These disorders typi­cally show autosomal recessive inheritance with published esti­mates of prevalence of ~1:1,000,000. A recent study estimates that population prevalence could be as high as 1 in 300,000 (59).


Genetics


Table 2. Genetic Basis of Familial Chylomicronemia Syndrome

Gene

Homozygote prevalence

Gene product function

Age of onset

LPL

1 in 1 million

(95% cases)

Hydrolysis of TG, peripheral uptake of FFA

Infancy or childhood

APOC2

20 families

Required cofactor of LPL

Childhood or adolescence

LMF1

2 families

Chaperone molecule required for proper LPL folding and/or expression

Late adulthood

APOA5

5 families

Enhancer of LPL activity

Late adulthood

GPIHBP1

15 families

Anchors LPL on capillary endothelium. Stabilizes binding of chylomicrons near LPL, supports lipolysis

Infancy or childhood


Lipoprotein Lipase (LPL) Deficiency


FCS most commonly results from lipolytic defects due to deficiency of LPL. LPL is produced primarily by adipocytes and myocytes and binds to heparan sulfate, located at the heparin-binding site on the surface of capillary endothelial cells, allowing LPL to extend into the plasma and participate in the hydrolysis of TG carried in chylomicrons and very-low-density lipoproteins. Bi-allelic LPL mutations account for about 95% cases of FCS. More than 114 mutations in LPL have been described, and almost all of these have been shown to reduce or eliminate LPL activity in the homozygous state, preventing hydrolysis, and resulting in accumulation of triglyceride-rich lipoproteins, primarily chylomicrons (3,60).


Apolipoprotein C-II (APOC2) Mutations


APOC2 encodes for apolipoprotein (apo) C-II which is found on high-density lipoproteins (HDL), chylomicrons, and very-low-density lipoproteins, and acts as a key cofactor and an activator for LPL (61,62). Twenty families with disease causing mutations in ApoC2 have been reported in the literature.


Lipase Maturation Factor 1 (LMF1) Mutations


LMF1 serves as a chaperone in the endoplasmic reticulum and is required for the posttranslational activation of LPL, thus playing a regulatory role in lipase activation and lipid metabolism (63). Two families with disease causing mutations in LMF1 have been reported in literature


Apolipoprotein A-V (APOAV) Mutation


Apo A-V is believed to stabilize the lipoprotein–enzyme complex and to enhance lipolysis; thus, when Apo A‑V is defective or absent, the efficiency of LPL-mediated lipolysis is decreased (64,65). Five patients with disease causing mutations in APOAV have been reported in literature.


Glycosylphosphatidylinositol-Anchored High-Density Lipoprotein-Binding Protein 1 (GPIHBP1) Mutation


GPIHBP1 is a glycosylphosphatidylinositol-anchored protein on capillary endothelial cells, which transports LPL into capillaries (66).  GPIHBP1 directs the transendothelial transport of LPL, helps anchor chylomicrons to the endothelial surface, and enhances lipolysis (67). Mutations in mutations in GPIHBP1 have been reported in 15 families.


Clinical Features


FCS usually presents by adolescence although cases are often unrecognized until adulthood (60). Often, patients don’t get diagnosed until after developing pancreatitis (60,68), at which time triglycerides are noted to be severely elevated (at least > 1000 mg/dL). Other clinical features include eruptive or tuberous xanthomas, recurrent pancreatitis, lipemia retinalis, and hepatosplenomegaly. Some rare cases may present with failure to thrive, intestinal bleeding, anemia, or encephalopathy (69-71). Unique clinical features like neonatal transient obstructive jaundice due to xanthomas in pancreatic head region and asymptomatic renal xanthomas have been recently described (72,73).


Several physical exam findings characterize FCS. On fundoscopic exam, a pale pink appearance of vessels can be noted, referred to as lipemia retinalis. Lipemia retinalis occurs due to light scattering of large chylomicron particles. Eruptive xanthomas - crops of discrete yellow papules on an erythematous base – can manifest on the back, buttocks, and extensor aspects of elbows and knees. The eruptive xanthomas clear as triglycerides decrease.   Hepatosplenomegaly occurs due to triglyceride accumulation in the liver and spleen.


Severe hypertriglyceridemia is an increased risk of acute pancreatitis, a serious condition often complicated by the systemic inflammatory response syndrome, multiorgan failure, pancreatic necrosis, and mortality rates as high as 20%. Even when not having pancreatitis episodes, some FCS patients suffer from bouts of abdominal pain.


Diagnostic Approach


FCS should be suspected in patients with severe hypertriglyceridemia (> 1000 mg/dL) without any secondary cause (e.g., uncontrolled diabetes, alcohol use, etc.).  Gene sequencing to look for homozygous or compound heterozygous mutations in known genes such as LPL, APOC2, APOA5, LMF1 and GPIHBP1 may be performed. Although not always clinically available, several research labs can do sequencing or these genes can be included as part of targeted next-generation sequencing diagnostic panel for monogenic dyslipidemias. A molecular diagnosis aids in the early identification of at-risk family members. It might also help to establish candidacy for emerging therapies that target primary LPL deficiency, especially for patients who present at a young age. Treatment of these patients poses a significant challenge, as the current medications for hypertriglyceridemia such as fibrates, niacin, and omega-3 fatty acids are ineffective (55,74). The only effective therapy is extremely low-fat diet (55,75).  Recent clinical trial of the gastric and pancreatic lipase inhibitor, orlistat, reduced serum triglycerides by greater than 50% in two patients with FCS due to GPIHBP1 mutations and was shown to be safe and highly efficacious in lowering serum triglycerides in children with FCS (76). Alipogene tiparvovec (Glybera®; AMT-011, AAV1-LPL(S447X)) is an adeno-associated virus serotype 1-based gene therapy, which was approved in Europe for adult patients with familial LPL deficiency in 2012 but has been subsequently withdrawn from the market in April 2017 (77). Volanesorsen, an antisense oligonucleotide against APOC3 mRNA, is approved to treat individuals with familial chylomicronemia syndrome in Europe but not the US.  In a pooled analysis of four studies comparing 139 patients treated with volanesorsen a significant reduction in triglycerides was observed compared to placebo [TG level (MD: -73.9%; 95%CI: -93.5%, -54.2; p < .001) (77A).   


FAMILIAL COMBINED HYPERLIPIDEMIA (FCHL)


FCHL is the most common inherited form on dyslipidemia. Its prevalence is estimated to be about 1 in 100 and thus is of importance for cardiovascular metabolic health of the population (78). A nomogram was created in 2004 to calculate probability of being affected by FCHL using three variables: age and gender adjusted triglyceride, total cholesterol, and absolute apoB levels. Points are calculated on point scale, translated into probabilities. The individual is considered as affected by FCHL if probability is at least 60%, in the setting of one other family member with FCH phenotype, and at least one individual in the family with premature cardiovascular disease (CVD) (79) . No single gene has yet been identified as a causative factor. It is a complex genetic disease and the features are determined by interaction of multiple FCHL susceptibility genes with environmental factors. The genes most frequently reported to be associated with FCHL are functionally related to plasma lipid metabolism and clearance, such as USF1, HL, PPARG, TNFRSF1B, LPL, LIPC, APOA1/CIII/AIV/AV and APOE (80). Overproduction of VLDL particles and hepatic fat accumulation are both central aspects of FCHL. Increased free fatty acid flux (from dysfunctional adipose tissue) towards the liver, increased hepatic de novo lipogenesis, and impaired β oxidation results in hepatic fat accumulation (80). FCHL is typically a diagnosis of adults. Its diagnosis is very complex in children due to lack of long-term data linking lipid values measured in children to the expression of the disease in the adult state or in older people. Hyperapo B in children may be a precursor of other lipid abnormalities, and thus it is suggested as a good marker of early diagnosis of FCH (81).


FAMILIAL HYPERTRIGLYCERIDEMIA (FHTG)


Similar to FCHL, FHTG is a complex genetic disease and the features are determined by the interaction of multiple susceptibility genes that increase triglyceride levels with environmental factors. Triglyceride levels are between 250-1000 mg/dL and LDL-c and apoB levels are not elevated. It is often accompanied by obesity and insulin resistance.   


FAMILIAL DYSBETALIPOPROTEINEMIA


Dysbetalipoproteinemia is characterized by accumulation of remnant particles due to homozygous apoE2 genotype. The estimated prevalence is from 0.12% to 0.40% (82).  A secondary insult such as insulin resistance, obesity, diabetes, hypothyroidism, or estrogen use decreases remnant clearance, increasing VLDL production. Patients have elevated total cholesterol (250-500 mg/dL) and triglyceride levels (250- 600 mg/dL), often with decreased HDL-C and LDL-C. This disorder is suspected when TG/apoB ratio is <10.0 and the diagnosis can be confirmed by VLDL-C/ plasma TG >0.69 plus an apoE2/E2 genotype (83).


LIPODYSTROPHY


Generalized and partial lipodystrophy syndromes are frequently associated with hypertriglyceridemia from late childhood and are discussed in details in another Endotext chapter (84,85).


SCREENING


There is strong evidence demonstrating a log-linear relationship between total cholesterol levels and coronary heart disease (CHD) risk. Thus the National Heart, Lung, and Blood Institute (NHLBI) along with the American Academy, issued integrated recommendations for cardiovascular (CV) risk reduction, including guidelines for management of hypertension, obesity, and hyperlipidemia (86). Universal lipid screening should be performed with measurement of non-fasting non-HDL cholesterol in all children ages 9 –11 years and 17–21 years. Those with abnormal levels should have two additional fasting lipid profiles measured 2 weeks to 3 months apart and averaged. Abnormal levels are then stratified by LDL cholesterol, TG levels, and risk factors. One of the important goals of the universal screening is identifying patients with FH. FH affects 1 in 250 population, and patients develop severe coronary artery disease and other vascular complications at a young age if not recognized and treated. Current evidence suggests that early detection of FH and cascade screening are required. Among heterozygous patients the long latent period before the expected onset of coronary artery disease provides an opportunity for initiating effective drug and lifestyle changes improving the prognosis of the disease (87,88). Universal screening in youth can also provide means of identifying affected family members through reverse cascade screening (89).


With decreasing cost and increasing accessibility, incidentally identified variants are becoming common and the ACMG (American College of Medical Genetics and Genomics) recently published guidance on clinically actionable genes. LDLRR, APOB and PCSK9 are amongst these genes. The Centers for Disease Control and Prevention has devised a 3-tier system for actionable genomic applications; with tier 1 genes backed by strong evidence that supports that identification should alter management to prevent the disease. Currently, the hyperlipidemia–associated genes represent the Centers for Disease Control and Prevention tier 1 list (90,91).


Cost-Effectiveness


Multiple studies have reported cost-effectiveness of screening. Goldman et al (92) showed the use of low-to-moderate doses of hydroxymethylglutaryl coenzyme A (HMG CoA) reductase inhibitor for primary prevention in patients with heterozygous FH was cost effective. Statins are now very inexpensive and generic.  A detailed study from the United Kingdom compared the identification and treatment of FH patients by universal screening, opportunistic screening in primary care, screening of premature myocardial infarction admissions, and tracing family members of affected patients. They concluded that screening family members of people with familial hypercholesterolemia is the most cost effective option for detecting cases across the whole population (93). Another study showed that the cost-effectiveness of a family based screening program for FH in the Netherlands is between 25·5- and 32-thousand Euros per year of life gained (94). A recent study showed cost effectiveness if searching primary care databases for high-risk population of FH followed by cascade testing as only half of the carriers are identified by cascade screening at this time (95).


GENETIC COUNSELING


FH has an autosomal dominant inheritance with a gene dosage effect and the impact of diagnosis is likely to extend beyond the affected patient to multiple relatives across multiple generations. Identifying at-risk individuals is very important to prevent morbidity and mortality due to premature CVD. Given the complicated nature of genetic testing, there is significant role of genetic counseling for professionals treating hypercholesterolemic patients. Genetic counseling should begin when the proband is suspected to have diagnosis of FH. The discussion should include an explanation of inheritance patterns, information about genetic testing, including potential benefits, risks, and potential for incidental or uncertain findings. Once results are obtained, genetic counseling helps the patient in their interpretation. Genetic counselors should discuss the genetic tests results and interpretations and need to test family members in families with positive results. They also need to discuss that about 20–40% of FH patients do not have any unidentifiable mutations in Sanger sequencing (first line testing), and might benefit from new testing modalities like whole exome sequencing. FCS has autosomal recessive inheritance and genetic testing of the families help identify at risk individuals. Early identification of subjects at risk for developing HTG could prompt early lifestyle modification or evidence- based pharmacological intervention to reduce risk of clinical end points. Individuals that are heterozygous for LPL defects are at increased risk of developing hypertriglyceridemia, particularly in response to environmental insults such as obesity, diabetes, ETOH, etc. FCHL on the other hand is a complex disorder that both genetics and environment can play a role in its pathogenesis which can be explained to the families.

REFERENCES


  1. Berberich AJ, Hegele RA. The complex molecular genetics of familial hypercholesterolaemia. Nat Rev Cardiol2019; 16:9-20
  2. Teslovich TM, Musunuru K, Smith AV, Edmondson AC, Stylianou IM, Koseki M, Pirruccello JP, Ripatti S, Chasman DI, Willer CJ, Johansen CT, Fouchier SW, Isaacs A, Peloso GM, Barbalic M, Ricketts SL, Bis JC, Aulchenko YS, Thorleifsson G, Feitosa MF, Chambers J, Orho-Melander M, Melander O, Johnson T, Li X, Guo X, Li M, Shin Cho Y, Jin Go M, Jin Kim Y, Lee JY, Park T, Kim K, Sim X, Twee-Hee Ong R, Croteau-Chonka DC, Lange LA, Smith JD, Song K, Hua Zhao J, Yuan X, Luan J, Lamina C, Ziegler A, Zhang W, Zee RY, Wright AF, Witteman JC, Wilson JF, Willemsen G, Wichmann HE, Whitfield JB, Waterworth DM, Wareham NJ, Waeber G, Vollenweider P, Voight BF, Vitart V, Uitterlinden AG, Uda M, Tuomilehto J, Thompson JR, Tanaka T, Surakka I, Stringham HM, Spector TD, Soranzo N, Smit JH, Sinisalo J, Silander K, Sijbrands EJ, Scuteri A, Scott J, Schlessinger D, Sanna S, Salomaa V, Saharinen J, Sabatti C, Ruokonen A, Rudan I, Rose LM, Roberts R, Rieder M, Psaty BM, Pramstaller PP, Pichler I, Perola M, Penninx BW, Pedersen NL, Pattaro C, Parker AN, Pare G, Oostra BA, O'Donnell CJ, Nieminen MS, Nickerson DA, Montgomery GW, Meitinger T, McPherson R, McCarthy MI, McArdle W, Masson D, Martin NG, Marroni F, Mangino M, Magnusson PK, Lucas G, Luben R, Loos RJ, Lokki ML, Lettre G, Langenberg C, Launer LJ, Lakatta EG, Laaksonen R, Kyvik KO, Kronenberg F, Konig IR, Khaw KT, Kaprio J, Kaplan LM, Johansson A, Jarvelin MR, Janssens AC, Ingelsson E, Igl W, Kees Hovingh G, Hottenga JJ, Hofman A, Hicks AA, Hengstenberg C, Heid IM, Hayward C, Havulinna AS, Hastie ND, Harris TB, Haritunians T, Hall AS, Gyllensten U, Guiducci C, Groop LC, Gonzalez E, Gieger C, Freimer NB, Ferrucci L, Erdmann J, Elliott P, Ejebe KG, Doring A, Dominiczak AF, Demissie S, Deloukas P, de Geus EJ, de Faire U, Crawford G, Collins FS, Chen YD, Caulfield MJ, Campbell H, Burtt NP, Bonnycastle LL, Boomsma DI, Boekholdt SM, Bergman RN, Barroso I, Bandinelli S, Ballantyne CM, Assimes TL, Quertermous T, Altshuler D, Seielstad M, Wong TY, Tai ES, Feranil AB, Kuzawa CW, Adair LS, Taylor HA, Jr., Borecki IB, Gabriel SB, Wilson JG, Holm H, Thorsteinsdottir U, Gudnason V, Krauss RM, Mohlke KL, Ordovas JM, Munroe PB, Kooner JS, Tall AR, Hegele RA, Kastelein JJ, Schadt EE, Rotter JI, Boerwinkle E, Strachan DP, Mooser V, Stefansson K, Reilly MP, Samani NJ, Schunkert H, Cupples LA, Sandhu MS, Ridker PM, Rader DJ, van Duijn CM, Peltonen L, Abecasis GR, Boehnke M, Kathiresan S. Biological, clinical and population relevance of 95 loci for blood lipids. Nature 2010; 466:707-713
  3. Johansen CT, Hegele RA. Genetic bases of hypertriglyceridemic phenotypes. Curr Opin Lipidol 2011; 22:247-253
  4. O'Sullivan JW, Raghavan S, Marquez-Luna C, Luzum JA, Damrauer SM, Ashley EA, O'Donnell CJ, Willer CJ, Natarajan P, American Heart Association Council on G, Precision M, Council on Clinical C, Council on Arteriosclerosis T, Vascular B, Council on Cardiovascular R, Intervention, Council on L, Cardiometabolic H, Council on Peripheral Vascular D. Polygenic Risk Scores for Cardiovascular Disease: A Scientific Statement From the American Heart Association. Circulation 2022; 146:e93-e118
  5. Rader DJ, Cohen J, Hobbs HH. Monogenic hypercholesterolemia: new insights in pathogenesis and treatment. J Clin Invest 2003; 111:1795-1803
  6. Goldstein JL, Brown MS. The LDL receptor locus and the genetics of familial hypercholesterolemia. Annu Rev Genet 1979; 13:259-289
  7. Leigh SE, Foster AH, Whittall RA, Hubbart CS, Humphries SE. Update and analysis of the University College London low density lipoprotein receptor familial hypercholesterolemia database. Ann Hum Genet 2008; 72:485-498
  8. Wald DS, Bestwick JP, Morris JK, Whyte K, Jenkins L, Wald NJ. Child-Parent Familial Hypercholesterolemia Screening in Primary Care. N Engl J Med 2016; 375:1628-1637
  9. Sturm AC, Knowles JW, Gidding SS, Ahmad ZS, Ahmed CD, Ballantyne CM, Baum SJ, Bourbon M, Carrie A, Cuchel M, de Ferranti SD, Defesche JC, Freiberger T, Hershberger RE, Hovingh GK, Karayan L, Kastelein JJP, Kindt I, Lane SR, Leigh SE, Linton MF, Mata P, Neal WA, Nordestgaard BG, Santos RD, Harada-Shiba M, Sijbrands EJ, Stitziel NO, Yamashita S, Wilemon KA, Ledbetter DH, Rader DJ, Convened by the Familial Hypercholesterolemia F. Clinical Genetic Testing for Familial Hypercholesterolemia: JACC Scientific Expert Panel. J Am Coll Cardiol 2018; 72:662-680
  10. Sjouke B, Hovingh GK, Kastelein JJ, Stefanutti C. Homozygous autosomal dominant hypercholesterolaemia: prevalence, diagnosis, and current and future treatment perspectives. Curr Opin Lipidol 2015; 26:200-209
  11. Nordestgaard BG, Chapman MJ, Humphries SE, Ginsberg HN, Masana L, Descamps OS, Wiklund O, Hegele RA, Raal FJ, Defesche JC, Wiegman A, Santos RD, Watts GF, Parhofer KG, Hovingh GK, Kovanen PT, Boileau C, Averna M, Boren J, Bruckert E, Catapano AL, Kuivenhoven JA, Pajukanta P, Ray K, Stalenhoef AF, Stroes E, Taskinen MR, Tybjaerg-Hansen A, European Atherosclerosis Society Consensus P. Familial hypercholesterolaemia is underdiagnosed and undertreated in the general population: guidance for clinicians to prevent coronary heart disease: consensus statement of the European Atherosclerosis Society. Eur Heart J2013; 34:3478-3490a
  12. Garg A, Garg V, Hegele RA, Lewis GF. Practical definitions of severe versus familial hypercholesterolaemia and hypertriglyceridaemia for adult clinical practice. Lancet Diabetes Endocrinol 2019; 7:880-886
  13. Soria LF, Ludwig EH, Clarke HR, Vega GL, Grundy SM, McCarthy BJ. Association between a specific apolipoprotein B mutation and familial defective apolipoprotein B-100. Proc Natl Acad Sci U S A 1989; 86:587-591
  14. Maxwell KN, Fisher EA, Breslow JL. Overexpression of PCSK9 accelerates the degradation of the LDLR in a post-endoplasmic reticulum compartment. Proc Natl Acad Sci U S A 2005; 102:2069-2074
  15. Pisciotta L, Priore Oliva C, Pes GM, Di Scala L, Bellocchio A, Fresa R, Cantafora A, Arca M, Calandra S, Bertolini S. Autosomal recessive hypercholesterolemia (ARH) and homozygous familial hypercholesterolemia (FH): a phenotypic comparison. Atherosclerosis 2006; 188:398-405
  16. D'Erasmo L, Minicocci I, Nicolucci A, Pintus P, Roeters Van Lennep JE, Masana L, Mata P, Sanchez-Hernandez RM, Prieto-Matos P, Real JT, Ascaso JF, Lafuente EE, Pocovi M, Fuentes FJ, Muntoni S, Bertolini S, Sirtori C, Calabresi L, Pavanello C, Averna M, Cefalu AB, Noto D, Pacifico AA, Pes GM, Harada-Shiba M, Manzato E, Zambon S, Zambon A, Vogt A, Scardapane M, Sjouke B, Fellin R, Arca M. Autosomal Recessive Hypercholesterolemia: Long-Term Cardiovascular Outcomes. J Am Coll Cardiol 2018; 71:279-288
  17. Lu K, Lee MH, Hazard S, Brooks-Wilson A, Hidaka H, Kojima H, Ose L, Stalenhoef AF, Mietinnen T, Bjorkhem I, Bruckert E, Pandya A, Brewer HB, Jr., Salen G, Dean M, Srivastava A, Patel SB. Two genes that map to the STSL locus cause sitosterolemia: genomic structure and spectrum of mutations involving sterolin-1 and sterolin-2, encoded by ABCG5 and ABCG8, respectively. Am J Hum Genet 2001; 69:278-290
  18. Anderson RA, Rao N, Byrum RS, Rothschild CB, Bowden DW, Hayworth R, Pettenati M. In situ localization of the genetic locus encoding the lysosomal acid lipase/cholesteryl esterase (LIPA) deficient in Wolman disease to chromosome 10q23.2-q23.3. Genomics 1993; 15:245-247
  19. Khachadurian AK, Uthman SM. Experiences with the homozygous cases of familial hypercholesterolemia. A report of 52 patients. Nutrition and metabolism 1973; 15:132-140
  20. Jenkins T, Nicholls E, Gordon E, Mendelsohn D, Seftel HC, Andrew MJ. Familial hypercholesterolaemia--a common genetic disorder in the Afrikaans population. S Afr Med J 1980; 57:943-947
  21. van der Graaf A, Avis HJ, Kusters DM, Vissers MN, Hutten BA, Defesche JC, Huijgen R, Fouchier SW, Wijburg FA, Kastelein JJ, Wiegman A. Molecular basis of autosomal dominant hypercholesterolemia: assessment in a large cohort of hypercholesterolemic children. Circulation 2011; 123:1167-1173
  22. Moorjani S, Roy M, Gagne C, Davignon J, Brun D, Toussaint M, Lambert M, Campeau L, Blaichman S, Lupien P. Homozygous familial hypercholesterolemia among French Canadians in Quebec Province. Arteriosclerosis1989; 9:211-216
  23. Seftel HC, Baker SG, Jenkins T, Mendelsohn D. Prevalence of familial hypercholesterolemia in Johannesburg Jews. Am J Med Genet 1989; 34:545-547
  24. Ahmad Z, Adams-Huet B, Chen C, Garg A. Low Prevalence of Mutations in Known Loci for Autosomal Dominant Hypercholesterolemia in a Multi-Ethnic Patient Cohort. Circ Cardiovasc Genet 2012; 5:666-675
  25. http://www.ncbi.nlm.nih.gov/clinvar?LinkName=gene_clinvar&from_uid=3949.
  26. Bruikman CS, Hovingh GK, Kastelein JJ. Molecular basis of familial hypercholesterolemia. Curr Opin Cardiol2017;
  27. Henderson R, O'Kane M, McGilligan V, Watterson S. The genetics and screening of familial hypercholesterolaemia. J Biomed Sci 2016; 23:39
  28. Goldberg AC, Hopkins PN, Toth PP, Ballantyne CM, Rader DJ, Robinson JG, Daniels SR, Gidding SS, de Ferranti SD, Ito MK, McGowan MP, Moriarty PM, Cromwell WC, Ross JL, Ziajka PE, National Lipid Association Expert Panel on Familial H. Familial hypercholesterolemia: screening, diagnosis and management of pediatric and adult patients: clinical guidance from the National Lipid Association Expert Panel on Familial Hypercholesterolemia. Journal of clinical lipidology 2011; 5:S1-8
  29. Ng PC, Henikoff S. SIFT: Predicting amino acid changes that affect protein function. Nucleic Acids Res 2003; 31:3812-3814
  30. Adzhubei I, Jordan DM, Sunyaev SR. Predicting functional effect of human missense mutations using PolyPhen-2. Curr Protoc Hum Genet 2013; Chapter 7:Unit7 20
  31. Kircher M, Witten DM, Jain P, O'Roak BJ, Cooper GM, Shendure J. A general framework for estimating the relative pathogenicity of human genetic variants. Nat Genet 2014; 46:310-315
  32. Guo J, Gao Y, Li X, He Y, Zheng X, Bi J, Hou L, Sa Y, Zhang M, Yin H, Jiang L. Systematic prediction of familial hypercholesterolemia caused by low-density lipoprotein receptor missense mutations. Atherosclerosis 2019; 281:1-8
  33. Do R, Stitziel NO, Won HH, Jorgensen AB, Duga S, Angelica Merlini P, Kiezun A, Farrall M, Goel A, Zuk O, Guella I, Asselta R, Lange LA, Peloso GM, Auer PL, Project NES, Girelli D, Martinelli N, Farlow DN, DePristo MA, Roberts R, Stewart AF, Saleheen D, Danesh J, Epstein SE, Sivapalaratnam S, Kees Hovingh G, Kastelein JJ, Samani NJ, Schunkert H, Erdmann J, Shah SH, Kraus WE, Davies R, Nikpay M, Johansen CT, Wang J, Hegele RA, Hechter E, Marz W, Kleber ME, Huang J, Johnson AD, Li M, Burke GL, Gross M, Liu Y, Assimes TL, Heiss G, Lange EM, Folsom AR, Taylor HA, Olivieri O, Hamsten A, Clarke R, Reilly DF, Yin W, Rivas MA, Donnelly P, Rossouw JE, Psaty BM, Herrington DM, Wilson JG, Rich SS, Bamshad MJ, Tracy RP, Adrienne Cupples L, Rader DJ, Reilly MP, Spertus JA, Cresci S, Hartiala J, Wilson Tang WH, Hazen SL, Allayee H, Reiner AP, Carlson CS, Kooperberg C, Jackson RD, Boerwinkle E, Lander ES, Schwartz SM, Siscovick DS, McPherson R, Tybjaerg-Hansen A, Abecasis GR, Watkins H, Nickerson DA, Ardissino D, Sunyaev SR, O'Donnell CJ, Altshuler D, Gabriel S, Kathiresan S. Exome sequencing identifies rare LDLR and APOA5 alleles conferring risk for myocardial infarction. Nature 2014;
  34. Austin MA, Hutter CM, Zimmern RL, Humphries SE. Genetic causes of monogenic heterozygous familial hypercholesterolemia: a HuGE prevalence review. Am J Epidemiol 2004; 160:407-420
  35. Goldstein JL HH, Brown MS. . Familial hypercholesterolemia.: New York, NY: McGraw-Hill Companies, Inc,.
  36. Cuchel M, Bruckert E, Ginsberg HN, Raal FJ, Santos RD, Hegele RA, Kuivenhoven JA, Nordestgaard BG, Descamps OS, Steinhagen-Thiessen E, Tybjaerg-Hansen A, Watts GF, Averna M, Boileau C, Boren J, Catapano AL, Defesche JC, Hovingh GK, Humphries SE, Kovanen PT, Masana L, Pajukanta P, Parhofer KG, Ray KK, Stalenhoef AF, Stroes E, Taskinen MR, Wiegman A, Wiklund O, Chapman MJ, European Atherosclerosis Society Consensus Panel on Familial H. Homozygous familial hypercholesterolaemia: new insights and guidance for clinicians to improve detection and clinical management. A position paper from the Consensus Panel on Familial Hypercholesterolaemia of the European Atherosclerosis Society. Eur Heart J2014; 35:2146-2157
  37. Innerarity TL, Weisgraber KH, Arnold KS, Mahley RW, Krauss RM, Vega GL, Grundy SM. Familial defective apolipoprotein B-100: low density lipoproteins with abnormal receptor binding. Proc Natl Acad Sci U S A 1987; 84:6919-6923
  38. Andersen LH, Miserez AR, Ahmad Z, Andersen RL. Familial defective apolipoprotein B-100: A review. Journal of clinical lipidology 2016; 10:1297-1302
  39. Peloso GM, Auer PL, Bis JC, Voorman A, Morrison AC, Stitziel NO, Brody JA, Khetarpal SA, Crosby JR, Fornage M, Isaacs A, Jakobsdottir J, Feitosa MF, Davies G, Huffman JE, Manichaikul A, Davis B, Lohman K, Joon AY, Smith AV, Grove ML, Zanoni P, Redon V, Demissie S, Lawson K, Peters U, Carlson C, Jackson RD, Ryckman KK, Mackey RH, Robinson JG, Siscovick DS, Schreiner PJ, Mychaleckyj JC, Pankow JS, Hofman A, Uitterlinden AG, Harris TB, Taylor KD, Stafford JM, Reynolds LM, Marioni RE, Dehghan A, Franco OH, Patel AP, Lu Y, Hindy G, Gottesman O, Bottinger EP, Melander O, Orho-Melander M, Loos RJ, Duga S, Merlini PA, Farrall M, Goel A, Asselta R, Girelli D, Martinelli N, Shah SH, Kraus WE, Li M, Rader DJ, Reilly MP, McPherson R, Watkins H, Ardissino D, Project NGES, Zhang Q, Wang J, Tsai MY, Taylor HA, Correa A, Griswold ME, Lange LA, Starr JM, Rudan I, Eiriksdottir G, Launer LJ, Ordovas JM, Levy D, Chen YD, Reiner AP, Hayward C, Polasek O, Deary IJ, Borecki IB, Liu Y, Gudnason V, Wilson JG, van Duijn CM, Kooperberg C, Rich SS, Psaty BM, Rotter JI, O'Donnell CJ, Rice K, Boerwinkle E, Kathiresan S, Cupples LA. Association of low-frequency and rare coding-sequence variants with blood lipids and coronary heart disease in 56,000 whites and blacks. Am J Hum Genet 2014; 94:223-232
  40. Chiou KR, Charng MJ. Genetic diagnosis of familial hypercholesterolemia in Han Chinese. Journal of clinical lipidology 2016; 10:490-496
  41. Hoogeveen RC, Gaubatz JW, Sun W, Dodge RC, Crosby JR, Jiang J, Couper D, Virani SS, Kathiresan S, Boerwinkle E, Ballantyne CM. Small dense low-density lipoprotein-cholesterol concentrations predict risk for coronary heart disease: the Atherosclerosis Risk In Communities (ARIC) study. Arterioscler Thromb Vasc Biol2014; 34:1069-1077
  42. Zhang DW, Lagace TA, Garuti R, Zhao Z, McDonald M, Horton JD, Cohen JC, Hobbs HH. Binding of proprotein convertase subtilisin/kexin type 9 to epidermal growth factor-like repeat A of low density lipoprotein receptor decreases receptor recycling and increases degradation. J Biol Chem 2007; 282:18602-18612
  43. Cameron J, Holla OL, Ranheim T, Kulseth MA, Berge KE, Leren TP. Effect of mutations in the PCSK9 gene on the cell surface LDL receptors. Hum Mol Genet 2006; 15:1551-1558
  44. Lipari MT, Li W, Moran P, Kong-Beltran M, Sai T, Lai J, Lin SJ, Kolumam G, Zavala-Solorio J, Izrael-Tomasevic A, Arnott D, Wang J, Peterson AS, Kirchhofer D. Furin-cleaved proprotein convertase subtilisin/kexin type 9 (PCSK9) is active and modulates low density lipoprotein receptor and serum cholesterol levels. J Biol Chem2012; 287:43482-43491
  45. Bottomley MJ, Cirillo A, Orsatti L, Ruggeri L, Fisher TS, Santoro JC, Cummings RT, Cubbon RM, Lo Surdo P, Calzetta A, Noto A, Baysarowich J, Mattu M, Talamo F, De Francesco R, Sparrow CP, Sitlani A, Carfi A. Structural and biochemical characterization of the wild type PCSK9-EGF(AB) complex and natural familial hypercholesterolemia mutants. J Biol Chem 2009; 284:1313-1323
  46. Sanchez-Hernandez RM, Di Taranto MD, Benito-Vicente A, Uribe KB, Lamiquiz-Moneo I, Larrea-Sebal A, Jebari S, Galicia-Garcia U, Novoa FJ, Boronat M, Wagner AM, Civeira F, Martin C, Fortunato G. The Arg499His gain-of-function mutation in the C-terminal domain of PCSK9. Atherosclerosis 2019; 289:162-172
  47. Abifadel M, Varret M, Rabes JP, Allard D, Ouguerram K, Devillers M, Cruaud C, Benjannet S, Wickham L, Erlich D, Derre A, Villeger L, Farnier M, Beucler I, Bruckert E, Chambaz J, Chanu B, Lecerf JM, Luc G, Moulin P, Weissenbach J, Prat A, Krempf M, Junien C, Seidah NG, Boileau C. Mutations in PCSK9 cause autosomal dominant hypercholesterolemia. Nat Genet 2003; 34:154-156
  48. Dron JS, Hegele RA. Complexity of mechanisms among human proprotein convertase subtilisin-kexin type 9 variants. Curr Opin Lipidol 2017; 28:161-169
  49. Wiegman A, de Groot E, Hutten BA, Rodenburg J, Gort J, Bakker HD, Sijbrands EJ, Kastelein JJ. Arterial intima-media thickness in children heterozygous for familial hypercholesterolaemia. Lancet 2004; 363:369-370
  50. Williams RR, Hunt SC, Schumacher MC, Hegele RA, Leppert MF, Ludwig EH, Hopkins PN. Diagnosing heterozygous familial hypercholesterolemia using new practical criteria validated by molecular genetics. Am J Cardiol 1993; 72:171-176
  51. Risk of fatal coronary heart disease in familial hypercholesterolaemia. Scientific Steering Committee on behalf of the Simon Broome Register Group. BMJ 1991; 303:893-896
  52. World Health Organization. Familial hypercholesterolemia—report of a second WHO Consultation. Geneva SWHO, 1999. (WHO publication no. WHO/HGN/FH/CONS/99.2).
  53. Wilson DP, Jacobson TA, Jones PH, Koschinsky ML, McNeal CJ, Nordestgaard BG, Orringer CE. Use of Lipoprotein(a) in clinical practice: A biomarker whose time has come. A scientific statement from the National Lipid Association. Journal of clinical lipidology 2019; 13:374-392
  54. Brunzell JD, Deeb SS. Familial Lipoprotein Lipase Deficiency, Apo C-II Deficiency, and Hepatic Lipase Deficiency. In: Valle D, Beaudet AL, Vogelstein B, Kinzler KW, Antonarakis SE, Ballabio A, eds. Online Metabolic and Molecular Bases of Inherited Disease: McGraw-Hill; 2006:1-60.
  55. Brunzell JD. Familial lipoprotein lipase deficiency. Gene reviews [Internet] 2014.;
  56. Brahm AJ, Hegele RA. Chylomicronaemia-current diagnosis and future therapies. Nat Rev Endocrinol 2015; 11:352-362
  57. Peterfy M, Ben-Zeev O, Mao HZ, Weissglas-Volkov D, Aouizerat BE, Pullinger CR, Frost PH, Kane JP, Malloy MJ, Reue K, Pajukanta P, Doolittle MH. Mutations in LMF1 cause combined lipase deficiency and severe hypertriglyceridemia. Nat Genet 2007; 39:1483-1487
  58. Beigneux AP, Franssen R, Bensadoun A, Gin P, Melford K, Peter J, Walzem RL, Weinstein MM, Davies BS, Kuivenhoven JA, Kastelein JJ, Fong LG, Dallinga-Thie GM, Young SG. Chylomicronemia With a Mutant GPIHBP1 (Q115P) That Cannot Bind Lipoprotein Lipase. Arterioscler Thromb Vasc Biol 2009;
  59. Patni N, Li X, Adams-Huet B, Garg A. The prevalence and etiology of extreme hypertriglyceridemia in children: Data from a tertiary children's hospital. Journal of clinical lipidology 2018; 12:305-310
  60. Chokshi N, Blumenschein SD, Ahmad Z, Garg A. Genotype-phenotype relationships in patients with type I hyperlipoproteinemia. Journal of clinical lipidology 2014; 8:287-295
  61. Fojo SS, Brewer HB. Hypertriglyceridaemia due to genetic defects in lipoprotein lipase and apolipoprotein C-II. J Intern Med 1992; 231:669-677
  62. Johansen CT, Hegele RA. The complex genetic basis of plasma triglycerides. Curr Atheroscler Rep 2012; 14:227-234
  63. Peterfy M. Lipase maturation factor 1: a lipase chaperone involved in lipid metabolism. Biochim Biophys Acta2012; 1821:790-794
  64. Nilsson SK, Heeren J, Olivecrona G, Merkel M. Apolipoprotein A-V; a potent triglyceride reducer. Atherosclerosis 2011; 219:15-21
  65. Calandra S, Priore Oliva C, Tarugi P, Bertolini S. APOA5 and triglyceride metabolism, lesson from human APOA5 deficiency. Curr Opin Lipidol 2006; 17:122-127
  66. Davies BS, Beigneux AP, Barnes RH, 2nd, Tu Y, Gin P, Weinstein MM, Nobumori C, Nyren R, Goldberg I, Olivecrona G, Bensadoun A, Young SG, Fong LG. GPIHBP1 is responsible for the entry of lipoprotein lipase into capillaries. Cell Metab 2010; 12:42-52
  67. Beigneux AP, Davies BS, Gin P, Weinstein MM, Farber E, Qiao X, Peale F, Bunting S, Walzem RL, Wong JS, Blaner WS, Ding ZM, Melford K, Wongsiriroj N, Shu X, de Sauvage F, Ryan RO, Fong LG, Bensadoun A, Young SG. Glycosylphosphatidylinositol-anchored high-density lipoprotein-binding protein 1 plays a critical role in the lipolytic processing of chylomicrons. Cell Metab 2007; 5:279-291
  68. Ahmad Z, Wilson DP. Familial chylomicronemia syndrome and response to medium-chain triglyceride therapy in an infant with novel mutations in GPIHBP1. Journal of clinical lipidology 2014; 8:635-639
  69. Feoli-Fonseca JC, Levy E, Godard M, Lambert M. Familial lipoprotein lipase deficiency in infancy: clinical, biochemical, and molecular study. J Pediatr 1998; 133:417-423
  70. Wilson CJ, Priore Oliva C, Maggi F, Catapano AL, Calandra S. Apolipoprotein C-II deficiency presenting as a lipid encephalopathy in infancy. Ann Neurol 2003; 53:807-810
  71. Rahalkar AR, Hegele RA. Monogenic pediatric dyslipidemias: classification, genetics and clinical spectrum. Mol Genet Metab 2008; 93:282-294
  72. Servaes S, Bellah R, Verma R, Pawel B. Lipoprotein lipase deficiency with visceral xanthomas. Pediatr Radiol2010; 40:1440-1442
  73. Patni N, Brothers, J, Xing, C, Garg, A. . Type 1 hyperlipoproteinemia in a child with large homozygous deletion encompassing GPIHBP1. Journal of clinical lipidology 2016;
  74. Durrington P. Dyslipidaemia. Lancet 2003; 362:717-731
  75. Expert panel on integrated guidelines for cardiovascular health and risk reduction in children and adolescents: summary report. Pediatrics 2011; 128 Suppl 5:S213-256
  76. Patni N, Quittner C, Garg A. Orlistat Therapy for Children With Type 1 Hyperlipoproteinemia: A Randomized Clinical Trial. J Clin Endocrinol Metab 2018; 103:2403-2407
  77. Senior M. After Glybera's withdrawal, what's next for gene therapy? Nat Biotechnol 2017; 35:491-492
  78. Goldstein JL, Schrott HG, Hazzard WR, Bierman EL, Motulsky AG. Hyperlipidemia in coronary heart disease. II. Genetic analysis of lipid levels in 176 families and delineation of a new inherited disorder, combined hyperlipidemia. J Clin Invest 1973; 52:1544-1568
  79. Veerkamp MJ, de Graaf J, Hendriks JC, Demacker PN, Stalenhoef AF. Nomogram to diagnose familial combined hyperlipidemia on the basis of results of a 5-year follow-up study. Circulation 2004; 109:2980-2985
  80. Brouwers MC, van Greevenbroek MM, Stehouwer CD, de Graaf J, Stalenhoef AF. The genetics of familial combined hyperlipidaemia. Nat Rev Endocrinol 2012; 8:352-362
  81. Gaddi A, Cicero AF, Odoo FO, Poli AA, Paoletti R, Atherosclerosis, Metabolic Diseases Study G. Practical guidelines for familial combined hyperlipidemia diagnosis: an up-date. Vasc Health Risk Manag 2007; 3:877-886
  82. Koopal C, Marais AD, Visseren FL. Familial dysbetalipoproteinemia: an underdiagnosed lipid disorder. Curr Opin Endocrinol Diabetes Obes 2017; 24:133-139
  83. Sniderman A, Tremblay A, Bergeron J, Gagne C, Couture P. Diagnosis of type III hyperlipoproteinemia from plasma total cholesterol, triglyceride, and apolipoprotein B. Journal of clinical lipidology 2007; 1:256-263
  84. Patni N, Garg A. Congenital generalized lipodystrophies--new insights into metabolic dysfunction. Nat Rev Endocrinol 2015; 11:522-534
  85. Patni N, Li X, Adams-Huet B, Vasandani C, Gomez-Diaz RA, Garg A. Regional Body Fat Changes and Metabolic Complications in Children With Dunnigan Lipodystrophy-Causing LMNA Variants. J Clin Endocrinol Metab 2019; 104:1099-1108
  86. Expert Panel on Integrated Guidelines for Cardiovascular H, Risk Reduction in C, Adolescents, National Heart L, Blood I. Expert panel on integrated guidelines for cardiovascular health and risk reduction in children and adolescents: summary report. Pediatrics 2011; 128 Suppl 5:S213-256
  87. Mortality in treated heterozygous familial hypercholesterolaemia: implications for clinical management. Scientific Steering Committee on behalf of the Simon Broome Register Group. Atherosclerosis 1999; 142:105-112
  88. Brett T, Qureshi N, Gidding S, Watts GF. Screening for familial hypercholesterolaemia in primary care: Time for general practice to play its part. Atherosclerosis 2018; 277:399-406
  89. Vinson A, Guerra L, Hamilton L, Wilson DP, Fnla. Reverse Cascade Screening for Familial Hypercholesterolemia. J Pediatr Nurs 2019; 44:50-55
  90. Landstrom AP, Chahal AA, Ackerman MJ, Cresci S, Milewicz DM, Morris AA, Sarquella-Brugada G, Semsarian C, Shah SH, Sturm AC, American Heart Association Data S, Precision Medicine Committee of the Council on G, Precision M, Council on Clinical C, Council on C, Stroke N, Council on H, Council on Lifelong Congenital Heart D, Heart Health in the Y, Council on Peripheral Vascular D, Stroke C. Interpreting Incidentally Identified Variants in Genes Associated With Heritable Cardiovascular Disease: A Scientific Statement From the American Heart Association. Circ Genom Precis Med 2023; 16:e000092
  91. Miller DT, Lee K, Abul-Husn NS, Amendola LM, Brothers K, Chung WK, Gollob MH, Gordon AS, Harrison SM, Hershberger RE, Klein TE, Richards CS, Stewart DR, Martin CL, documents@acmg.net ASFWGEa. ACMG SF v3.1 list for reporting of secondary findings in clinical exome and genome sequencing: A policy statement of the American College of Medical Genetics and Genomics (ACMG). Genet Med 2022; 24:1407-1414
  92. Goldman L, Goldman PA, Williams LW, Weinstein MC. Cost-effectiveness considerations in the treatment of heterozygous familial hypercholesterolemia with medications. Am J Cardiol 1993; 72:75D-79D
  93. Marks D, Wonderling D, Thorogood M, Lambert H, Humphries SE, Neil HA. Cost effectiveness analysis of different approaches of screening for familial hypercholesterolaemia. BMJ 2002; 324:1303
  94. Marang-van de Mheen PJ, ten Asbroek AH, Bonneux L, Bonsel GJ, Klazinga NS. Cost-effectiveness of a family and DNA based screening programme on familial hypercholesterolaemia in The Netherlands. Eur Heart J 2002; 23:1922-1930
  95. Crosland P, Maconachie R, Buckner S, McGuire H, Humphries SE, Qureshi N. Cost-utility analysis of searching electronic health records and cascade testing to identify and diagnose familial hypercholesterolaemia in England and Wales. Atherosclerosis 2018; 275:80-87


Impaired Sensitivity to Thyroid Hormone: Defects of Transport, Metabolism and Action

ABSTRACT


Resistance to thyroid hormone (RTH), a syndrome of reduced responsiveness of target tissues to thyroid hormone (TH) was identified in 1967 (1). An early report proposed various mechanisms including defects in TH transport, metabolism and action (2). However, with the identification of TH receptor beta (THRB) gene mutations in 1989 (3, 4), the term RTH became synonymous with defects of this specific gene (5). Subsequent discoveries of genetic defects that reduce the effectiveness of TH through altered cell membrane transport (6, 7) and metabolism (8) have broadened the definition of TH hyposensitivity to encompass all defects that can interfere with the biological activity of a chemically intact hormone secreted in normal or even excessive amounts. In this chapter, we have retained the acronym RTH to denote the syndrome produced by reduced intracellular action of the active TH, triiodothyronine (T3). However, with the identification of mutations in the TH receptor alpha (THRA) gene (9), RTH syndromes are designated as RTHα and RTHß. The term of impaired sensitivity to TH (ISTH) has been therefore proposed (10-12) to denote altered effectiveness of TH in a broader sense.


TH SECRETION, CELL-MEMBRANE TRANSPORT, METABOLISM AND ACTION


Normal TH action requires 1) adequate synthesis and secretion of TH, 2) its transport across cell membranes, 3) hormone activation through intracellular metabolism, 4) cytosolic processing and nuclear translocation, 5) binding to receptors, and 6) interaction of the receptors with co-regulators or other post receptor effects mediating the TH effect. In addition to nuclear actions of TH, non-genomic actions are also of physiological relevance (13, 14).


Maintenance of TH supply is insured by a feedback control mechanism involving the hypothalamus, pituitary, and thyroid gland (Figure 1A). A decrease in the circulating TH concentration induces a hypothalamus-mediated stimulation of thyroid stimulating hormone (TSH) secretion mediated by TSH-releasing hormone (TRH) from the pituitary thyrotrophs, which stimulates the thyroid follicular cells to synthesize and secrete more hormone. In contrast, TH excess attenuates or suppresses the system through the same pathway, in order to maintain homeostasis. This centrally regulated system, does not respond to changing requirements for TH in a particular organ or cell.


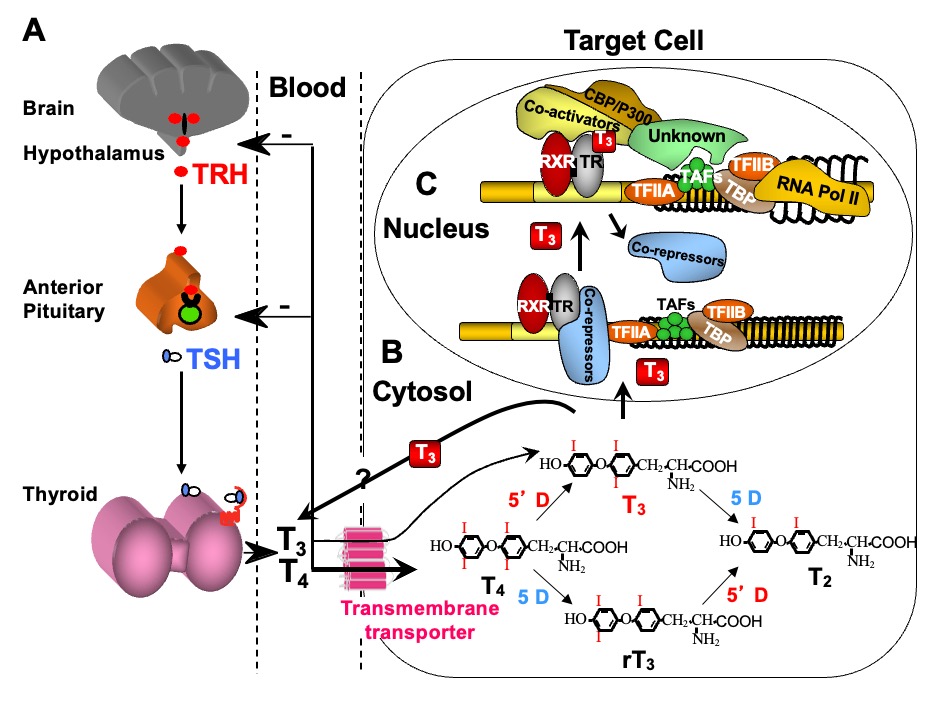
Figure 1. Regulation of TH supply, metabolism and genomic action. (A) Feedback control that regulates the amount of TH in blood. (B) Intracellular metabolism of TH, regulating TH bioactivity. (C) Genomic action of TH. For details see text. CBP/P300, cAMP-binding protein/general transcription adaptor; TFIIA and TFIIB, transcription intermediary factor II, A and B; TBP, TATA-binding protein; TAF, TBP-associated factor.

Additional systems operate to accommodate for local TH requirements. One such system is the control of TH entry into the cell through active transmembrane transporters (15). Another is the activation of the hormone precursor thyroxine (T4) by removal of the outer ring iodine (5’-deiodination) to form T3 or, inactivation of T4 and T3 by removal of the inner ring iodine (5-deiodination) to form reverse T3 (rT3) and T2, respectively (Chapter 6) (Figure 1B). Cell specific adjustment in deiodinase activity allows for additional local regulation of hormone supply (16).


Finally, the types and abundance of TH receptors (TRs), through which TH action is mediated, determine the nature and degree of the response. TH action takes place in the cytosol as well as in the nucleus (13). The latter, known as genomic or type 1 effect, has been more extensively studied (14, 17, 18) (Figure 1C). TRs are ligand-regulated transcription factors that bind to DNA of genes whose expression they regulate either positively or negatively.


THE PARADOX OF COEXISTING MANIFESTTIONS OF THYROID HORMONE DEFICIENCY AND EXCESS


TH deficiency and excess are associated with typical symptoms and signs reflecting the global effects of lack and excess of the hormone, respectively, on all organs. A departure from this became apparent with the identification of the RTHß syndrome. Subjects with RTHß have high serum TH levels without TSH suppression. This paradox encompasses biochemical and clinical observations suggesting TH deficiency, sufficiency, and excess, depending on the degree and nature of the TR protein abnormality in affected individuals (5). The syndrome of TH cell membrane transport defect (THCMTD) presents a similar paradox, as subjects have high serum T3 concentration but the cellular uptake of TH is not uniform in all tissues and cell types (19).


THYROID HORMONE ACTION DEFECTS KNOWN AS RESISTANCE TO THYROID HORMONE (RTH)


The first syndrome recognized to impair the sensitivity to TH was that of reduced TH action at the cellular level (1), and it was described as Resistance to Thyroid Hormone (RTH) (2). After the clinical recognition of the syndrome, it took 22 years until the molecular defect could be unraveled by demonstrating mutations in the THRB gene in 1989 (3). Twenty-three years after this discovery, mutations in the THRA gene led to the recognition of a distinct syndrome, RTHα, in 2012 (9, 20). In addition to these two syndromes, RTHß and RTHα, other causes that impair the sensitivity to TH have been identified during the last two decades.


RESISTANCE TO THYROID HORMONE-BETA (RTHß)


Patients with RTHß are identified by their persistent elevation of circulating free TH associated with non-suppressed serum TSH levels, in the absence of intercurrent illnesses, drugs, or alterations of TH transport serum proteins. In addition, laboratory testing reveals that unusually high doses of exogenous TH are required to produce the expected suppressive effect on the secretion of pituitary TSH and the expected metabolic responses in peripheral tissues.


Although the apparent resistance to TH may vary in severity, it is always partial. The variability in clinical manifestations may be due to the severity of the hormonal resistance, the effectiveness of compensatory mechanisms, the presence of modulating genetic factors, and the effects of prior therapy. The magnitude of the hormonal resistance is, in turn, dependent on the nature of the underlying genetic defect, most commonly, a mutation in the THRB gene (5, 21)


Despite a variable clinical presentation, the common features characteristic of the RTHß syndrome are: 1) elevated serum levels of free T4 and to a lesser degree T3, particularly in older individuals, 2) normal or slightly increased serum TSH levels that respond to thyrotropin releasing hormone (TRH), 3) an absence of the usual symptoms and metabolic consequences of TH excess, and 4) goiter.


Clinical Classification  


The diagnosis is based on the clinical findings and standard laboratory tests and confirmed by genetic studies. Before THRB gene defects were recognized, the proposed sub-classification of RTHß was based on symptoms, signs and laboratory parameters of tissue responses to TH (22). Notwithstanding the assessment of TSH feedback regulation by TH, the measurements of most other responses to TH have low sensitivity and are relatively nonspecific. For this reason, all tissues other than the pituitary have been grouped together under the term peripheral tissues, on which the impact of TH was roughly assessed by a combination of clinical observation and laboratory tests.


The majority of patients who appear to be eumetabolic and maintain a near normal serum TSH concentration have been classified as having Generalized Resistance to TH (GRTH).  In such individuals, the defect seems to be compensated by the high levels of TH. In contrast, patients with equally high serum levels of TH and non-suppressed TSH levels, who appear to be hypermetabolic, because they have signs such as sinus tachycardia, are classified as having selective pituitary resistance to TH (PRTH). TSH-producing pituitary adenomas caused by somatic mutations or isoform specific TRßs mutants also fall into this category of RTH (23, 24). Finally, the occurrence of isolated peripheral tissue resistance to TH (PTRTH) was reported in a single patient (25). No mutation in the THRB gene of this patient could be identified (26), and no similar cases have been reported. Thus, it is uncertain whether PTRTH exists as a true entity. The earliest suggestion that PRTH may not constitute an entity distinct from GRTH was reported by Beck-Peccoz et al. (27). A comprehensive study involving 312 patients with GRTH and 72 patients with PRTH, has conclusively shown a significant overlap in all parameters examined including tachycardia, emotional disturbance and hyperactivity in the two categories (28). More importantly, identical mutations were found in individuals classified as having GRTH and PRTH, many of whom belonged to the same family (29). This led to the conclusion that these two seemingly different forms of RTH are in fact related to a spectrum of subjective symptoms, as well as the individual’s target organ susceptibility to changes of TH, a phenomenon also observed in subjects with thyroid dysfunction in the absence of RTH (See section on the Molecular Basis of the Defect).


Incidence and Inheritance  


The precise incidence of RTH is unknown. Because most routine neonatal screening programs are based on the determination of TSH, RTHß is rarely identified by this means (30). A limited neonatal survey by measuring blood T4 concentrations suggested the occurrence of one case per 40,000 live births (31, 32). Known cases with THRBgene mutations surpass 4,000 affected individuals.


Although most thyroid diseases occur more commonly in women, RTHß has been found with equal frequency in females and males. The condition appears to have wide geographic distribution and has been reported in Caucasians, Africans, Asians and Amerindians. The prevalence may vary among different ethnic groups.


Familial occurrence of RTHß has been documented in approximately 75% of cases.  Taking into account only those families in whom both parents of the affected subjects have been studied, the true incidence of sporadic cases or de novo mutations is 19% (Table 1). Not uncommonly, hypothyroid adults given supraphysiological amounts of TH on subjective basis are labeled as having acquired RTH. Such individuals have no mutations in the THRB gene but a compensatory upregulation of the TH degrading enzyme deiodinase 3. This can be demonstrated by the very high concentration of reverse T3 but normal T3 (33).


Table 1. Types of TRß Gene Mutations

Type

Number of occurrences

Number of families

Effect on TRß

qt different sites

(total)

(authors)’

Substitution

Single nucleotide

190

610

286

Single a.a. substitution;


5

15

9

Premature stop: C434*, K443*, E445* C446*, E449*


Dinucleotide

3

3

1

Single a.a. substitution: P453N, P453Y;

Premature stop: F451*

Deletion

Single nucleotide

2

2

2

FrSh at codon 438 and 440; stop at codon 442*


Trinucleotide

6

10

4

Single a.a. deletion: E248Δ, I276Δ, T337Δ, M430Δ , G432Δ, P452Δ


Eight nucleotides

1

1

0

FrSh at codon 443 normal stop at codon 462


Eleven nucleotides

1

2

1

FrSh at codon 449 stop at codon 459


All coding sequence

1

1

1

Complete deletion

Insertion

Single nucleotide

8

20

12

FrSh at codons: 436, 443, 448, 451, 454, 456 stop at 464)


Trinucleotide

1

0

1

Single a.a. insertion (328S)

Duplication

Seven nucleotides

1

1

0

At codon 452 FrSh and a.a. 464 (extended with 2 a.a.)

TOTAL


219

665

317


Mutations at CpG dinucleotides

20

212a

111a

35% of families with single nucleotide substitution

and 39% of similar families studied in the authors’ laboratory

De novo mutations


b

60c

19% of families studied in the authors’ laboratory

a.a., amino acid. FrSh, frame shift

a Not included are 10 families in which the mutation did not follow the rule of G to A or C to T transition.

b Not counted as publications do not always include parental genotype

c Families with THRB gene mutations excluding those with a single affected individual when both parents were not tested.


The inheritance of RTHβ is typically autosomal dominant. Transmission was only recessive in a single family (1, 34). The biallelic expression of the mutant TRß due to consanguinity in three families with dominant inheritance of RTHß, as well as the possible deletion of the paternal allele in another family, has led to very severe clinical manifestations in the affected children (35, 36).


Etiology and Genetics  


Using the technique of restriction fragment length polymorphism, Usala et al. (37) were first to demonstrate linkage between the THRB locus on chromosome 3 and the RTHß phenotype. Subsequent studies at the University of Chicago and at the National Institutes of Health have identified distinct point mutations in the THRB gene of two unrelated families with RTHß (3, 4). In both families, only one of the two THRB alleles was mutated, which was consistent with the   dominant mode of inheritance.


Mutations in the THRB gene have now been identified in subjects with RTHß of 665 families (Table 1). They comprise 219 different mutations including the initially reported index family, which was found to have complete deletion of the THRB gene (34), a finding that contrasts with the usually observed point mutations. Forty-eight of the known mutations have not been published (33). The majority of the families, 625, have single nucleotide substitutions resulting in single amino acid replacements: in 15 families, mutations leading to premature stop codons result in truncated TRß proteins. In the remaining 40 families, the sequence alterations consisted of dinucleotide substitutions, insertions, deletions of nucleotides ranging from a single base pair to 11 nucleotides, and a duplication of 7 bases (for details see Table 1).


Given that there are 446 more families than the 219 different mutations, 64 of the mutations are shared by more than one family. Haplotyping of intragenic polymorphic markers showed that, in most instances, identical mutations have developed independently in different families (38). These occur more often, though not exclusively, in CpG dinucleotide hot spots. In fact, de novo mutations are twice as frequent in CpG dinucleotides with the largest number of families, namely 41 harboring the same mutation, R338W. In addition, different mutations resulting in more than one amino acid substitution at the same codon have been found at 44 different sites. Mutations in codons 345 and 451 result both in 5 different amino acid replacements (G345R,S,A,V,D; F451I,L,S,C,*), and those in codon 453 include 8 different substitutions (P453T,S,A,N,Y,H,L,R), as well as an insertion and a deletion, and a total of 74 families harbor mutations of this particular codon.


The detected mutations are located in the last four exons of the gene and include 8, 27, 89 and 90 mutations in exons 7, 8, 9 and 10, respectively. These involve 56, 40, 292 and 278 families (Figure 2). The following mutations have been identified in more than 20 families: R243Q, A317T, R320C, R338W, R438H and P453T. Of note the first five are in CpG dinucleotides and the last in a stretch of six cytidines.


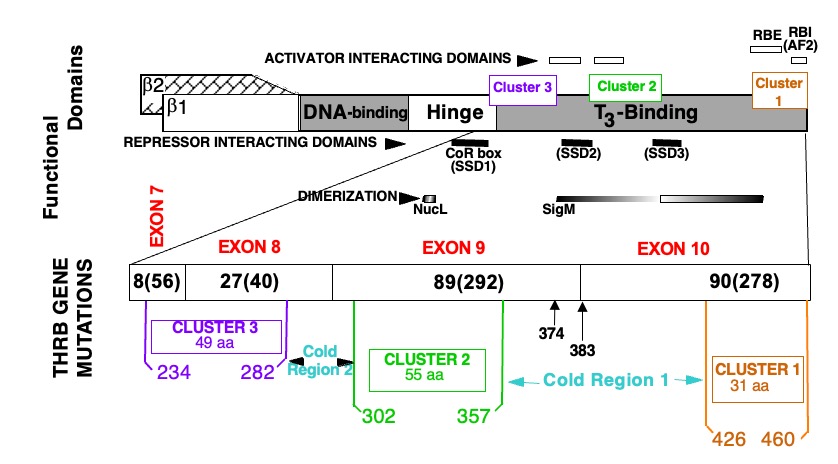
Figure 2. Location of mutations in the TRß protein in subjects with RTHß.
TOP PORTION: Schematic representation of TRß and its functional domains for interaction with TREs (DNA-binding), with hormone (T3-binding), with activating (298), repressing (299-301) cofactors and with nuclear receptor partners (dimerization) (74, 302, 303). Note their relationship to the three clusters of natural mutations.
BOTTOM PORTION: The T3-binding domain and distal end of the hinge region, which contain the three mutation clusters, are expanded. The four terminal exons containing all so far identified mutation are shown with the number different mutation and number of families in parenthesis (published and our unpublished data). Amino acids are numbered consecutively starting at the amino terminus of the TRß1 molecule according to the consensus statement of the First International Workshop on RTH (304). TRß2 has 15 additional residues at the N-terminus. Mutations occur in three clusters as indicated. A silent region between cluster 1 and 2, located in the dimerization domain contains two mutations (Q374K and R383H), indicated with arrows.
AF2, Hormone-dependent activation function (12th amphipathic helix) (305, 306); RBE, corepressor-binding enhancer; RBI, corepressor-binding inhibitor (306); SSD, silencing subdomain (301); NucL, nuclear localization (307); SigM, signature motif (308). aa, amino acid.

All THRB gene mutations are located in the functionally relevant T3-binding domain and its adjacent hinge region. Three mutational clusters have been identified with intervening cold regions (Figure 2).  No mutations have been identified in the DNA binding domain or in the amino termini characterizing TRß1 and TRß2. A report of a putative mutation, C36Y, in the amino terminus (39) represents a polymorphism that does not alter the biological properties of the TRß1 molecule (40). With the exception of the family with THRB gene deletion, the inheritance of all others is autosomal dominant.


Somatic mutations in the THRB gene have been identified in some TSH-secreting pituitary tumors (23, 41).  These mutations can be identical to those occurring in the germline.  However, which affects the negative regulation of TSH by TH, is responsible for the development of the pituitary tumor.


In 14% of families, RTHß occurs in the absence of mutations in the THRB genes (nonTRß-RTH) (42).  Such individuals may have a defect in one of the cofactors involved in the mediation of TH action (see Animal Models of RTH, below).


Molecular Mechanisms of TR Action


The two TH receptor genes located on chromosome 17 and 3 encode TRα and TRß, which have substantial structural and sequence similarities. Both genes produce two isoforms, α1 and α2 by alternative splicing, and ß1 and ß2 by different transcription start points. TRα2 binds to TH response elements (TREs) but due to a sequence difference in the ligand-binding domain (LBD), it does not bind TH (43) and appears to have a weak antagonistic effect (44). Additional TR isoforms, including a TRß with a shorter amino terminus (TRß3), a truncated TRß3, TRα1 and TRα2 lacking the DNA-binding domain (DBD) have been identified in rodents (45, 46), and TRß4 that lacks the LBD has been reported in selected human tissues (47). The significance of these variants in humans remains unknown (48). Finally, a p43 protein, translated from a downstream AUG of TRα1, is believed to mediate the TH effect in mitochondria (49).


The relative expression of the two TR genes and the distribution of the encoded proteins vary among tissues and during different stages of development (50-52). The abundance of several splice variants involving the 5'-untranslated region of the human TRß1 (53, 54) is regulated developmentally and varies among tissues. Although TRß and TRα are interchangeable (55, 56) to a certain degree, the absence of one or the other receptor does not produce equivalent phenotypes. Some TH effects are entirely TR isoform specific (see Animal Models of RTH, below).


TREs, located in TH regulated genes, consist of half-sites that contain the consensus sequence AGGTCA, and vary in number, spacing and orientation (57, 58).  Each half-site usually binds a single TR molecule (monomer), two half-sites bind two TRs (dimer) or one TR and a heterologous partner (heterodimer), the most prominent being the retinoid X receptor g (RXR). Dimer formation is facilitated by the presence of an intact "leucine zipper" motif located in the middle of the LBD of TRs. Occupation of TREs by unliganded TRs, also known as aporeceptors, inhibits the constitutive expression of genes that are positively regulated by TH (59) through association with corepressors such as the nuclear corepressor (NCoR) or the silencing mediator of retinoic acid and TH receptors (SMRT) (60). Transcriptional repression is mediated through the recruitment of the mammalian homologue of the Saccaromyces transcriptional corepressor (mSin3A) and histone deacetylases (HDAC) (61). This latter activity compacts nucleosomes into a tight and inaccessible structure, effectively shutting down gene expression (Figure 1C). This effect is relieved by the addition of TH, which releases the corepressor, reduces the binding of TR dimers to TRE, enhances the occupation of TREs by TR/RXR heterodimers (62) and recruits coactivators (CoA) such as p/CAF (CREB binding protein-associated factor) and the nuclear coactivator (NCoA) (63) with histone acetylation (HAT) activity (60, 64). This results in the loosening of the nucleosome structure making the DNA more accessible to transcription factors (Figure 1C). The ligand-dependent association with TR associated proteins, in conjunction with the general coactivators PC2 and PC4, act to mediate transcription by RNA polymerase II and general initiation factors (65). Furthermore, it is believed that T3 exerts its effect by inducing conformational changes of the TR molecule and that TR associated proteins (TRAP) stabilize the association of TRs with TREs.


In addition to these genomic effects, TH can also act at the cell membrane and in the cytosol through non-genomic actions (13, 66). These non-genomic type 2 effects (14) include oxidative phosphorylation and mitochondrial gene transcription and involve the generation of intracellular secondary messengers with induction of [Ca(2+)] (I), cyclic adenosine monophosphate (cAMP) AMP or protein kinase signaling cascades.


Properties of Mutant TRß Receptors and Associated Dominant Negative Effect


THRB gene mutations produce two forms of RTH. The less common, described in only one family (1), is caused by deletion of all coding sequences of the THRB  gene and is inherited as an autosomal recessive trait (34). The complete lack of TRß in these individuals results in severe deafness and is associated with mutism (1), as well as monochromatic vision (67) because TRß is required for the cochlear maturation and the development of cone photoreceptors that mediate color vision (68) (see Animal Models of RTH, below). Heterozygous individuals that express a single THRB gene have no clinical or laboratory abnormalities. This is not due to compensatory overexpression of the single normal allele of the THRB gene nor that of the THRA gene (69). However, because subjects with complete TRß gene deletion preserve some TH responsiveness, it is logical to conclude that TRα1 is capable of partially substituting for the function of TRß (see Animal Models of RTH, below).


The more common form of RTHß is inherited in an autosomal dominant fashion and is characterized by defects in one allele of the THRB gene, principally missense mutations. This contrasts with the lack of a phenotype in individuals that express a single THRB allele. The RTHß phenotype does not result from a lack of a functional allele (haploinsufficiency) caused by the mutant TRßs (mutTRs) but by interfering with the function of the wild-type (WT) TR (dominant negative effect, DNE). This has been clearly demonstrated in experiments in which mutTRs are coexpressed with WT TRs (70, 71).


Studies have established two basic requirements for mutTRs to exert a DNE: 1) preservation of binding to TREs on DNA and 2) the ability to dimerize with a homologous (72, 73) or heterologous partner (74, 75). These criteria apply to mutTRs with predominantly impaired T3-binding activity (Figure 3). In addition, a DNE can be exerted through impaired association with a cofactor even in the absence of important impairment of T3-binding. Increased affinity of a mutTR for a corepressor (CoR) (76, 77), or reduced association with a coactivator (CoA) (78-80), have been found to play a role in the dominant expression of RTH. The introduction in a mutTR of an additional artificial mutation that abolishes either DNA binding, dimerization or the association with a CoR results in the abrogation of its DNE (75, 81, 82).


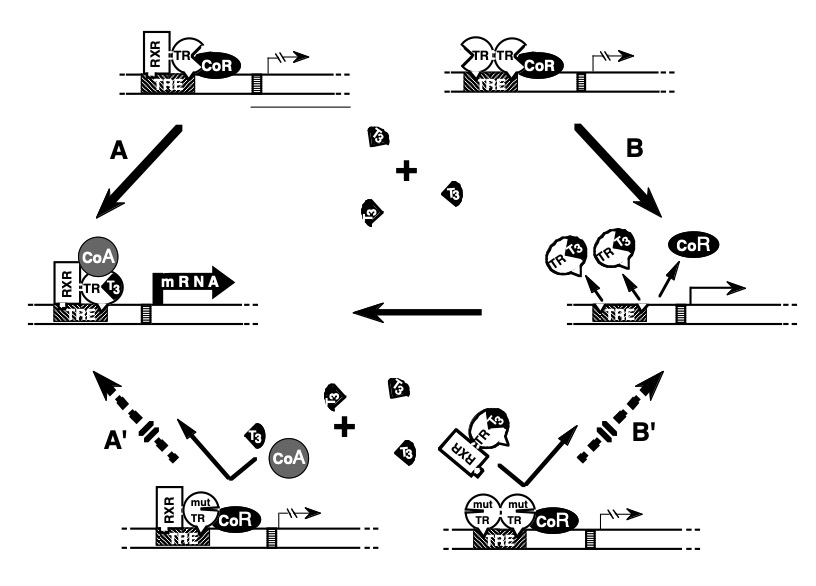
Figure 3. Mechanism of the dominant expression of RTH: In the absence of T3, occupancy of TRE by TR heterodimers (TR-TRAP) or dimers (TR-TR) suppresses transactivation through association with a corepressor (CoR). (A) T3-activated transcription mediated by TR-TRAP heterodimers involves the release of the CoR and association with coactivators (CoA) as well as (B) the removal of TR dimers from TRE releases their silencing effect and liberates TREs for the binding of active TR-TRAP heterodimers. The dominant negative effect of a mutant TR (mutTR), that does not bind T3, can be explained by the inhibitory effect of mutTR-containing-dimers and heterodimers that occupy TRE. Thus, T3 is unable to activate the mutTR-TRAP heterodimer (A') or release TREs from the inactive mutTR homodimers (B'). [Modified from Refetoff et al. (5)].

The distribution of THRB gene mutations associated with RTHß reveals a conspicuous absence of mutations in regions of the molecule that are important for dimerization, for the binding to DNA, and for the interaction with CoRs (Figure 2). These "cold regions" contain CpG hot spots, suggesting that they may not be devoid of naturally occurring mutations. Rather, mutations would escape detection owing to their failure to produce clinically significant RTHß in heterozygotes, as tested in vitro (83). This was recently confirmed in a study of a family in which one member has been fortuitously identified to have a mutation in the cold region (84). Nevertheless, mutation in other regions of the TRß could also be phenotypically silent, particularly if not occurring near the T3 binding pocket (85). Structural studies of the DBD and LBD have provided further understanding about the clustered distribution of mutTRßs associated RTH and defects in the association with cofactors (86-89).


Based on the early finding that RTHß is associated with mutations confined to the LBD of the TRß, it was anticipated that the clinical severity of RTHß would correlate with the degree of T3-binding impairment. While this was true in 12 different natural mutTRßs, in 5 others, the severity of the resistance was less pronounced despite virtually complete absent T3-binding. This is explained by the reduced dominant negative potency due to diminished ability to form homodimers (for example R316H and R338W) (90). Weakened association of TRß with DNA or CoR can produce the same effect.


Less evident was the observation of relatively severe interference with the function of the WT TRß, despite very mild impairment or no T3-binding defect at all. This was the case when hormone-binding was tested in two mutTRßs, located in the hinge region of the receptor (R243Q and R243W) (91). However, reduced T3-binding could be demonstrated after binding of the mutTRß to TRE, indicating a change in the mutTRß configuration when bound to genomic DNA (91, 92). Other mechanisms and examples of DNE in the presence of normal or slightly attenuated T3-binding include a decreased interaction of L454V with CoA (78), and a delay of R383H to release CoR (93).


In general, the relative degree of impaired function among various mutTRßs is similar whether tested using TRE-containing reporter genes that are negatively or positively regulated by T3.  Exceptions to this rule are the mutTRßs R383H and R429Q that show greater impairment of transactivation on negatively rather than positively regulated promoters (90, 93, 94). In this respect, these two mutTRßs are candidates for a predominant PRTH phenotype, even though they have been clinically described as producing GRTH (95), as well as PRTH (96, 97). Substitution of these charged amino acids (in this case arginine) disrupts the unique property of TRß2 to bind certain coactivators through multiple contact surfaces (98). The result is a decrease in the normal T3-mediated feedback suppression mediated by TRß2 through the conversion of TRß2 to a TRß1-like molecule with altered CoA binding. As a consequence, the mutation affects predominantly TRß2 mediated action. In vivo support for a TRß2 predominant impairment of the mutTRß R429Q was also obtained in mice (99). Another putative mechanism for isolated PRTH was illustrated by the occurrence of a double-hit combining in cis the THRB mutation R338W and a single nucleotide polymorphism (SNP) located in an intronic enhancer shown to play a critical role in the pituitary expression of the TRβ2 isoform (100). The presence of a thymidine in this SNP, leads to over-expression of the mutant allele in GH3 pituitary-derived cells, thus having the potential to generate a tissue-specific dominant-negative condition. However, the T/C nucleotides of this SNP have not been correlated with the clinical presentation in individuals with this most common TRß R338W mutation. No mutations specific to the TRß2 involved in the hypothalamic-pituitary feedback regulation have been identified.


Molecular Basis of the Variable RTHβ Phenotype


The extremes of the RTHß phenotype have a readily apparent molecular basis. Subjects heterozygous for a THRBgene deletion are normal because the expression of a single THRB allele is sufficient for normal function. RTHß manifests in homozygotes completely lacking the THRB gene and in heterozygotes that express a mutTRß with DNE. The most severe form of RTHß, with extremely high TH levels and signs of both hypothyroidism and thyrotoxicosis, occur in homozygous individuals expressing only mutTRßs (35, 36). The severe hypothyroidism manifesting in bone and brain of such subjects can be explained by the silencing effect of a double dose of mutTR and its interference with the function of TRα (72), a situation which does not occur in homozygous subjects who lack TRß. In contrast, the manifestation of thyrotoxicosis in other tissues, such as the heart, may be explained by the effect of high TH levels on tissues that normally express predominantly TRα1 (101, 102) (see Animal Models of RTH, below).  For this same reason, tachycardia is a relatively common finding in RTHß (103).


Various mechanisms can be postulated to explain the tissue differences in TH resistance within the same subject and among individuals. The distribution of receptor isoforms varies from tissue to tissue (50, 104, 105). This likely accounts for greater hormonal resistance of the liver as compared to the heart. Differences in the degree of resistance among individuals harboring the same mutTRß could be explained by the relative level of mutant and WT TR expression.  Such differences have been found in one study using cultured fibroblasts (106) but not in another (69). Various reasons for a predominant TRß2 dysfunction have been presented in the preceding section.


Although in a subset of mutTRßs a correlation was found between their functional impairment and the degree of thyrotroph hyposensitivity to TH, this correlation is not maintained in terms of hormonal resistance in peripheral tissues (90). Subjects with the same mutations, even belonging to the same family, show different degrees of hormone resistance. A most striking example is that of family G.H. in which the mutTRß R316H did not co-segregate with the RTHß phenotype in all family members (107).  This variability of clinical and laboratory findings was not observed in affected members of two other families with the same mutation (29, 108).  A study in a large family with the mutTRß R320H, suggests that genetic variability of factors other than TR may modulate the phenotype of RTHß (109).


RTHß Without THRB Gene Mutations (nonTRß-RTH)


The molecular basis of nonTRß-RTH remains unknown.  Since the first demonstration of nonTRß-RTH (21), more than 75 families with the phenotype of RTHß  have been identified, in which affected individuals did not harbor germline mutations in the THRB, 39 of which in the authors’ laboratory (42, 110-113). The phenotype is indistinguishable from that in subjects with THRB gene mutations. Distinct features are an increased female to male ratio and a high prevalence of sporadic cases. While it has been postulated that nonTRß-RTH is likely caused by a defect in one of the cofactors involved in the mediation of TH action, proof supporting this contention is lacking (114). Recently, in-depth targeted new generation sequencing revealed mosaicism of previously reported THRB gene mutations in 19% of families (33) as previously identified in one family (115). Two families with more than one affected individual were found to harbor a THRB gene mutation that had been missed when early sequencing required cloning of amplified fragments into plasmids (33).


Animal Models of RTHß


Understanding the action of TH in vivo, and the mechanisms underlying the abnormalities observed in patients with RTHß, has been bolstered by observations made in genetically manipulated mice. Three types of genetic manipulations have been applied: (a) transgenic mice that overexpress a receptor; (b) deletion of the receptor (knockout or KO); and (c) introduction of mutations in the receptor (knockin or KI). The latter two types of gene manipulation, species differences notwithstanding, have yielded true models of the recessively and dominantly inherited forms of RTHß (116).


The features of RTHß found in patients homozygous for TRß deletion also manifest in the TRß deficient mouse (117-119). Special features, such as sensorineural deafness and monochromatic vision are characteristic and shared by mouse (120) (121) and man (1, 122). The mouse model allowed for investigations in greater depth into the mechanisms responsible for the development of these abnormalities. Thus, TRß deficiency retards the expression of fast-activating potassium conductance in inner hair cells of the cochlea that transforms the immature cells from spiking pacemakers to high-frequency signal transmitters (123). TRß2 interacts with transcription factors providing timed and spatial order for cone differentiation. Its absence results in the selective loss of M-opsin (121). The down regulation of hypothalamic TRH is also TRß2 specific (124). Mice deficient in TRß have increased heart rate that can be decreased to the level of the WT mouse by reduction on the TH level (119).  This finding, together with the lower heart rate in mice selectively deficient in TRα1 (101), indicates that TH dependent changes in heart rate are mediated through TRα, and explains the tachycardia observed in some patients with RTHß.


The combined deletion of TRα1 and α2, produces no important alterations in TH or TSH concentrations in serum (55). The complete lack of TRs, both α and ß, is compatible with life (55, 56). This contrasts with the complete lack of TH which, in the athyreotic Pax8 deficient mouse, results in death prior to weaning, unless rescued by TH treatment (125). The survival of mice deficient in both TRα and ß is not due to expression of a yet unidentified TR but to the absence of the noxious silencing effects of aporeceptors. Indeed, removal of the Thrα gene rescues the Pax8 KO mice from death (126). The combined Thrß and Thrα deficient mice have serum TSH levels that are 500-fold higher than those of the WT mice, and T4 concentrations 12-fold above the average normal mean (55). Thus, the presence of an aporeceptor does not seem to be required for the upregulation of TSH but no amount of TH causes its downregulation.


The first animal model of the dominantly inherited organ-limited RTHß utilized somatic transfer of a mutTRß1 G345Rmutation by means of a recombinant adenovirus (127).  The liver of these mice was resistant to TH, and overexpression of the WT TRß increased the severity of hypothyroidism, confirming that the unliganded TR has a constitutive effect both in vivo as in vitro. True mouse models of dominantly inherited RTHß have been generated by targeted mutations in the Thrß gene (128, 129). The mutations were modeled on those identified in humans with RTH [frame-shift resulting in 16 carboxylterminal nonsense amino acids (PV mouse) and T337D]. As in humans, the phenotype seen in the heterozygous KI animals was more severe in mice lacking both Thrß alleles.


NcoA (SRC-1) deficient mice have RTHß with typical increase in T4, T3 and TSH concentrations (130). A milder form of RTHß was identified in mice deficient in RXRg (131). These animals show reduced sensitivity to L-T3 in terms of TSH downregulation but not in metabolic rate. These data indicate that abnormalities in cofactors can produce RTHß.


Pathogenesis


The reduced sensitivity to TH in subjects with RTHß is shared to a variable extent by most tissues.  The hyposensitivity of the pituitary thyrotrophs results in a non-suppressed serum TSH, which in turn, increases the synthesis and secretion of TH. The persistence of TSH secretion in the face of high levels of serum free TH contrasts with the low TSH levels in the more common forms of TH hypersecretion that are TSH-independent.  This apparent paradoxical dissociation between TH and TSH is responsible for the wide use of the term "inappropriate secretion of TSH" to designate the syndrome. However, TSH hypersecretion is not at all inappropriate, given the fact that the response to TH is reduced. It is compensatory and appropriate for the level of TH action mediated through a defective TRß. As a consequence, most patients are eumetabolic, though the compensation is variable among affected individuals and among tissues in the same individual.  However, the level of tissue responses does not correlate with the level of TH, probably owing to discordance between the hormonal effect on the pituitary and other body tissues. Thyroid gland enlargement occurs with chronic, though minimal TSH hypersecretion due to increased biological potency of this glycoprotein through increased sialylation (132). Administration of supraphysiological doses of TH is required to suppress TSH secretion without induction of global thyrotoxic changes in peripheral tissues.


Thyroid-stimulating antibodies, which are responsible for the hyperactivity of the thyroid gland in Graves' disease, have been conspicuously absent in patients with RTHß. Another potential thyroid stimulator, human chorionic gonadotropin, has not been found in serum of subjects with RTHß (133, 134).


The selectivity of the resistance to TH has been convincingly demonstrated.  When tested at the pituitary level, both thyrotrophs and lactotrophs were less sensitive only to TH. Thyrotrophs responded normally to the suppressive effects of the dopaminergic drugs L-dopa and bromocriptine (135, 136), as well as to glucocorticoids (136-138). Studies carried out in cultured fibroblasts confirm the in vivo findings of selective resistance to TH. The responsiveness to dexamethasone, measured in terms of glycosaminoglycan (139) and fibronectin synthesis (140), was preserved in the presence of T3 insensitivity.


Several of the clinical features encountered in some patients with RTHß may be the manifestation of selective tissue deprivation of TH during early stages of development. These clinical features include retarded bone age, stunted growth, mental retardation or learning disability, emotional disturbances, attention deficit/hyperactivity disorder (ADHD), hearing defects, and nystagmus (5). A variety of associated somatic abnormalities appear to be unrelated pathogenically and may be the result of involvement of other genes such as in major deletions of DNA sequences (34). However, no gross chromosomal abnormalities have been detected on karyotyping (1, 141).


Pathology


Little can be said about the pathologic findings in tissues other than the thyroid. Electron microscopic examination of striated muscle obtained by biopsy from one patient revealed mitochondrial swelling, also known to be encountered in thyrotoxicosis (1). This is compatible with the predominant expression of TRα in muscle, responding to the excessive amount of circulating TH (142). Light microscopy of skin fibroblasts stained with toluidine blue showed moderate to intense metachromasia (2) as described in myxedema. However, in contrast to patients with TH deficiency, treatment with the hormone failed to induce the disappearance of the metachromasia in fibroblasts from patients with RTHß.


Thyroid tissue, obtained by biopsy or at surgery, revealed various degrees of hyperplasia of the follicular epithelium (136, 143-145). Specimens have been described as "adenomatous goiters", "colloid goiters”, and normal thyroid tissue. When present, lymphocytic infiltration is due to the coexistence of thyroiditis (146).


Clinical Features


Characteristic of the RTHß syndrome is the paucity of specific clinical manifestations. When present, manifestations are variable from one patient to another. Investigations leading to the diagnosis of RTHß have been undertaken because of the presence of goiter, hyperactive behavior or learning disabilities, developmental delay and sinus tachycardia (Figure 4). Fortuitous detection of RTHß on laboratory testing can become more common with the increased frequency of routine thyroid testing. The finding of elevated serum TH levels in association with a non-suppressed TSH is usually responsible for the pursuit of further studies leading to the diagnosis.


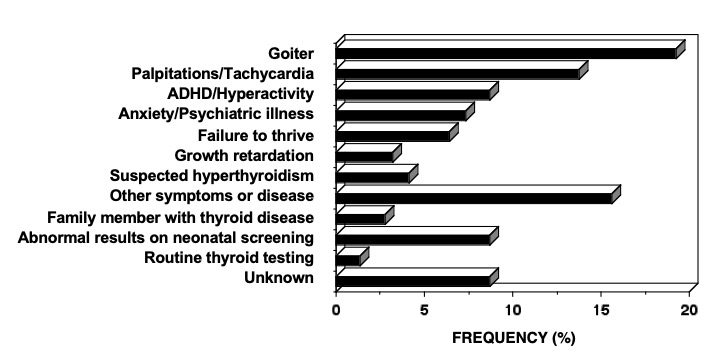
Figure 4. The reasons prompting further investigation of the index member of each family with RTHß.

The degree of compensation for tissue hyposensitivity by the increased levels of TH is variable among individuals, as well as in different tissues. As a consequence, clinical and laboratory evidence of TH deficiency and excess often coexist. For example, RTHß can present with a mild to moderate growth retardation, delayed bone maturation and learning disabilities suggestive of hypothyroidism, alongside with hyperactivity and tachycardia compatible with thyrotoxicosis. The common clinical features and their frequency are given in Table 2. Frank symptoms of hypothyroidism are more common in those individuals who, because of erroneous diagnosis, have received treatment to normalize their circulating TH levels.


Table 2.  Clinical Features of RTHß

FINDINGS

FREQUENCY (%)

Thyroid gland

     Goiter

66-95

Nervous System

     Hyperkinetic behavior

33-68

     Attention deficit hyperactivity disorder

40-60

     Learning disability

30

     Mental retardation (IQ <70)

4-16

     Hearing loss (sensorineural)

10-22

Growth and Development

     Short stature (<5th percentile)

18-25

     Delayed bone age >2 SD

29-47

     Low body mass index (in children)

33

Recurrent Ear and Throat Infections

55


Goiter is the most common abnormality. It has been reported in 66-95% of cases and is almost always detected by ultrasonography. The enlargement of the gland is usually diffuse; nodular changes and gross asymmetry are found in recurrent goiters after surgery. Goiter is more often present in children with RTHß born to normal than to affected mothers (96).


Sinus tachycardia is also very common, with some studies reporting a frequency as high as 80% (28). Palpitations often bring the patient to medical attention, and the finding of tachycardia is the most common reason for the erroneous diagnosis of autoimmune thyrotoxicosis or the suspicion of PRTH.


About one-half of subjects with RTHß have some degree of learning disability with or without ADHD (5, 147). One-quarter have intellectual quotients (IQ) less than 85, but frank mental retardation (IQ <60) has been found only in 3% of cases. Impaired mental function was found to be associated with impaired or delayed growth (<5th percentile) in 20% of subjects, although isolated growth retardation is rare (4%) (5). Despite the high prevalence of ADHD in patients with RTH, the occurrence of RTHß in children with ADHD must be very rare, none having been detected in 330 such children studied (148, 149). The higher prevalence of low IQ scores appear to confer a higher likelihood for subjects with RTHß to exhibit ADHD symptoms (108). A retrospective survey has shown an increased miscarriage rate and low birth weight of normal infants born to mothers with RTHß (150). These same individuals, exposed to high TH levels during embryonic life, develop reduced sensitivity to TH as adults despite the absence of THRB gene mutations. This epigenetic effect is transmitted along the male line for at least three generations (151).


A variety of physical defects that cannot be explained on the basis of TH deprivation or excess have been recorded. These include major or minor somatic defects, such as winged scapulae, vertebral anomalies, pigeon breast, prominent pectoralis, birdlike facies, scaphocephaly, short 4th metacarpals, as well as Besnier's prurigo, congenital ichthyosis, and bull's eye type macular atrophy (5). Some may be related to the severity of the hormonal resistance as they manifest in homozygotes (36). An infant compound heterozygous for a THRB gene mutation (R338W and R429W) presented with a cone photoreceptor disorder associated with severe thyroid hormone resistance (152).


Course of Disease


The course of the disease is as variable as is its presentation. Most subjects have normal growth and development, and lead a normal life at the expense of high TH levels and a small goiter.  Others present variable degrees of mental and growth retardation. Symptoms of hyperactivity tend to improve with age as it does in subjects with ADHD only.


Goiter has recurred in every patient who underwent incomplete thyroid surgery.  As a consequence, some subjects have been submitted to several consecutive thyroidectomies or treatments with radioiodine (145, 153-155). Thyroid cancer has been rarely reported in individuals with RTHß and, when occurring, the outcome has not been unfavorable despite incomplete TSH suppression (156).


Laboratory Findings


TH AND ITS METABOLITES


In the untreated patient, elevation in the concentration of serum free T4 is a sine qua non requirement for the diagnosis of RTHß. It is often accompanied by high serum levels of T3, but less so with advancing age.  Serum thyroid binding globulin (TBG) and transthyretin (TTR) concentrations are normal. The resin T3 uptake is usually high as is the case in patients with thyrotoxicosis.


Serum T4 and T3 values range from just above to several fold the upper limit of normal. Although the levels may vary in the course of time in the same patient (28), the T3:T4 ratio remains normal (5). This contrasts with the disproportionate increase in serum T3 concentration characteristic of autoimmune thyrotoxicosis (157).


Reverse T3 concentration is also high in patients with RTHß as is that of another product of T4 degradation, 3,3'-T2 (144). Serum thyroglobulin level tends also to be high and the degree of its elevation reflects the level of TSH induced thyroid gland hyperactivity.


In vivo turnover kinetics of T4 showed a normal or slightly increased volume of distribution and fractional disappearance rate of the hormone. However, because of the large extrathyroidal pool, the absolute daily production of T4 and T3 are increased by about two- to four-fold (2, 153, 158, 159), but the extrathyroidal conversion of T4 to T3 remains normal (159).


THYROTROPIN AND OTHER THYROID STIMULATORS  


A characteristic feature of the syndrome is the preservation of the TSH response to TRH despite the elevated TH levels (160). In most cases, the basal serum TSH concentration is normal and the circadian rhythm is unaltered (161, 162). TSH values above 6 mU/L indicate a decrease in thyroidal reserve due to treatment directed to the thyroid or associated thyroid disease. The severity of the central RTHß can be quantitated, even in the presence of reduced thyroidal reserve, using the thyrotroph T4 resistance index (TT4RI); the product of serum FT4, expressed as percent of the upper limit of normal, and the TSH level (91).


TSH has increased biological activity (132, 163) and the free alpha subunit (α-SU) is not disproportionately high. Antibodies against thyroglobulin and thyroid peroxidase indicating the presence of autoimmune thyroid disease, have a higher prevalence in RTHß (164).


THYROID GLAND ACTIVITY AND INTEGRITY OF HORMONE SYNTHESIS


The fractional uptake of radioiodine by the thyroid gland is high as is the absolute amount of accumulated iodide. The latter is normally organified as demonstrated by the retention of radioiodine following the administration of perchlorate (1, 153, 165).


IN VIVO EFFECTS OF TH


The impact of TH on peripheral tissues, assessed in vivo by a variety of tests, suggests a reduced biologic response to the hormone in some tissues but not in others. Early studies measuring the metabolic rate (BMR) evaluated by measurement of oxygen consumption showed normal results (2). However resting energy expenditure, measured subsequently by indirect calorimetry was increased, but not the rate of ATP synthesis, measured by magnetic resonance spectroscopy (166). This indicates that in subjects with RTHß, the basal mitochondrial substrate oxidation is increased and energy production in the form of ATP synthesis is decreased. Yet, the metabolic response to the administration of TH is reduced compared to normal individuals (5). With the exception of increased resting pulse rate in about one half of the patients with RTHß, the cardiac function is only minimally altered. Two-dimensional and Doppler echocardiography showed findings consistent with a mild excess of TH on cardiac systolic and diastolic function whereas other parameters, such as ejection and shortening fractions of the left ventricle, systolic diameter, and left ventricle wall thickness, were normal (103). Findings suggestive of hypothyroidism have also been reported (167). The Achilles tendon reflex relaxation time has been normal or slightly prolonged.


In contrast to overt thyrotoxicosis, serum parameters of TH action on peripheral tissues are usually in the reference range. These include, serum cholesterol, carotene, triglycerides, creatine kinase, alkaline phosphatase, angiotensin-converting enzyme, sex hormone-binding globulin (SHBG), ferritin and osteocalcin. Urinary excretion of magnesium, hydroxyproline, creatine, creatinine, carnitine, and cyclic adenosine monophosphate (cAMP), all found to be elevated in thyrotoxicosis, have been normal or low, suggesting normal or slightly reduced TH effect. The prolactin hyper-responsiveness in some patients with RTHß may be due to the functional TH deprivation at the level of the lactotrophs (160).


Radiological evidence of delayed bone maturation has been observed in one-half of patients with RTHß diagnosed during infancy or childhood (5). However, the majority achieve normal adult stature.


Evaluation of endocrine function by a variety of tests has failed to reveal significant defects other than those related to the thyroid (5).


In Vitro Tests of Thyroid Hormone Action


Cultured skin fibroblasts from patients with RTHß showed reduced responses to L-T3 added to the medium in terms of degradation rate of lipoproteins (155), synthesis of glycosaminoglycans (139) and fibronectin (140). This was also true for L-T3-induced changes on specific messenger ribonucleic acid (mRNA) (168). The normal responses of dexamethasone were preserved indicating that the activity of the glucocorticoid receptor was preserved.


Responses to the Administration of Thyroid Hormone


Because reduced responsiveness to TH is central in the pathogenesis of the syndrome, patients have been given TH in order to observe their responses and thereby establish the presence of hyposensitivity to the hormone. Unfortunately, the data have been discrepant, not only because of differences in the relative degree of resistance to TH among patients, but also because of differences in the manner in which tests have been carried out.


The dose of TH that suppresses the TSH secretion, and eventually abolishes the TSH response to TRH, is greater than that required for unaffected individuals. The decreased TSH secretion during the administration of supraphysiological doses of TH is accompanied by a reduction in the thyroidal radioiodine uptake and, when exogenous L-T3 is given, a reduction in the pretreatment level of serum T4 (133, 134, 145, 153, 155).


Various responses of peripheral tissues to the administration of TH have been quantitated.  Most notable are measurements of the BMR, pulse rate, reflex relaxation time, serum cholesterol, lipids, enzymes, osteocalcin and SHBG, and urinary excretion of hydroxyproline, creatine, and carnitine.  Either no significant changes were observed, or they were much reduced relative to the amount of TH given (5).


Of great importance are observations on the catabolic effect of exogenous TH. In some subjects with RTHß, L-T4 given in doses of up to 1000 µg/day, and L-T3 up to 400 µg/day, failed to produce weight loss without a change in caloric intake, nor did they induce a negative nitrogen balance (2, 133, 136). In contrast, administration of these large doses of TH over a prolonged period of time was apparently anabolic as evidenced by a dramatic increase in growth rate and accelerated bone maturation (30, 136).


Effects of Other Drugs


As expected, administration of the TH analogue, 3,5,3'-triiodo-L-thyroacetic acid (TRIAC) to patients with RTHß produced attenuated responses (2, 162, 169).


Administration of glucocorticoids promptly reduced the TSH response to TRH and the serum T4 concentration (133, 136, 137, 143, 158).


Administration of L-dopa and bromocriptine produced a prompt suppression of TSH secretion, as well as a diminution of the thyroidal radioiodine uptake and serum T3 level (135, 136, 143). Domperidone, a dopamine antagonist, caused a rise in the serum TSH level when given to patients with RTHß (162). These observations indicate that, in this syndrome, the normal inhibitory effect of dopamine on TSH is intact.


The response to antithyroid drugs has shown some variability. Methimazole and propylthiouracil, in doses usually effective in reducing the high serum TH level of autoimmune hyperthyroidism, had no effect in two patients (2). However, in other cases of RTHß, antithyroid drugs induced some decrease in the circulating level of TH, producing a reciprocal change in the TSH concentration (3, 141, 165, 170).  Administration of 100 mg of iodine daily had a similar effect in one patient (134), but 4 mg potassium iodide per day produced no changes in another (2).


The ß adrenergic blockers, propranolol and atenolol, produce a significant reduction in heart rate.


Differential Diagnosis


Because the clinical presentation of RTHß is variable, detection requires a high degree of suspicion.  The differential diagnosis includes all possible causes of hyperthyroxinemia (Table 3). The sequence of diagnostic procedures listed in Table 4 is suggested.


Table 3. Serum Thyroid Function Tests in the Differential Diagnosi 0f Impaired Sensitivity to Thyroid Hormone

Defect

T4

T3

rT3

T3/rT3ratio

TSH

FT4 Dialysis

Other common manifestations

RTHß

↑ or N

N

N or ↑

tachycardia, goiter, ADHD

RTHα

N or sl↓

N or sl↑

N sl↓

N or sl↑

N or sl↓

growth and mental delay, constipation

TSHoma

N

sl↑ or N

thyrotoxicosis

MCT8 mut

N or ↓

↑↑

↓↓

↑↑

N or sl↑

neuropsychomotor delay

SBP2 muta

↓↓

N or sl↑

growth delay

FDH (ALBmut)

N or sl↑b

N

N or ↑

none

TBG excess

N

N

N

none

Acute NTI

↓↓

N

N or ↑

variable depending on illness

sl: slightly; N: normal; ↑: increased; ↓: decreased; mut: mutation

ADHD: attention deficit hyperactivity disorder; NTI: non-thyroidal illness

FDH: familial dysalbuminemic hyperthyroxinemia

Low serum selenium

b High in ALB L66P


Table 4. Suggested Sequence of Diagnostic Procedures in Suspected RTHß

1.   1. Usual presentation: high serum levels of free T4 with non-suppressed TSH.

2.  Confirm the elevated serum level of free T4 and exclude interfering substance, such as antibodies to T4, and other serum TH transport defects, especially if T3 is normal and obtain free T4 measurement by equilibrium dialysis

3.  Obtain tests of thyroid function in first-degree relatives; parents, sibs and children

4.  Sequence the THRB gene and if a mutation is detected shown to have an impaired function, the diagnosis of RTHß is secured

5. In the absence of THRB gene mutation and lack of abnormal thyroid function tests in other family members, the presence of a TSHoma should be excluded by measurement of the α-SU in serum and other appropriate tests (T3-suppression, TRH stimulation and MRI).

6.   6. Demonstrate a blunted TSH-suppression and metabolic response to the administration of

supraphysiological doses of TH (see response to L-T3 protocol, Figure 5).

7.   7. Blunted TSH response to L-T3 with absence of THRB gene mutation in indicates nonTRß-RTH, which includes possible THRB mosaicism.


The presence of an elevated serum T4 concentration with a non-suppressed TSH needs to be confirmed by repeated testing. The possibility of an inherited or acquired increase in T4-binding to serum TH transport proteins must be excluded by direct measurement and by estimation of the circulating free T4 level. The presence of a high serum T3 is helpful, though normal levels do not exclude RTHß. Examples of instances when serum T3 is not high are: transiently during the administration of some drugs, or with concomitant nonthyroidal illnesses (see other Endotext chapters), and permanently with advanced age, familial dysalbuminemic hyperthyroxinemia (FDH) and inherited defects of iodothyronine metabolism (see the THMD Section in this Chapter). In FDH, free T4 measured by automated direct methods but not by equilibrium dialysis may be falsely elevated. A rare cause of elevated serum T4 and T3 level is the endogenous production of antibodies directed against these iodothyronines, which can be excluded by direct testing.


Measurement of the serum TSH is an absolute requirement. Under most circumstances, patients with high concentrations of circulating free TH have virtually undetectable serum TSH levels, which fail to respond to TRH. This is true even when the magnitude of TH excess is minimal and therefore subclinical, either on physical examination or by other laboratory tests. The combination of elevated serum levels of free TH and non-suppressed TSH, narrows the differential diagnosis to one of the syndromes of reduced sensitivity to TH and autonomous hypersecretion of TSH associated with pituitary tumors (TSHomas). The clinical and laboratory findings of the latter mimic those of RTHß with a few exceptions. TSHomas have:  1) a disproportionate abundance in serum free α-SU relative to whole TSH (171);  2)  lack similar thyroid test abnormalities in parents and first degree relatives;  3)  with rare exceptions (172), their serum TSH fails to respond to TRH or suppress with supra-physiologic doses of TH;  4)  often have concomitant hypersecretion of growth hormone and or prolactin;  and 5)  in the majority of cases, tumors can be demonstrated by computerized tomography (CT) or by magnetic resonance imaging (MRI) of the pituitary.


Rarely, subjects with autoimmune thyrotoxicosis may have endogenous antibodies to TSH or some of the test components, that can give rise to false increase in serum TSH values (173). Ectopic production of TSH and endogenous TRH hypersecretion could theoretically result in TSH-induced hyperthyroidism. The presence of high serum free T3 or free T4 only, in the presence of a non-suppressed TSH, is characteristic of the syndromic abnormalities of TH cell transport and metabolism, respectively (see the THCMTD and THMD Sections in this Chapter).


Proving the existence of isolated peripheral tissue resistance to TH is not simple. Lack of clinical symptoms and signs of hypermetabolism are insufficient to establish the diagnosis of RTHß and symptoms suggestive of thyrotoxicosis are not uncommon in RTHß. Because resistance to the hormone is variable in different tissues, no single test measuring a particular response to TH is diagnostic. Furthermore, results of most tests that measure the effect of TH on peripheral tissues show considerable overlap among thyrotoxic, euthyroid and hypothyroid subjects. The value of these tests is enhanced if measurements are obtained before and following the administration of supraphysiological doses of TH.


While the demonstration of a THRB gene mutation is sufficient to establish the diagnosis of RTHß, lack of cosegregation of the THRB haplotype with the phenotype has been used to exclude the involvement of TRß in the individuals suspected of having RTHß (174). This does not exclude mosaicism (115) when a single member of the family is affected (see nonTRß-RTH Section in this Chapter). In such cases, in vivo demonstration of tissue resistance to TH is required. A standardized diagnostic protocol, using short-term administration of incremental doses of L-T3, and outlined in Figure 5, is recommended. It is designed to assess several parameters of central and peripheral tissue effects of TH in the basal state and in comparison to those determined following the administration of L-T3.  The three doses, given to adults in sequence, are a replacement dose of 50 µg/day and two supraphysiological doses of 100 and 200 µg/day.  The hormone is administered in a split dose every 12 hours and each incremental dose is given for the period of 3 days.  Doses are adjusted in children and in adults of unusual size to achieve the same level of serum T3 (for details see reference (5)). L-T3, rather than L-T4, is used because of its direct effect on tissues, bypassing potential defects of T4 transport and metabolism, which may also produce attenuated responses.  In addition, the more rapid onset and shorter duration of T3 action reduces the period required to complete the evaluation and shortens the duration of symptoms that may arise in individuals with normal responses to the hormone.  Responses to each incremental dose of L-T3 are expressed as increments and decrements or as a percent of the value measured at baseline.  The results of such a study are shown in Figure 6.


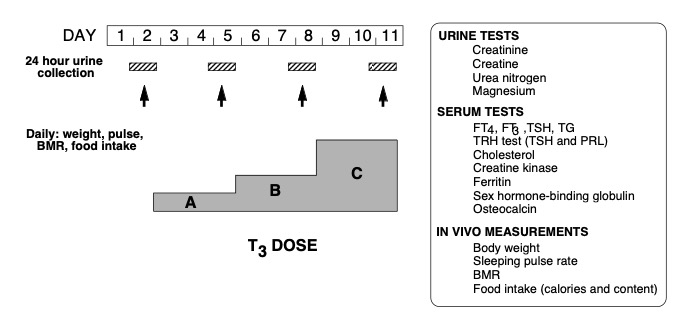
Figure 5. Schematic representation of a protocol for the assessment of the sensitivity to TH using incremental doses of L-T3. For details see text.

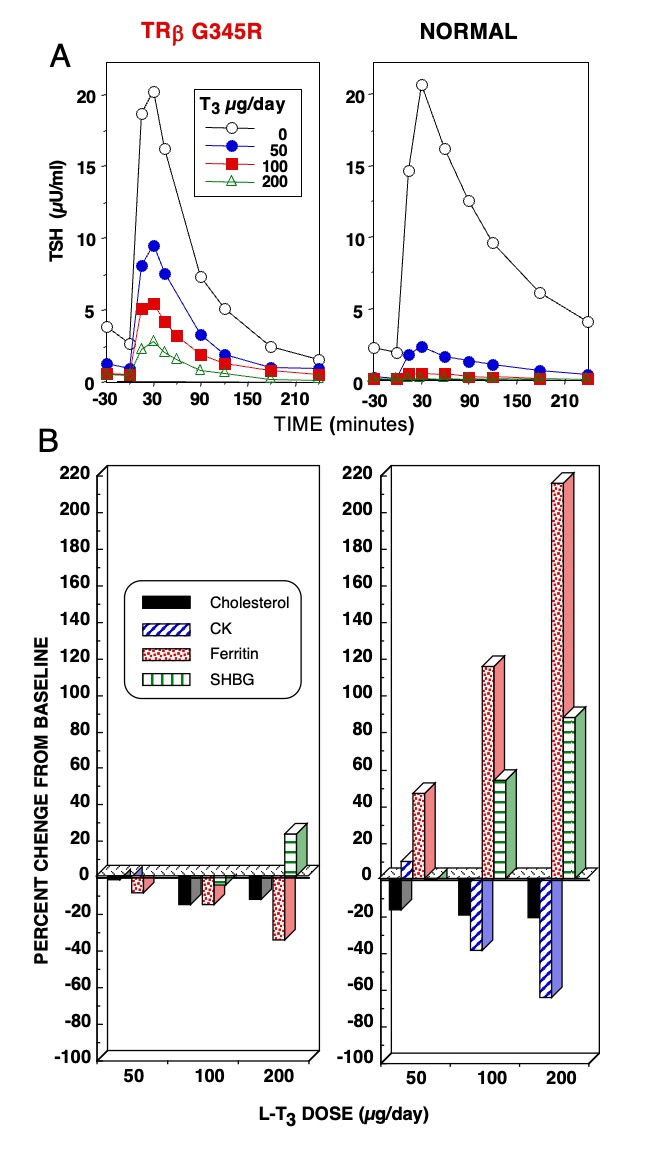
Figure 6. Responses to the administration of L-T3 in a subject with RTHß harboring TRß G345R mutant and an unaffected individual. The hormone was given in three incremental doses, each for 3 days as illustrated in Figure 5. Results are shown at baseline and after each dose of L-T3. (A) TSH responses to TRH stimulation. Note the reduced suppression of the TSH response by L-T3 in the individual with RTHß. (B) Responses of peripheral tissues. Note the stimulation of ferritin and sex hormone binding globulin (SHBG) and the suppression of cholesterol and creatine kinase (CK) in the normal subject. Responses in the affected subject were blunted or paradoxical.

The diagnosis of RTHß is particularly challenging when the latter is associated with other thyroid diseases, such as autoimmune thyrotoxicosis that suppresses the TSH level (175) or with congenital (176, 177) or acquired (178)hypothyroidism. Failure to differentiate RTHß from ordinary thyrotoxicosis continues to result in inappropriate treatments. The diagnosis requires awareness of the possible presence of RTHß, usually suspected when high levels of circulating TH are not accompanied by a suppressed TSH.


Treatment


No specific treatment is available to fully and specifically correct the defect. Theoretically, an ideal treatment for RTHß caused by mutant TRßs with altered TH binding would be to design mutation-specific TH analogues that overcome the binding defect (179). The ability to identify specific mutations in the THRB gene provides a means for prenatal diagnosis and appropriate family counseling. This is particularly important for families whose affected members show evidence of growth or mental retardation. Fortunately, in most cases of RTHß, the partial tissue resistance to TH appears to be adequately compensated for by an increase in the endogenous supply of TH. Thus, treatment need not be given to such patients. This is not the case in patients who have undergone ablative therapy or have a concomitant condition limiting their thyroidal reserve. In these patients, the serum TSH level can be used as a guideline for hormone dosage.


Not infrequently, some peripheral tissues in patients with RTHß appear to be relatively more resistant than the pituitary. Thus, compensation for the defect at the level of peripheral tissues is incomplete. In such instances, judicious administration of supraphysiological doses of the hormone is indicated. Since the dose varies greatly among cases, it should be individually determined by assessing tissue responses. In childhood, particular attention must be paid to growth, bone maturation and mental development. It is suggested that TH be given in incremental doses and that the BMR, nitrogen balance, serum SHBG and osteocalcin be monitored at each dose, and bone age and growth on a longer term.  Development of a catabolic state is an indication of overtreatment.


The exact criteria for treatment of RTHß in infancy have not been established. This is often an issue when the diagnosis is made at birth or in early infancy. In infants with elevated serum TSH levels, subclinical hypothyroidism may be more harmful than treatment with TH. Indications for treatment may include a TSH level above the upper limit of the reference range, retarded bone development, and failure to thrive. This may not apply to children homozygous for a mutant TRß. The outcome of affected older members of the family who did not receive treatment may serve as a guideline. Longer follow-up and psychological testing of infants who have been given treatment will determine the efficacy of early intervention.


It is unclear at this time whether intervention during early gestation is appropriate. However, limited experience suggests that the T4 of mothers with RTHß carrying a normal embryo should not be allowed to be higher than 50% the upper limit of normal in order to prevent low birth weight (180). The concept of in utero treatment is questionable (181, 182).


Patients with more severe thyrotroph resistance and symptoms of thyrotoxicosis may require therapy. Usually, symptomatic treatment with an adrenergic ß blocking agent, preferably atenolol, would suffice. Treatments with antithyroid drugs or thyroid gland ablation increase TSH secretion and may result in thyrotroph hyperplasia. Development of true pituitary tumors, even after long periods of thyrotroph overactivity, is extremely rare (183).


Treatment with supraphysiological doses of L-T3, given as a single dose every other day, is successful in reducing goiter size without causing side effects (184). Such treatment is preferable considering that postoperative recurrence of goiter is the rule. The L-T3 dose must be adjusted until TSH and TG are suppressed and reduction of goiter size is observed. L-T3 has been also used with some success in the treatment of ADHD in an individual with RTHß resistant to conventional treatments with stimulants (185).


Among the TH analogues used to alleviate symptoms of apparent TH excess (186), TRIAC has had the widest use(187, 188). It has a relatively greater affinity than T3 for some mutant TRßs (189). In general, TRIAC’s short half-life produces greater effect centrally than on peripheral tissues. This, in turns, reduces TSH and TH secretion with apparent amelioration of hypermetabolism. The value of treatment with D-T4 is questionable. Theoretically, the ideal treatment is development of mutant-specific TH analogues that would rescue the dominant negative effect of the mutant TRß (179).


Patients with presumed isolated peripheral tissue resistance to TH present a most difficult therapeutic dilemma. The problem is, in reality, diagnostic rather than therapeutic. Many, if not most patients falling into this category, are habitual users of TH preparations. Gradual reduction of the TH dose and psychotherapy are recommended.


RESISTANCE TO THYROID HORMONE-ALPHA (RTHα)


Background


Following the identification of a mutation in the THRB gene in 1989, finding one in the THRA gene was implicit. However, this did not come to pass for the next 23 years.  With the development of mice deficient in Trα (knockout) (55) and further, mice harboring Thrα gene mutations (knockin), modeled after human mutations known to occur in the THRB gene (190, 191), a phenotype was defined to aid in the identification of similar THRA gene defects in humans. Yet, laboratories searching for mutations in the THRA gene in individuals with low IQ and short without growth hormone deficiency did not succeed. It is through whole exome sequencing that in 2012 the first few families with THRA gene mutations were identified (9, 20, 192, 193). In retrospect, the failure to identify THRA gene mutation using the candidate gene approach was the lack of signature serum thyroid test abnormalities characteristic to individuals with THRB gene mutations.


Incidence and Inheritance


The precise incidence of RTHα is unknown. Because most routine neonatal screening programs are based on the determination of TSH, as is the case of RTHß, subjects with RTHα cannot be detected owing to their normal blood TSH. The RTHα in key cases of half of the reported families has been caused by de novo mutations (194). While the ethnic origin in most reported cases is not specified, white European is presumed based on pictures.


Etiology and Genetics


Mutations in the THRA gene have now been identified in 32 subjects with RTHα belonging to 19 families. They comprise 18 different mutations, 15 of which have been published (9, 195-203) and reviewed (194, 204). E403*, located in a CpG hot-spot was found in two unrelated families (9, 200). All are located in the ligand-binding domain of TRα and 6 of the 18 mutations involve both TRα1 and TRα2, but none affect the REV-RRBα gene transcription from the opposite strand of the THRA locus. Given the 85% amino acid homology between the hinge region and ligand binding domains of TRα1 and TRß with the exception of THRA N359Y, all have been found to have corresponding mutations in the homologous regions of the THRB and five are located in CpG hot spots. As expected, in three of them (A263V/S, R384C/H and E403K/*) mutations have produced more than one codon alteration (Figure 7).


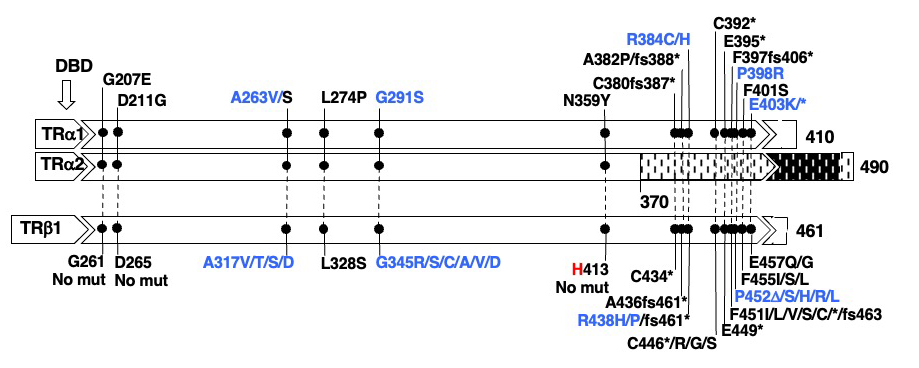
Figure 7. Mutations in TRα1 and TRα2 and in the corresponding amino acid mutations in TRß1 are aligned according to amino acid sequence homology. The single difference is indicated in red. In blue are mutations occurring in hot spots (CpG or CG-rich regions. The ligand binding domain (LBD) containing the mutations is expanded and the locations of mutation is in scale. The DNA binding domain DLBD) is upstream of the mutations. Sequences from amino acid 370 to 490 of the TRα2 diverge from those of TRα1 due to alternative splicing. Data on THRA gene mutations courtesy of Carla Moran, University of Cambridge, United Kingdom.


Molecular Basis of the Defect and Properties of the Mutant TRα


The THRA gene is located on chromosome 17. It generates two protein isoforms, TRα1 and TRα2 by alternative splicing. TRα2 is devoid of a ligand binding and its physiological function through binding on DNA remains unclear.  TRα1 functions in the same manner as TRß but there are some differences in the interaction with cofactors and in tissue distribution. It is the latter that is responsible for the differences in the phenotype in individuals harboring mutations in these two transcription factors. By virtue of TRα1 expression predominantly in the central nervous system, bone, intestine and heart, manifestations in these organs dominate. Differences in the severity among mutations can be explained by the degree of loss of function and by the amount of L-T3 required to demonstrate reversibility in vitro (197).


The mechanism causing the defect were convincingly demonstrated in the first reported patient with RTHα harboring a nonsense mutation, produces a truncated TRα1 (E403*) that lacks the C-terminal alpha-helix of the molecule (9). As a consequence, in addition to negligible T3-binding, the mutation promoted corepressor binding while abolishing binding of the coactivator, both contributing to a strong DNE as demonstrated ex vivo. The 6-year-old girl, harboring this mutation, presented with chronic constipation noted upon weaning at 7 months of age, and growth and developmental delay. Hypothyroidism manifested in organs expressing predominantly TRα, including bone, gastrointestinal tract, heart, striated muscle and central nervous system. More specifically X-rays showed patent cranial sutures with Wormian bones, delayed dentition, femoral epiphyseal dysgenesis and retarded bone age. In addition, diminished colonic motility with megacolon, slow heart rate, reduced muscle strength were suggestive of hypothyroidism, as was her placid affect, slow monotonous speech and cognitive impairment. Thyroid function tests, were of subtle nature somewhat reminiscent of MCT8 defects, presumably due to alterations in iodothyronine metabolism (Table 3) (see the THCMTD Section in this Chapter).


Animal Models of RTHα (See also animal models under RTHß, above)


The question of why mutations in the THRA gene have not been identified earlier in man was partially answered by the study of mice with targeted gene manipulations. As stated in an earlier section, THRA gene deletions, total or only α1, failed to produce a RTHß-type serum phenotype. Several human mutations known to occur in the THRB gene were targeted in homologous regions of the Thrα gene of the mouse.  These are, the PV frame-shift mutation, Trα1 R384C (equivalent to Trß R438C), Trα P398H (equivalent to Trß P452H) and Trα L400R (corresponding to Trß454) (205). While the resulting phenotypes were somewhat variable, none exhibited thyroid test abnormalities characteristic of RTHß. Common features in heterozygous mice were retarded post-natal development and growth, decreased heart rate, and difficulty in reproducing. Also, all were lethal in the homozygous state, in accordance with the noxious effect of unliganded Trα1.


Clinical Features


The earliest clinical observations are poor feeding, coarse cry and macroglossia.  Growth retardation with shorter lower limbs was also noted in infancy (9, 20).  Other somatic abnormalities and clinical findings are listed in Table 5. Unusual somatic defects including clavicle agenesis, marked abnormalities of fingers, toes and elbow joints were observed in a single patient with a THRA N359Y mutation (195). It is unlikely that these findings are related to the THRA gene defect. Constipation is a common finding that results in fecal impaction. Bowel dilatation is seen on X-rays. Decreased peristalsis and delayed intestinal transit have been documented.  In general, symptoms and signs are compatible with hypothyroidism. These include delayed fontanel closure, slow mentation and motor activity, reduced global IQ, and bradycardia.


Table 5.  List of Clinical Features of RTHα

System

Infant and Child

Adult

Early features

poor feeding; coarse cry; umbilical hernia


Developmental

delayed milestones; growth retardation

short statute (short limbs)


Somatic defects

(Dysmorphism)

macroglossia, broad and coarse face, broad face, thick lips, flat nasal bridge


skin tags

Skeletal

delayed fontanel closure

epiphyseal dysgenesis

serpiginous cranial sutures

cranial and cortical hyperostosis

Gastrointestinal

constipation; bowel dilatation

constipation

Cardiovascular

bradycardia

bradycardia, low blood pressure

Neurological

delayed speech; dyspraxia

dysarthria, slow motor initiation

ataxia, dysdiadochokinesis, low IQ

Metabolic

low metabolic Low metabolic rate, reduced resting energy expenditure, peripheral markers of TH action compatible with hormone deprivation

Hematological

mild anemia

mild anemia

Data derived from references (193, 298)


Laboratory Findings


Thyroid test abnormalities are not as prominent as in other syndromes of impaired sensitivity to TH and explain the failure to readily recognize the defect. There is a trend for serum T4 and rT3 to be low and T3 to be high. However, in most instances the concentrations of these iodothyronines are not outside of the reference range. Yet, the T3/rT3 ratio is consistently high and a good laboratory biomarker (Table 3). TSH is usually within the upper part of the reference range. A number of test results are compatible with reduced TH action in peripheral thyroid tissues but not centrally. There is a trend for insulin like growth factor I (IGF-1) to be low and for low density lipoprotein (LDL) cholesterol and creatine kinase to be elevated. Bone mineral density is increased. Anemia is a common finding and has been observed as early as 7 months of age (33). Anemia is normocytic with normal reticulocyte count, hemolytic indices, vitamin B12 and folate.


Differential Diagnosis


Suspicion for the presence of RTHα is based on clinical rather than laboratory findings. The serum thyroid test abnormalities are subtle and their relative pattern somewhat reminiscent of those found in MCT8 deficiency. However, individuals with THRA gene mutations do not manifest the severe neuropsychomotor defect characteristic of MCT8 deficiency. Symptoms of hypothyroidism are disproportionate to the thyroid function test abnormalities and TSH is not elevated as in primary hypothyroidism. The fact that in most cases diagnosis was made by whole exome sequencing attests to the difficulty in identifying patients based on clinical and standard laboratory evaluation. Clinical findings suggestive of congenital hypothyroidism without elevated TSH and a high T3/rT3 ratio should rise a high degree of suspicion.


Treatment


The majority of individuals with THRA gene mutations have received L-T4 treatment. The treatment has shown beneficial effect on symptoms and signs caused by functional thyroid hormone deprivation in peripheral tissues. These include, constipation and bradycardia but not anemia. In children, L-T4 treatment resulted in catch-up growth, motor development and in one case reduced hypotonia (201). The effectiveness of L-T4 treatment in children appears to depend on the severity of the defect [frame shift mutations (203)] and time of treatment initiation. There is no experience with treatment beginning in early infancy.


L-T4 treatment resulted in normalization of low serum T4 and rT3 levels but T3 concentration remained elevated. Serum TSH, on the other hand was suppressed, even with physiological L-T4 doses and FT4 levels within the reference range. This confirms an intact hypothalamic-pituitary axis, which may even be hypersensitive to TH. Peripheral tissue markers of TH action, such as serum SHBG, LDL cholesterol and creatine kinase also responded appropriately to L-T4 treatment.


No treatments with TH analogues have been reported. The use of TRα-specific agonist may be helpful but, being directed to the WT-receptor it will not abrogate the DNE of the mutant TRα. The development of mutant specific analogues, as suggested for RTHß, may be an option.


THYROID HORMONE CELL MEMBRANE TRANSPORTER DEFECT (THCMTD)


Patients with THCMTD caused by X-linked MCT8 deficiency are usually boys identified in infancy or in early childhood with feeding difficulties, severe cognitive deficiency, infantile hypotonia and poor head control. They develop progressive spastic quadriplegia, diminished muscle mass with weakness, joint contractures, and dystonia. Early and characteristic thyroid abnormalities are high serum T3, low T4, and a slightly elevated TSH.


The neurological phenotype is severe and incapacitating in affected individuals, with minimal variability across families. Most importantly, this phenotype is not consistent with classical generalized hyperthyroidism or hypothyroidism. Depending on the type of TH transporters expressed, different tissues manifest the consequences of TH excess or deprivation. Tissues expressing other transporters than MCT8 respond to the high circulating T3 level, resulting in a hyperthyroid state, while tissues dependent on MCT8 for TH transport, are hypothyroid. This complicates treatment as standard TH replacement fails to reach some tissues, while it worsens the hyperthyroidism in others.


The complex and severe neurodevelopmental phenotype together with the pathognomonic thyroid tests including high serum T3, low rT3, low or low normal serum T4 concentrations and normal of slightly elevated serum TSH levels represent the characteristic presentation of the MCT8 deficiency syndrome.


Cell Membrane Transporters of TH


The identification and characterization of several classes of molecules that transport TH across membranes (206), has changed the previously held paradigm of passive TH diffusion into cells (207). These proteins belong to different families of solute carriers: 1) Na+/taurocholate cotransporting polypeptide (NTCP) (208);  2) fatty acid translocase(209);  3) multidrug resistance-associated proteins (210);  4) L-amino acid transporters (LAT) (211), among which LAT1 and LAT2 have been shown to transport TH;  5) members of the organic anion-transporting polypeptide (OATP) family (212), of which OATP1B1 and OATP1B3 are exclusively expressed in liver and transport the sulfated iodothyronines, T4S, T3S, and rT3S and less efficiently the corresponding non-sulfated analogues, whereas OATP1C1 is localized preferentially in brain capillaries and shows a high specificity and affinity towards T4. The latter suggests that OATP1C1 may be important for transport of T4 across the blood-brain barrier (213); and 6) within the monocarboxylate transporter (MCT) family (214), MCT8 and MCT10 are specific TH transporters (215, 216). Differences in tissue distribution and transport kinetics of TH and of other ligands, impart their distinctive roles in the cell-specific delivery of TH.


Early studies using the expression of rat Mct8 in an heterologous system, showed that it potentiated the uptake of T4, T3, rT4, and 3,3′-T2 by 10-fold, but it had no effect on the uptake of sulfated T4, the aromatic amino acids phenylalanine, tyrosine, and tryptophan, or lactate (216). Furthermore, transfection of human MCT8 in mammalian cells enhanced the metabolism of iodothyronines by endogenous deiodinases (217). These studies demonstrated the potent and iodothyronine-specific cell membrane transport function of MCT8.


The importance of MCT8 was most convincingly demonstrated by the identification of the first inherited THCMTD caused by mutations in the MCT8 gene (6, 7). Although presence of the defect is suspected on the basis of clinical findings and standard laboratory tests, genetic confirmation is mandatory. Recently a novel neurodegenerative disease associated with a homozygous missense mutation in the T4 transporter OATP1C1 was reported (218). The patient was a 15.5-year-old girl with normal development during the first year of life, who gradually developed dementia with spasticity and intolerance to cold. Brain imaging demonstrated gray and white matter degeneration and severe glucose hypometabolism. When studied in vitro, decreased uptake of T4 was shown, however, serum thyroid function tests were normal (218). At this point it cannot be excluded that the deficit in another substrate is responsible for or contributes to the phenotype.


Inheritance and Incidence  


MCT8 deficiency is a recessive X-linked defect that affects males, while females harboring a mutation are carriers. There is 100% penetrance in males that inherit a deleterious mutation. They manifest neuro-psychomotor and characteristic thyroid test abnormalities, whereas carrier females may show only mild thyroid test abnormalities (6, 219, 220). A female with typical features of MCT8-specific THCMTD had a de novo translocation disrupting the MCT8gene and unfavorable nonrandom X-inactivation (221). No affected male has reproduced. The defect has been reported in individuals of all races and diverse ethnic origins.


The exact incidence of this defect is not known. As most routine neonatal screening programs are based on the determination of TSH, MCT8 deficiency is rarely identified at birth by this mean. In neonatal screening programs based on T4 measurements, a low concentration could potentially identify new cases. The yield is expected to be low given the high frequency of low T4 levels in newborns.


The identification of more than 200 families with MCT8 gene defects during the last 16 years indicates that this syndrome is more common than initially suspected. MCT8 gene mutations can be maintained in the population because carrier females are asymptomatic and fertile, which precludes negative selection. Familial occurrence of MCT8 defects has been documented in many instances, however, genetic information on mothers of affected males is not always available.


Etiology


The clinical condition was first recognized in 1944, in a large family with X chromosomal mental retardation presenting with motor abnormalities (222), a form of syndromic X-linked mental retardation, subsequently named the Allan-Herndon-Dudley syndrome (AHDS). In 1990, the syndrome was mapped to a locus on chromosome Xq21 (223). Following the identification of MCT8, gene mutations in subjects with thyroid abnormalities and neuropsychomotor manifestations were identified (6, 7), and subsequently MCT8 mutations were found in other affected males, including the original family described in 1944 (224). The affected subjects have the characteristic thyroid test abnormalities, which went unnoticed in the past.


A large-scale screening of 401 males with X-linked mental retardation has identified MCT8 gene mutations in only 3 subjects, and two of them had the characteristic thyroid phenotype. The other one had a normal serum T3, but the mutation was also found in an unaffected relative (221). This underscores the importance of performing thyroid tests prior to undertaking gene sequencing, in individuals suspected of having a MCT8 defect on the basis of the neurological phenotype.


Given the existence of other types of TH transporters and their different tissue distributions, it is anticipated that defects in such transport molecules would result in distinct phenotypes, the nature of which is difficult to predict. However, as mice deficient in specific TH transporters become available, some predictions about the nature of such diseases may be deduced despite species constraints. In this regard, mice with targeted inactivation of the Lat2(Slc7a8), Mct10 (Slc16a10) and Oapt1c1 (Slco1c1 or Oatp14) TH transporters showed normal development, growth and normal thyroid function tests (225-227). The distribution of Oatp1c1 differs in the brain of mice compared to humans, with mouse Oatp1c1 being predominantly localized in capillary endothelial and only weak OATP1C1 staining being detected by immunohistochemistry in capillary endothelial cells in human brain sections (228). No mutations have been reported in humans in the LAT2 and MCT10 transporters, however a human case of OATP1C1 defect has been recently reported (218).


The MCT8 Gene and Mutations


The MCT8 gene was first cloned during the physical characterization of the Xq13.2 region known to contain the X-inactivation center (229). It has 6 exons and a large first intron that encompasses >100 kb. It belongs to a family of genes, named SLC16, the products of which catalyze proton-linked transport of monocarboxylates, such as lactate, pyruvate and ketone bodies. The deduced products of the MCT8 (SLC16A2) gene are proteins of 613 and 539 amino acids (translated from two in-frame start sites) containing 12 transmembrane domains (TMD) with both amino- and carboxyl- ends located within the cell (230).  The furthest upstream translation start site is absent in most species, including mouse and rat. Thus, the importance of the additional N-terminal sequence of the longer human MCT8 protein is unknown. The demonstration that the rat homologue is a specific transporter of TH into cells in 2003 opened the field to clinical and genetic investigation (215).


Over 150 different MCT8 gene mutations are known (33, 231 ) without counting the larger deletions that are not uncommon in MCT8 due to the large intron 1. Mutations are distributed throughout the coding region of the gene. At the protein level, amino acids in the extracellular and intracellular loops are relatively underrepresented. One could speculate that missense mutations in these domains could putatively result in a milder phenotype, escaping detection, as sequences in these regions are less conserved across species compared to the TMD regions (232).


The types of MCT8 gene mutations other than the large deletions involving one or more exons are shown in Figure 8. Coding single nucleotide substitutions are most common at 66%, while insertions/deletions (in/dels) causing frameshift or in frame insertions or deletions represent 30% and only 4% of defects are located at splice sites.  At the protein level, missense mutations are most common at 46%, followed by in/del frameshifts with premature termination at 26%, and nonsense mutations at 20%. A similar small proportion of 4% are in frame in/dels and defects with abnormal splicing. Some mutations have occurred in more than one family, for example, three different single amino acid in frame deletions (F229D, F501D and F554D) have occurred in more than 5 families. Different mutations in the same codon have been found to produce 2 or 3 mutant amino acids for example codon 224 (GCC) was mutated as A224T, V and E. In the families studied in our laboratory, 10% of the mutations occurred de novo, while 52% were present in at least one female carrier and one third occurred in mutation hotspots such as CpG dinucleotides C repeats or A repeats (33).


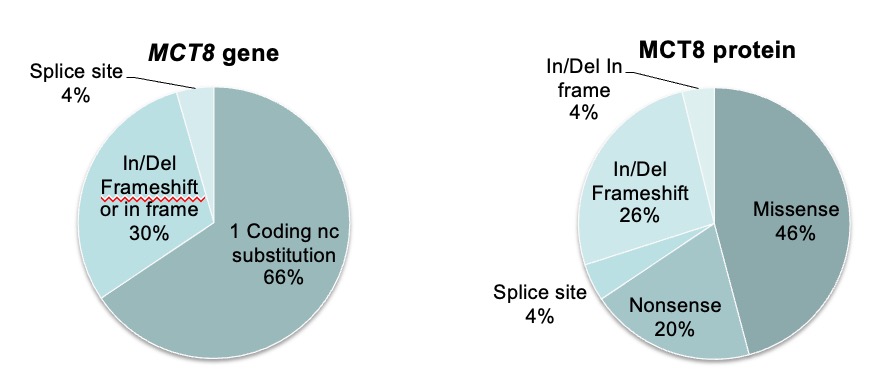
Figure 8. Representation of A. MCT8 gene mutations and B. resulting mutant MCT8 proteins associated with THCMTD, using both data reported by other groups and our published and unpublished cases, for a total of 157 different mutations.


More recently, variants of unknown significance (VUS) in the MCT8 gene have been identified by whole exome sequencing performed in individuals with less typical neurodevelopmental abnormalities. The clinical relevance of these variants has been questioned, especially if the thyroid function tests are not characteristic of MCT8 deficiency. This remains an area of investigation that could further expand the knowledge on genotype-phenotype correlations of VUS in the MCT8 gene.


Clinical Features and Course of the Disease


Male subjects that are later found to have MCT8 gene mutations, are referred for medical investigation during infancy or early childhood because of neurodevelopmental abnormalities. The clinical presentation of affected males with MCT8 gene mutations is very similar, with characteristic thyroid test abnormalities and severe psychomotor retardation.


Newborns have normal Apgar scores and in most cases there is a history of normal gestation. However, polyhydramnios and reduced fetal movements have been reported (33, 224, 233). It is unclear whether this is an intrauterine manifestation of the syndrome. At birth there were no typical signs of hypothyroidism.


Truncal hypotonia and feeding problems are the most common early signs of the defect, appearing in the first 6 months of life. Only in a few cases they manifested within the first few days of life. Characteristically the neurological manifestations progress from flaccidity to limb rigidity and impairment of psychomotor development, leading to spastic quadriplegia with advancing age. With the exception of a few, subjects are unable to walk, stand or sit independently and they do not develop speech. To date, the ability to walk or talk has been reported only in the members of three families (224, 234). These are patients harboring L568P, L434W and F501del mutations who walked with ataxic gait or support, and had a limited and dysarthric speech. A possible explanation for the milder neurological phenotype in these patients is a residual 15-37% TH-binding activity of their mutant MCT8 molecules (235).


Dystonia and purposeless movements are common and characteristic paroxysms of kinesigenic dyskinesias have been reported in several patients, particularly severe in one boy, who presented up to 150 dyskinetic episodes per day (236). These are usually triggered by somatosensory stimuli, such as changing clothes or lifting the child. The attacks consist of extension of the body, opening of the mouth, and stretching or flexing of the limbs lasting for 2 or less than a minute (237). In addition to these non-epileptic events, true seizures can also occur. An altered sleep pattern with difficulty falling asleep and frequent awakening, can represent an important clinical issue for caregivers (236). Reflexes are usually brisk, clonus is often present, but nystagmus and extension plantar responses are less common.


With advancing age, weight gain lags and microcephaly becomes apparent, while linear growth proceeds normally (238). Muscle mass is diminished and there is generalized muscle weakness with typical poor head control, originally described as “limber neck” (222). A common and pronounced feature in MCT8 deficient patients is the failure to thrive, which can be severe, requiring the placement of gastric feeding tubes in some cases. Possible causes for low weight and muscle wasting are the neurologic dysphagia, and increased metabolism due to the thyrotoxic state of peripheral tissues as indicated by reduced cholesterol, and increased transaminases, SHBG, and lactate levels found in some patients with MCT8 mutations (236, 239-241).


Common facial findings that may be attributed to the prenatal and infantile hypotonia include ptosis, open mouth, and a tented upper lip. Ear length is above the 97th centile in about half of adults. Cup-shaped ears, thickening of the nose and ears, upturned earlobes, and a decrease in facial creases have been also reported. Pectus excavatum and scoliosis are common, most likely the result of hypotonia and reduced muscle mass.


While the cognitive impairment is severe, MCT8 deficient patients tend to present a non-aggressive behavior. Generally, affected individuals are attentive, friendly, and docile. Death during childhood or teens is not uncommon, usually caused by recurrent infections and/or aspiration pneumonia. However in a few instances of more mild neurologic involvement, survival beyond age 70 years has been observed (224). Data accumulated by a parent support group between 2009 and 2018 on the causes of death in 24 children and adolescents with MCT8 deficiency with age ranging between 1 day and 23 years, shows respiratory causes with aspiration, pneumonia, sometimes leading to septic shock or death during sleep as being common causes of demise (Figure 9).


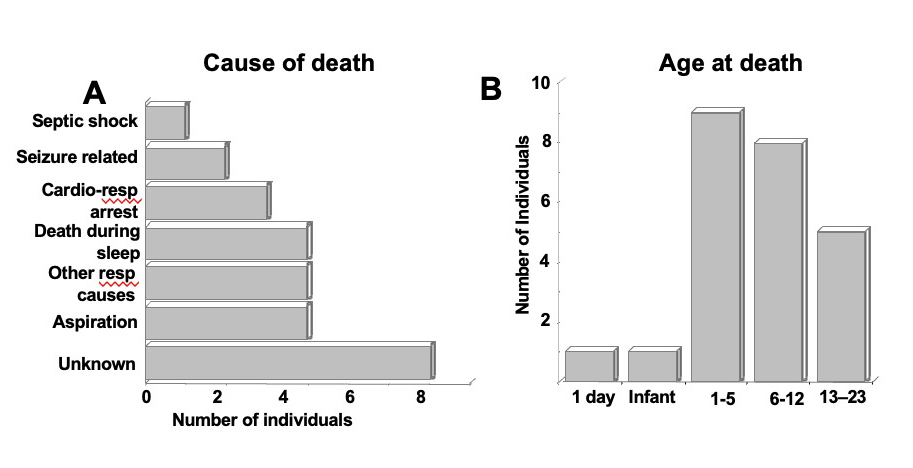
Figure 9. Death in 24 children and adolescents with MCT8 deficiency, between 2009-2018, age range 1 day to 23 years causes (A) and age (B).


Female carriers do not manifest any of the psychomotor abnormalities described above. However, intellectual delay and frank mental retardation have been reported in six carrier females (6, 221, 224, 240). Although an unfavorable nonrandom X-inactivation could alter the phenotype in these females (224), cognitive impairment can be due to a variety of causes. Thus, the causative link of MCT8 mutations in heterozygous females with cognitive impairment remains to be proven (220).


Laboratory Findings


SERUM TESTS OF THYROID FUNCTION


Most characteristic, if not pathognomonic, are the high serum total and free T3 and low rT3 concentrations. T4 is reduced in most cases and TSH levels can be slightly elevated but rarely above 6 mU/L (Figure 10). 


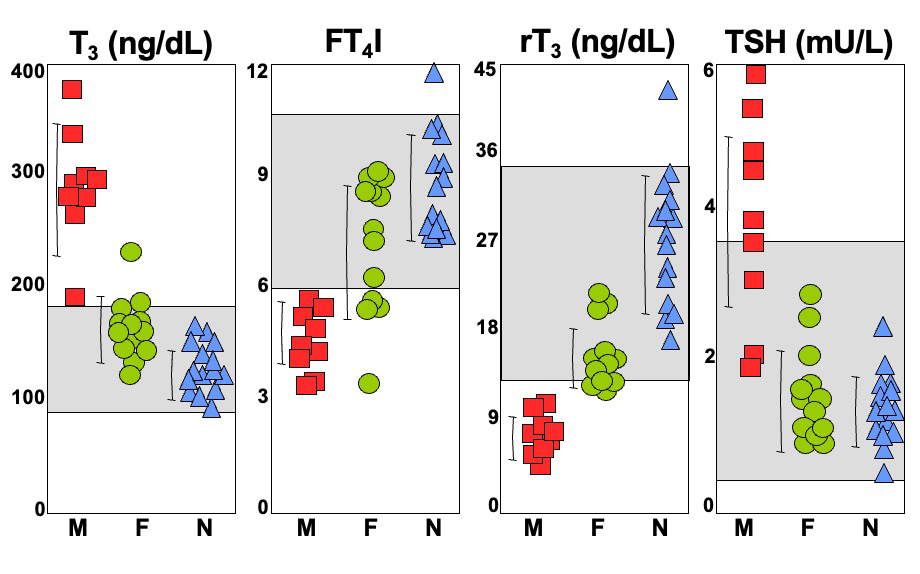
Figure 10. Thyroid function tests in several families with MCT8 deficiency studied in the authors’ laboratory. Grey regions indicate the normal range for the respective test. Hemizygous males (M) are represented as red squares, heterozygous carrier females (F), as green circles and unaffected members of the families, as blue triangles (N). With the exception of TSH, mean values of iodothyronines in carrier females are significantly different than those in affected males and normal relatives.


TSH was normal at neonatal screening in most cases. Information about neonatal T4 levels available in 8 cases revealed low values in 6 and normal levels in 2 subjects (33, 224, 236). However, low T4 concentrations at birth are not uncommon, and are more often associated with low levels of T4-binding protein and prematurity. Information regarding the T3 and rT3 concentration in the first days of life is not available. However, within one month the typical thyroid test abnormalities of MCT8 deficiency become apparent. In infants and children, tests results should be interpreted using age-specific reference ranges (see Chapter 62). This is particularly important for T3 and rT3, which are higher than those in adults. The ratio of T3 to rT3 is characteristically high in MCT8 deficiency while, with the exception of RTHα, it is low in other more common causes of abnormal T3 and rT3 levels, such as binding defects, iodine deficiency and non-thyroidal illness (Table 3).


Heterozygous female carriers can have iodothyronine concentrations that are on average intermediate between affected males and unaffected family members (6, 224, 240). While they are significantly different compared to both affected and unaffected individuals, overlapping values are observed in both groups. Serum TSH concentrations are, however, normal (Figure 10).


OTHER SERUM TESTS


Some patients have undergone extensive testing prior to the diagnosis of MCT8 deficiency. Results are summarized here and in the subsequent sections. Urinary organic acids, serum amino acids and fatty acids, CSF neurotransmitters, glucose and lactate were normal. Other test results were abnormal only in some patients. These included, elevated serum SHBG, transaminases, ammonia, lactate and pyruvate, mildly elevated medium chain products in plasma acylcarnitine profile, elevated hydroxybutyric acid in urine (33, 233, 240) and reduced serum cholesterol. While the relation of some test abnormalities with MCT8 deficiency is unclear, others can be ascribed to the effect of the high serum T3 levels on peripheral tissues. These are reduced cholesterol, and increased SHBG, and lactate.


Other endocrine tests, including pituitary function were normal when tested in a few individuals. However, administration of incremental doses of L-T3, using the protocol devised for the study of patients with RTHß, showed reduced pituitary sensitivity to the hormone (33). This is probably due the reduced feedback effect of T3 on the hypothalamo-pituitary axis, as well as the reduced incremental effect of the hormone on peripheral tissues already exposed to high levels of T3.


X-RAYS AND IMAGING


Bone age has been inconsistently reported, and was found to be delayed in four cases and was slightly advanced in one (33, 240, 242, 243). The consequences of the MCT8 defects on bone are not clear at this time.


Mild to severe delayed myelination or dysmyelination (33, 244, 245) is a common finding when brain MRI is performed in early life. However, this can be missed as the delay in myelination is usually less apparent by approximately 4 years of age, and an adequate MRI technique is required for optimal interpretation. This distinguishes MCT8 deficiency from other leukodystrophies in which the myelination defect is persistent. Other reported MRI abnormalities in single cases might be non-specific and include subtle cortical and subcortical atrophy (239), mild cerebellar atrophy (240), putaminal lesions (246), and a small corpus callosum (33). Increased choline and myoinositol levels and decreased N-acetyl aspartate were detected by MR-spectroscopy, and these abnormalities in brain metabolism were associated with the degree of dysmyelination according to MRI findings (247).


A recent study aimed to better define the spectrum of motor disability in MCT8 deficiency and to elucidate the neuroanatomic basis of the motor impairments using clinical observation and brain MRI in a cohort of 6 affected pediatric patients (248). T1- and T2-weighted brain MRI sequences revealed hypomyelination involving the subcortical U-fibers and periventricular white matter tracts that became more conspicuous over time in all 6 patients. In contrast, the callosal and cortical spinal tracts showed near normal myelination. Diffusion tensor imaging, performed in 3 of the patients, showed poor definition of the white matter association tracts relative to normal controls, suggesting the presence of subtle microstructural abnormalities. The same 3 subjects had a normal-appearing corpus callosum. These findings are consistent with the presence of dystonia in the MCT8 deficient patients studied. These imaging biomarkers suggest that rehabilitation efforts targeting dystonia may be more beneficial than those targeting spasticity in the prepubertal pediatric MCT8 deficiency population as the combination of hypotonia and dystonia presents a neurorehabilitation challenge for these patients and therapies directed only toward spasticity have commonly produced suboptimal responses (248).


TESTS IN TISSUES


Altered activity of mitochondrial complexes II and IV was identified in muscle biopsies from two cases (33, 249). It is unclear if this is due to the abnormal TH status of the muscle or to a yet unidentified effect of MCT8 on the mitochondria.


Cultured skin fibroblasts from males with MCT8 deficiency showed a significant reduction of T4 and T3 uptake while D2 enzymatic activity was higher, compared to fibroblasts from normal individuals (33, 234). Fibroblasts from carrier females gave results intermediate to those of affected males and normal individuals. Cellular T3-uptake of cell lines transfected with different mutant MCT8 molecules (235), demonstrated or predicted complete inactivation in about 2/3 of mutations, while in the remaining 1/3, T3-uptake ranged from 8.6 to 33% that of the WT MCT8. In particular, three missense mutations, S194F, L434W, and L598P showed significant residual transport capacity of more than 15% of normal MCT8, which may underlie the relatively milder phenotype observed in patients with these mutations (see section on Clinical Features and Course of the Disease, above).


Histological analysis of brain sections from a 30th gestational week male fetus and an 11-year-old boy with MCT8 deficiency was performed using as controls, brain tissue from a 30th and 28th gestational week male and female fetuses, respectively, and a 10-year-old girl and a 12-year-old boy (250). The MCT8-deficient fetus showed a delay in cortical and cerebellar development and myelination (Figure 11), loss of parvalbumin expression, abnormal calbindin-D28k content, impaired axonal maturation, and diminished biochemical differentiation of Purkinje cells. The 11-year-old boy showed altered cerebellar structure with deficient myelination, deficient synaptophysin and parvalbuminexpression, and abnormal calbindin-D28k expression.  This study showed that brain damage in MCT8 deficiency is diffuse, without evidence of focal lesions, that was present from fetal stages despite apparent normality at birth, and the deficient hypomyelination was found to persist at 11 years of age (250).


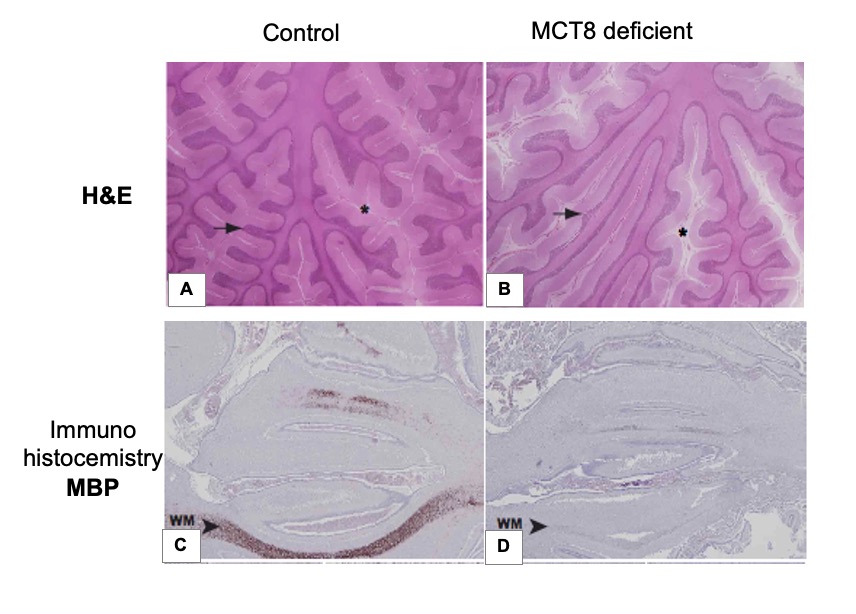
Figure 11. Structure and myelination of the fetal and juvenile cerebellum. Representative images showing hematoxylin-eosin (H&E) staining (A, B) and myelin basic protein (MBP) immunostaining (C, D) of tissue sections from the cerebellar vermis from 10-year-old control child (A), and 11-year-old MCT8 deficient child (B), control fetus and (C) MCT8-deficient fetus (D), both 30 weeks gestational age. In panels A and B, asterisks indicate the subarachnoid space in the cerebellum (wider in the MCT8-deficient subject) and arrows point to cerebellar folia (thinner size in the cerebellum of the MCT8-deficient boy). In panels C and D, arrowheads indicate immunopositive axons (lower proportion of immunopositive axons in the vermis from the MCT8-deficient fetus) WM, white matter. [Reproduced with permission from reference (250)].


GENETIC TESTING


By definition, a defect in the MCT8 gene is present in all patients. Genetic testing by sequencing is available in commercial laboratories and can detect nucleotide substitutions and small deletions and insertions. However, larger deletions and splice defects may require application of more in-depth genetic investigations, such as Southern blotting and haplotyping, available in research laboratories. Carrier testing for relatives at-risk and prenatal testing of pregnant carriers should be offered to families (251).


Animal Models of MCT8 Deficiency          


Mct8-deficient recombinant (Mct8KO) mice (19, 252) replicate the characteristic thyroid test abnormalities found in humans and, thus, helped in understanding the mechanisms responsible for the thyroid phenotype (253). Measurements of tissue T3 content showed the variable availability of the circulating hormone to tissues, depending on the redundant presence of TH cell membrane transporters. In Mct8KO mice, tissues such as the liver, that express other transporters than Mct8 (15), have high T3 concentrations reflecting the high levels in serum and are, therefore, “thyrotoxic” as demonstrated by an increase in the D1 enzymatic activity (Figure 12A). In accordance with a thyrotoxic state, serum cholesterol concentration is decreased and serum alkaline phosphatase is increased. In contrast, tissues with limited redundancy in cell membrane TH transporters, such as the brain (15), have decreased T3 content in Mct8KO mice, which together with the increase in D2, indicate “hypothyroidism” in this tissue (Figure 12B). The role of D2 is to maintain local levels of T3 in the context of TH deficiency and its activity is inversely regulated by TH availability (16). These findings of coexistent T3 excess and deficiency in the Mct8KO mouse tissues explain, in part, the mechanisms responsible for the tissue specific manifestation of TH deficiency and excess in humans with MCT8 deficiency.


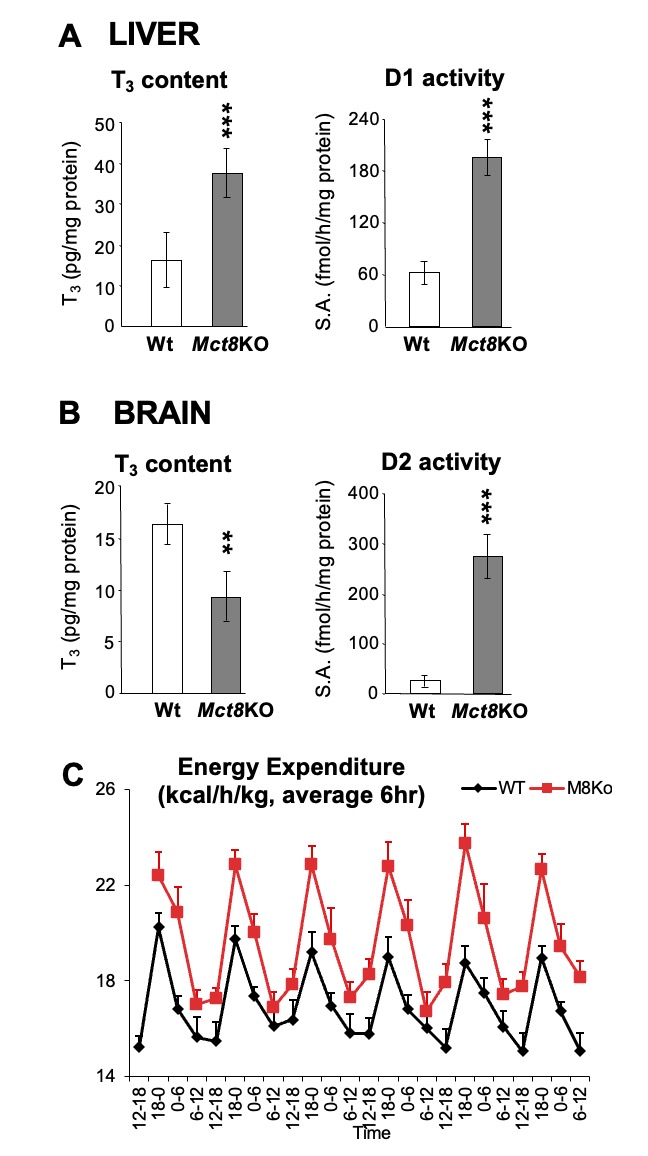
Figure 12. Data from Mct8KO vs Wt mice. A. T3 content and D1 enzymatic activity in liver. B. T3 content and D2 enzymatic activity in brain. Data from Mct8KO mice are represented as grey bars and those from Wt littermates are in open bars. ** p-value <0.01, *** p-value <0.001. C. Total energy expenditure (TEE) flow chart represented as 6h average over 6 days, Mct8KO mice are shown in red.


Metabolic and body composition studies showed that Mct8KO mice were leaner and had increased total energy expenditure (TEE) with increased food and water intake, while the activity level was normal (254). T3-treated Wt mice also showed increased food intake and TEE, and increased T3 content, TH action and increased glucose metabolism in skeletal muscle similar to Mct8KO mice. Thus, the hypermetabolic state in MCT8 deficiency is due to the high serum T3 and is responsible for the failure to maintain weight despite adequate caloric intake. Normalizing serum T3level by deleting deiodinase 1 in the combined Mct8Dio1KO mice was able to improve body composition and the metabolic alterations caused by the Mct8 deficiency (254). Treatment of adult mice with the TH analog diiodothyropropionic acid (DITPA), which enters cells independently of Mct8 transport, revealed amelioration of the thyrotoxic state in liver and improving the hypermetabolism of the Mct8KO mice (255), making this thyromimetic chemical suitable for the treatment of the hypermetabolism in patients with MCT8 deficiency.


Mct8 also has a role in TH efflux in the kidney and secretion from the thyroid gland (256, 257). The content of T4 and T3 in kidney is increased and their local actions increase D1 activity which enhances the local generation of T3. In the thyroid, Mct8 is localized at the basolateral membrane of thyrocytes. Thyroidal T4 and T3 content is increased in Mct8KO mice as is the rate of their secretion and appearance in serum is reduced (257).


These observations from the Mct8 deficient mice have helped understanding the mechanisms involved in producing the thyroid abnormalities in mice and humans. The increased D1 and D2 activities, stimulated by opposite states of intracellular TH availability, have an additive consumptive effect on T4 levels and result in increased T3 generation. The important contribution of D1 in maintaining a high serum T3 level is supported by the observation in mice deficient in both Mct8 and D1. These mice have a normal serum T3 and rT3 (258). The low serum T4 in Mct8 deficiency is not only the result of attrition through deiodination but also due to reduced secretion from the thyroid gland and possibly increased renal loss.


In MCT8 deficient subjects serum TSH is usually modestly increased, a finding that may be compatible with the decreased serum T4 concentration but not with the elevated serum T3 level. However, MCT8 is expressed in the hypothalamus and pituitary, and its inactivation likely interferes with the negative feedback of TH at both sites (259). In Mct8KO mice, hypothalamic TRH expression is markedly increased and high T3 doses are needed to suppress it, indicating T3 resistance particularly at the hypothalamic level.


Mct8KO mice have been valuable in testing thyromimetic compounds for their potential to bypass the Mct8 defect in tissues. One such TH analogue, DITPA has been tested. It was found to be effective in equal doses in the Mct8KO and Wt animal to replace centrally (pituitary and brain) and peripherally (liver) the TH requirements in animals rendered hypothyroid (260). In contrast, 2.5 and 8-fold higher doses of L-T4 and L-T3, respectively, were required to produce a central effect in the Mct8KO compared to that in Wt animal. These high doses of TH produced “hyperthyroidism” in peripheral tissues of the Mct8KO mice. Importantly, DITPA given to pregnant mice carrying Mct8-deficient embryos was able to cross the placenta and to have similar thyromimetic action on the expression of TH-dependent genes in brain of Mct8KO and Wt pups at similar DITPA serum levels (261). The similar serum TSH in Mct8KO vs Wt pups prenatally treated with DITPA, demonstrated better accessibility of DITPA at the pituitary compared to L-T4 thus making DITPA a candidate for the prenatal treatment of MCT8 deficiency (261).


Mct8KO mice were also used to test the possibility of gene therapy in MCT8 deficiency. Normal MCT8 was delivered using an AAV9 vector, injected either intravenously (IV) and/or intracerebroventricularly (ICV) into postnatal day 1 Mct8KO and Wt mice (262). Analysis of brains at 28 postnatal days, after L-T3 injection for four days showed that MCT8 delivery to the blood brain barriers by IV but not ICV injection is necessary for its proper function and resulted in increased T3 in the brain tissue triggering expression of known TH-regulated genes (262). These studies have introduced the consideration for gene therapy in the patients with MCT8 deficiency.


The lack of a neurological phenotype in Mct8KO mice limits their use as a model for understanding the mechanisms of the neurological manifestations in patients with MCT8 deficiency. If combined with deficiencies of other TH transporters in brain, Mct8 has the potential of producing an obvious neurological phenotype. Thus, mice deficient in both Mct8 and another TH transporter such as Lat2, Mct10 and Oatp1c1 were generated (225, 226, 228). From them, the Mct8/Oatp1c1 double KO (DKO) mice showed alterations in peripheral TH homeostasis that were similar to those in Mct8KO mice; while, uptake of both T3 and T4 into the brain of Mct8/Oatp1c1 DKO mice was strongly reduced (228). TH deprivation in the CNS of Mct8/Oatp1c1 DKO mice with marked decrease in brain TH content and in TH target gene expression manifested with delayed cerebellar development, reduced myelination and compromised differentiation of GABAergic interneurons in the cerebral cortex (228). Mct8/Oatp1c1 DKO mice displayed pronounced locomotor abnormalities and currently are being used to assess the pathogenic mechanisms underlying the neurologic phenotype in Mct8 deficiency and as models to test the effect treatment modalities on neurodevelopmental defects observed in humans.


Molecular Basis of the Disorder


In vitro studies using mutant MCT8 alleles as well as observations from animals deficient in Mct8, serve to explain the mechanism leading to the defect. All mutant MCT8 alleles tested by transfection or in fibroblast derived from affected individuals show absent or greatly reduced ability to transport iodothyronines, primarily T3 (235). Although MCT8 mRNA is widely expressed in human and rat tissues, including brain, heart, liver, kidney, adrenal gland, and thyroid (263, 264), repercussions due to its absence manifest primarily in tissues and cells in which MCT8 is the principal, if not unique TH transporter.


Analysis of the MCT8 mRNA expression pattern in the mouse brain by in situ hybridization revealed a distinct localization of this transporter in specific neuronal populations known to be highly dependent on proper TH supply, indicating that a defective MCT8 will perturb T3-dependent neuronal function. Moreover, high transcript levels for MCT8 were observed in choroid plexus structures and in capillary endothelial cells, suggesting that MCT8 also contributes to the passage of THs via the blood-brain barrier and/or via the blood-cerebrospinal fluid barrier (265, 266). In the thyroid, it has been demonstrated that MCT8 is involved in the secretion of TH into the bloodstream (257, 267).


The magnitude of serum T3 elevation does not correlate with the degree of T3 transport defect produced by a particular MCT8 mutation.  This is probably due to the important contribution of the concomitant perturbation in iodothyronine metabolism on the production of T3, as demonstrated in the Mct8KO mice (see the section above). Similarly, there is no correlation between the magnitude of serum T3 elevation or rT3 reduction in affected males compared to their carrier mothers (33). Some imperfect correlation does appear to exist between the degree of the MCT8 defect and clinical consequences. Patients that are least severely affected and capable of some locomotion have mutations with partial preservation of T3 transport function (see Clinical Features and Course of the Disease, above). In contrast, early death is more common in patients with mutations that completely disrupt the MCT8 molecule. However, it should be kept in mind that genetic factors, variability in tissue expression of MCT8, and other iodothyronine cell membrane transporters could be responsible for the lack of a stronger phenotype/genotype correlation. The possibility that MCT8 is involved in the transport of other ligands, or has functions other than TH transport, cannot be excluded.


There has been a great deal of effort in trying to understand how MCT8 transports TH into cells, and how MCT8 distinguishes TH substrates from structurally closely related compounds is not known. One starting point used was the fact that T3 is bound between a His-Arg clamp in the crystal structure of the T3 receptor/T3 complex.  To investigate whether such a motif might potentially be relevant for T3 recognition in MCT8, several mutations occurring in patients, or generated in vitro have been tested in combination with amino acid specific chemical modification. Molecular modeling has demonstrated a perfect fit of T3 poised into the substrate channel between His415 and Arg301 and observing the same geometry as in the T3 receptor (268). Similarly, cysteine residues Cys481 and Cys497 were found to probably be located at or near the substrate-recognition site in MCT8 (269). The question whether MCT8 functions as a monomer or as an oligomer has also been investigated. Although several mutations have been shown to affect oligomerization in vitro, currently, it is not known whether there is an obligatory functional need for dimerization of MCT8, or whether there is substrate-induced or constitutive oligomerization versus monomerization (270), However, different from the tight interaction of TH with receptors as ligand and with the deiodinases as substrate, the transporters have to achieve specific interactions with TH, while avoiding tight binding, as this would stall the transport process. Characterizing the mechanism is of fundamental interest and will be key for the design of specific MCT8 modulators.


Differential Diagnosis


MCT8-dependent THCMTD is syndromic, presenting a thyroid and a neuropsychomotor component. However, the majority of patients come to medical attention because of retarded development, and neurological deficits. Although the thyroid abnormalities are most characteristic, they escape detection by neonatal screening. TSH concentration is not elevated above the diagnostic cut off level and although T4 is commonly low, it more often accompanies premature births and low levels of TH-binding serum proteins. Studies in Mct8KO mice suggest that rT3 could turn out to be a good marker for the early detection of MCT8 defects in humans.


Hypotonia is an early manifestation, but is not specific. Reduced myelin, documented by brain MRI, places MCT8 in the category of other diseases showing reduced myelination, among them Pelizaeus–Merzbacher disease (PMD; OMIM# 312080). The latter is also X-linked, and is a leukodystrophy caused by an inborn error of myelin formation due to defects in the PLP1 gene located on Xq22. In fact, a survey of 53 families affected by hypomyelinating leukodystrophies of unknown etiology, classified as PMD, resulted in the identification of MCT8 gene mutations in 11% (244), and the affected subjects were subsequently found to have the typical thyroid test abnormalities. Patients with PMD do not exhibit the thyroid phenotype of MCT8 deficiency and their myelination defect is persistent, rather than transient.


All children above the age of 1 month found to have MCT8 gene mutations show the characteristic thyroid test abnormalities. This underscores the importance of performing thyroid tests in patients diagnosed with mental retardation or syndromic X-linked phenotypes suggestive of a MCT8 defect, prior to sequencing the MCT8 locus. Most useful is the finding of a high serum T3 and low rT3. A reduced (at the low limit or below normal) serum total or free T4, and a normal or slightly elevated TSH are also present. In cases with increased T3 due to other causes, calculating the ratio of T3/rT3 is helpful in differentiating them from cases of MCT8 defects, in whom the ratio will be above 10.


Treatment


Treatment options for patients with MCT8 gene mutations are currently limited (251). Supportive measures include the use of braces to prevent mal-positioned contractures that may ultimately require orthopedic surgery. Intensive physical, occupational, and speech therapies have subjective but limited objective beneficial effects. Diet should be adjusted to prevent aspiration and a permanent gastric feeding tube may be placed to avert malnutrition. Dystonia could be ameliorated with medications such as anticholinergics, L-DOPA carbamazepine and lioresol. Drooling might be improved with glycopyrolate or scopolamine. Seizures should be treated with standard anticonvulsants. When refractory to the latter, a ketogenic diet, as well as administration of supraphysiological doses of L-T4, has been successful.  Experience with such treatments is, however, limited to only a few cases.


Detection of low T4 levels by neonatal screening has led to treatment with L-T4 in several infants. As expected, no improvement has been noted when used in physiological doses, because of the impaired uptake of the hormone by MCT8-dependent tissues. Under these circumstances it would be logical to treat with supraphysiological doses of L-T4, thereby increasing the availability of TH to the brain. However, the presence of an already increased D1, as observed in Mct8 deficient mice (see Animal Models in a preceding section of this Chapter), is likely to aggravate the hypermetabolic state of the patient by generating more T3 from the exogenous L-T4. Therefore, high L-T4 dose treatment has been used in combination with propylthiouracil (PTU), which is a specific inhibitor of D1. This results in reduction of the conversion of T4 to T3 in peripheral tissues by D1, while it allows the local generation of T3 by D2 in tissues. Although this treatment allowed an increase in serum L-T4 level without increasing the hypermetabolism and weight loss, it did not improve the neuropsychomotor deficit (33, 241).


Other possible treatments that have been tested include the administration of the thyromimetic drug DITPA, that seems to be effectively transported into mouse brain in the absence of Mct8 (260) (see Animal Models in a preceding section of this Chapter). DITPA given to children with MCT8 deficiency in doses of 1–2 mg/kg/d fully normalizes the serum thyroid tests, and reduces the hypermetabolism with improvement in the nutritional status with no objective change in the neuropsychiatric deficit (271).


In vitro treatment with DITPA of oligodendrocytes derived from a human embryonic stem cell reporter line expressing MCT8 (272) was found to up-regulate oligodendrocytes differentiation transcription factors and myelin gene expression and to promote myelination of retinal ganglion axons in co-culture. Pharmacological and genetic blockade of MCT8 induced significant oligodendrocyte apoptosis, impairing myelination, and DITPA treatment was able to limit this effect (272). As MCT8 seems to be essential for TH transport in human oligodendrocytes development, DITPA has the potential to be a promising treatment for developmentally regulated myelination in AHDS (272).


Other TH metabolites, such as TRIAC and its precursor tetraiodothyroacetic acid (TETRAC) have been tested.Recently, a multicenter, open-label, single-arm, phase 2, clinical trial investigated the effectiveness and safety of oral TRIAC in male pediatric and adult patients with MCT8 deficiency assessed at baseline and after 12 months of TRIAC administered in a predefined escalating dose schedule at a dose ranging from 23–48 μg/kg per day (273). All serum thyroid tests decreased, including T3; TSH, total free T4, and reverse T3 further decreased from their already low baseline levels in patients with MCT8 deficiency.  While the reduction in serum T3 concentrations was associated with improvements in body weight, cardio-vascular status, and markers of TH action in different tissues, causality cannot be proven directly because the open-label study design did not include a control group. Moreover, there are concerns that the further reduction in circulating T3 concentrations under TRIAC treatment aggravates the hypothyroid state in the brain in individuals with MCT8 deficiency (273).


Another treatment option tested in vitro consists of the use of chemical and pharmacological chaperones on the expression and transport activity of several MCT8 mutant proteins. The chemical chaperone sodium phenylbutyrate (NaPB), has been used to treat patients with cystic fibrosis and urea cycle defects for extended periods of time. In vitro testing showed that NaPB could rescue the expression and activities of MCT8 mutations that retain some residual activity (274). Testing of another chemical chaperone, 4-phenylbutyric acid (PBA), demonstrated that it was effective in potentiating the T3 uptake in transiently transfected COS-1 cells with WT MCT8 and the F501Δ mutant, but only minor effects were observed in F501Δ fibroblasts (275). Thus, the applicability of chemical and pharmacological chaperones may be limited to only a small number of patients with certain mutations. In addition, because the magnitude of the effect of chaperone therapy strongly depends on the disease model, more extensive preclinical studies are warranted before clinically available chaperones should be considered as a treatment option in patients with MCT8 deficiency.


Treatments that reduce the high serum T3 level, including combining PTU with L-T4, DITPA or TRIAC, have all beneficial effect on the hypermetabolism and reduce weight loss. This often obviates the need for feeding through a G-tube. However, no demonstrable effect on the neuropsychomotor abnormalities has been observed even when treatment was initiated during infancy. It is noteworthy that none of the treatments discussed above have been initiated before the age of 6 months. It is possible that for any TH mediated treatment to be effective on brain development, it will have to be initiated before birth.  However, intra-amniotic treatment with L-T4 of an embryo beginning at 17 weeks of gestation failed to prevent the neurological complications, even though myelination proceeded normally (33). This suggests that earlier brain damage, unrelated to myelin formation, is involved and that treatment should begin at 10 weeks of gestation, when brain TH receptors becomes fully active (276).


Use of thyromimetic drugs is supported by the defect in the transport of authentic THs. However, it is possible that a deficiency in a different substrate or that the loss of a putative constitutive effect harbored by the intact MCT8, play a role in the observed brain morbidity.


THYROID HORMONE METABOLISM DEFECT


Recessive mutation in the SBP2 (SECISBP2) gene encoding selenocysteine insertion sequence-binding protein 2 is an inherited condition causing a TH metabolism defect (THMD). The mutations affect selenoprotein synthesis including the deiodinases, which are selenoenzymes. Only twelve families with this defect have been identified so far. Affected individuals present with short stature and characteristic thyroid test abnormalities with high serum T4, low T3, high rT3 and normal or slightly elevated serum TSH. In addition, they also have decreased serum selenium (Se) and decreased selenoprotein levels and activities in serum and tissues. The overall clinical phenotype is complex. Affected individuals may have delayed growth and puberty, and in severe cases failure to thrive, developmental delay, infertility, myopathy, hearing impairment, photosensitivity, and immune deficits.


Another inherited condition also reported to cause THMD is the mutation in the TRU-TCA1-1 gene encoding the selenocysteine transfer RNA (tRNASec), which has a role in selenoprotein synthesis. The affected individual had high serum T4, high rT3, normal T3, normal TSH with low Se level (277)


Mutations in the in selenocysteine synthase (SEPSECS) have also been identified, however affected individuals do not manifest abnormal thyroid function tests (278). Affected children manifest a complex neurodevelopmental and neurodegenerative disorder involving, among other features, microcephaly, delayed motor and intellectual development, spasticity, and seizures.


Intracellular Metabolism of TH


The requirement for TH varies among tissues, cell types, and the timing in development. In order to provide the proper intracellular hormone supply, TH entry into cells is controlled by membrane transporters, and further fine-tuned by its intracellular metabolism, regulated by three selenoprotein iodothyronine deiodinases (D1, D2, D3). D1 and D2 are 5’-iodothyronine deiodinases that catalyze TH activation by converting T4 to T3. D3, a 5-deiodinase is the main TH inactivator through conversion of T4 to rT3 and T3 to T2 (Figure 1B) (see other Endotext chapters for details)


Deiodinases are selenoproteins containing the rare amino acid selenocysteine (Sec), present in the active center of the molecule and required for their enzymatic activity. They are differentially expressed in tissues and in response to alterations in the intracellular environment, further regulated at the level of transcription, translation and metabolism (16). D2 activity can change very rapidly as its half-life is more than 15-fold shorter than that of D1 and D3. T4accelerates D2 inactivation through ubiquitination, a reversible process that can regenerate active D2 enzyme through de-ubiquitination.


Deiodinases share with other selenoproteins the synthesis through a unique mode of translation. The codon used for insertion of Sec is UGA, which under most circumstances serves as a signal to stop synthesis. This recoding of UGA is directed by the presence of a selenocysteine insertion sequence (SECIS) in the 3’-untranslated region of the selenoprotein messenger RNA. It is the SECIS-binding protein 2 (in short SBP2) that recognizes the SECIS and recruits an elongation factor (EFSec) and the specific selenocysteine transfer RNA (tRNASec) for addition of Sec at this particular UGA codon (Figure 13) (279).


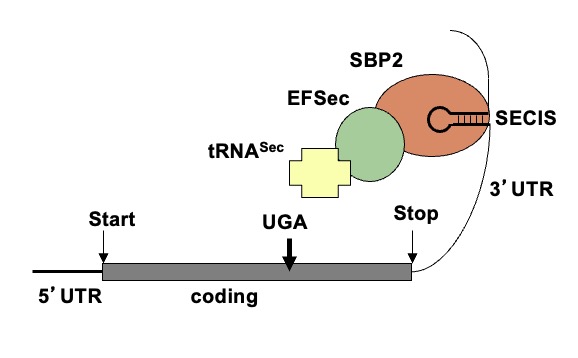
Figure 13. Components involved in Sec incorporation central in the synthesis of selenoproteins. Elements present in the mRNA of selenoproteins: an in frame UGA codon and Sec incorporation sequence (SECIS) element, a stem loop structure located in the 3’UTR (untranslated region). SBP2 binds SECIS and recruits the Sec-specific elongation factor (EFSec) and Sec-specific tRNA (tRNASec) thus resulting in the recoding of the UGA codon and Sec incorporation.


Etiology and Genetics


Abnormalities in TH metabolism have first been observed in humans as acquired condition, the “low T3 syndrome”, which occurs during non-thyroidal illness or starvation (see Chapter 14) (280). The first inherited disorder of TH metabolism in humans was reported in 2005 (8), and was found to be caused by a mutation in the SBP2 gene. Later, mutations in TRU-TCA1-1 gene were also reported to cause THMD in a single individual (277). Both genes are involved in selenoprotein synthesis, thus the mutations result in the defect of selenoproteins including the deiodinases. It is anticipated that mutations in other genes causing defective TH metabolism may have different phenotypes. So far, no humans have been reported with mutations in the deiodinase genes or in other proteins involved in selenoprotein synthesis.


Incidence and Inheritance  


The incidence of THMD caused by SBP2 deficiency is unknown. Ten additional families have been identified since the description of the initial two families (33, 281-285). The inheritance is autosomal recessive and males and females are equally affected. For this reason, the likelihood of being affected is less than that for autosomal dominant or X-linked conditions. The ethnic origins of the reported patients include Bedouin from Saudi Arabia, African, Irish, Brazilian, English, Japanese, Turkish and Argentinian individuals.


THE SBP2 GENE AND MUTATIONS


The human SBP2 gene, cloned in 2002, is located on chromosome 9 and encodes a protein of 854 amino acids widely expressed in most tissues (286). The C-terminal domain encompassing codons 399-774 of the protein is the minimal functional protein domain required for SECIS binding, ribosome binding and Sec incorporation (287), which is mandatory for SBP2 function. The role of the N-terminal region is not fully understood. In vitro studies have characterized a nuclear localization signal located in the N-terminal part and nuclear export signal in the C-terminal part. These domains enable SBP2 to shuttle between the nucleus and the cytoplasm (288), and they play a role in the function of SBP2 in the nucleus in vivo.


The finding of SBP2 defects was made possible by extensive genetic studies of a large family with three affected and four unaffected children (8). Although affected individuals had clinical evidence of abnormal TH metabolism, the sequences of the deiodinase genes, as well as those of genes encoding proteins involved in the ubiquitination and de-ubiquitination of the deiodinase 2 were normal. Subsequently, mutational analysis of the SBP2 gene revealed that the affected individuals were homozygous for a R540Q mutation, while both parents were heterozygous carriers. It is likely that the parents, which were not directly related but both members of the same Bedouin tribe, had a common ancestor. The affected child of the 2nd family, of mixed African/European background, was compound heterozygous for a paternal nonsense mutation (K438*), and a maternal mutation located in intron 8 (+29bp G->A), causing alternative splicing, but allowing 24% expression of a normal transcript. Since this initial report, at least ten more families with mutations in SBP2 have been identified (33, 281-285). Affected individuals harbor homozygous or compound heterozygous mutations. The mutations are summarized in Table 6 and are schematically represented in Figure 14. Among the 20 mutations identified, four are missense mutations located within the functional domain (codon 399-774) causing deleterious effects on protein function, while the other six result in a prematurely truncated protein disrupting the functional domain. Nine mutations cause either transcripts with abnormal splicing or truncations, affecting the N-terminal part of the protein. The generation of shorter isoforms translated from downstream ATGs at codons 139, 233, and 300, which all contain the intact C-terminal functional domain results in preservation of partial SBP2 function (281). One remaining mutation, Q782*, results in a truncated protein downstream of the functional domain 399-774 and is likely subject to nonsense-mediated decay.


Table 6. Mutations in SBP2 Gene

Family (# affected)

Mutations

Protein change

Comments on putative defect

Status

Ref.

1 (3)

c.1619G>A

R540Q

Predicted damaging (PolyPhen-2 score 1)

Homozygous

(8)

2 (1)

c.1312A>T

K438*

Truncated functional domain

Compound heterozygous

(8)

c.1283+29G>A Abnormal splicing

Frameshift

Truncated functional domain

     3 (1)

c.382C>T

R128*

Shorter isoformsa

Homozygous

(280)

4 (1)

c.358C>T

R120*

Shorter isoformsa

Compound heterozygous

(281)

c.2308C>T

R770*

Truncated functional domain

5 (1)

c.668delT

F223Ffs*32

Shorter isoforma

Compound heterozygous

(282)

c.881-155T>A, abnormal splicing

Frameshift

Shorter isoforma

6 (1)

c.2071T>C

C691R

Predicted damaging (PolyPhen-2 score 1)

Compound heterozygous

(282)

Intronic SNP, abnormal splicing

Frameshift

Shorter isoformsa


7 (1)

c.1529_1541dup CCAGCGCCCCACT

M515Qfs*48

Truncated functional domain


Compound heterozygous


(283)

c.235C>T

Q79*

Shorter isoformsa

8 (1)

c.800_801insA

K267Kfs*2

Shorter isoforma

Homozygous

(284)

9 (1)

c.589C>T

R197*

Shorter isoformsa

Compound heterozygous

(37)

c.2037G>T

E679D

Predicted damaging (PolyPhen-2 score 1)

10 (1)

c.2344C>T

Q782*

Truncated after functional domain, NMD

Compound heterozygous

(37)

c.2045_2048delAACA

K682Tfs*2

Truncated functional domain

11 (2)

c.1588A>G

T530A

Predicted damaging (PolyPhen-2 score 1)

Compound heterozygous

(37)

c.1711C>T

Q571*

Truncated functional domain

12 (1)

c.283delT

Y95Ifs*31

Shorter isoformsa

Compound heterozygous

(37)

c.589C>T

R197*

Shorter isoformsa

The nomenclature as transcript ID ENST00000375807.7 (854-amino acid long)

a Shorter isoform(s) generated from downstream ATG(s) (M139, M233, M300) containing C-terminal functional domain

NMD, nonsense mediated decay


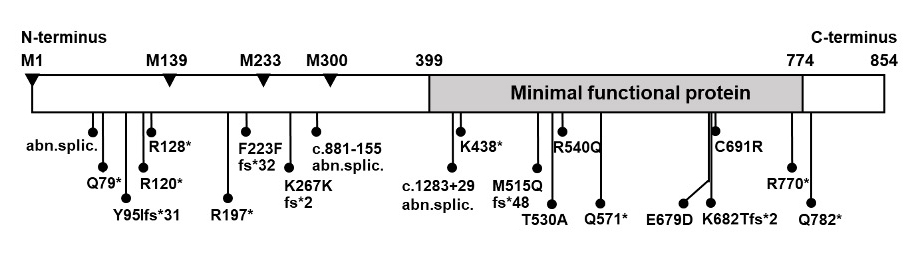
Figure 14. Schematic representation of human SBP2 showing the location of the mutations. Region of minimal functional protein encompassing codon 399-774 is showed in gray. The positions of methionine used as alternative translational initiation sites (M1, M139, M233, M300) are indicated as arrowheads.


Clinical Features and Course of the Disease


Age at presentation ranged from 4 months to 14 years, with the exception of one adult patient who had been identified at the age of 35 years (283). Delayed growth and bone maturation are the main manifestations that brought the affected individuals to medical attention. The severity of growth delay varies among patients. Some patients developed failure to thrive during infancy, while some presented with short stature during mid-childhood. Delayed motor and intellectual milestones were also recognized in seven cases (33, 282-284). Affected individuals started walking and talking around the age of 1.5 to 3 years. More severe developmental delay was found in one patient who started to walk, but still was unable to talk, at the age of 4.5 years (33).


Congenital myopathy with characteristic MRI findings was reported in five cases (282-285). A patient developed hypotonia and muscle weakness early in life and still had hip girdle weakness, impaired motor coordination, waddling gait, and positive Gower’s sign when she was 11 years old (282). The adult patient was reported to have delayed motor milestones during childhood and still had difficulty walking and running during adolescence, with genua valga and external rotation of the hip requiring orthotic footwear (283). The other two patients were evaluated for muscle weakness during mid-childhood (284, 285) while another came to medical attention at the age of 2 years (283).  


Sensorineural hearing loss was reported in three cases (282, 283) and conductive hearing loss following recurrent exudative otitis media was reported in one another case (284). Rotatory vertigo was also found (283, 284). Obesity was documented in two cases (282, 285). In addition, another two cases had an increased fat mass index (283), paradoxically associated with low fasting insulin with enhanced insulin sensitivity, elevated adiponectin levels, and a favorable lipid profile. One of them, a 2-year-old boy, had recurrent fasting nonketotic hypoglycemia with low insulin levels requiring supplemental enteral nutrition.


Pubertal development was documented only in 4 cases, while the information is not available in the remaining cases. In females, an affected girl had Tanner stage II breasts when she was 11 years old (33) and she had her menarche at the age of 13 years. In males, one affected boy was prepubertal at the age of 14 years but had a pubertal growth spurt within the following 2 years (8), another one was in Tanner stage III with a testicular volume of 10 mL at the age of 11.5 years (285). The only adult affected individual was reported to have normal pubertal development, despite unilateral orchidectomy at age 15 years following an episode of testicular torsion. He had infertility in adulthood and the investigations revealed azoospermia despite the presence of a sonographically normal remaining testis (283).  Other manifestations found in the adult patient were severe Raynaud disease, skin photosensitivity with evidence of enhanced UV-mediated oxidative DNA damage and mild reduction in red blood cell and total lymphocyte counts with impaired T cell proliferation and abnormal cytokine production (283). This, together with the variety of the aforementioned manifestations, suggests that the defects in the SBP2 gene result in a multi-organ involvement. The consequences of SBP2 deficiency could still be underestimated since the features associated with oxidative damage such as neoplasia, neurodegeneration and premature aging may develop later in life. A detailed longitudinal evaluation of affected individuals is needed to further understand and characterize the spectrum of the clinical manifestations in SBP2 deficiency.


Laboratory Findings  


The characteristic thyroid test abnormalities in subjects with SBP2 gene mutations are high total and free T4, low T3, high rT3, and a normal or slightly elevated serum TSH (8) (Figure 15A). In vivo studies assessing the hypothalamo-pituitary-thyroid axis show that compared to normal siblings, affected children require higher doses of L-T4 and higher serum concentrations of T3, but not T3, to reduce their TSH levels compared to unaffected siblings, suggesting impaired conversion of T4 to T3 (Figure 15B). None of the affected individuals was reported to have an enlarged thyroid gland on physical examination. Thyroid ultrasonography showed a normal thyroid gland in one patient (282)and a hypoplastic thyroid gland in another patient (284). Delay in bone age was reported in the majority of the patients investigated, except one patient who presented with obesity and a bone age of 11 years at the chronological age of 10 years (285).


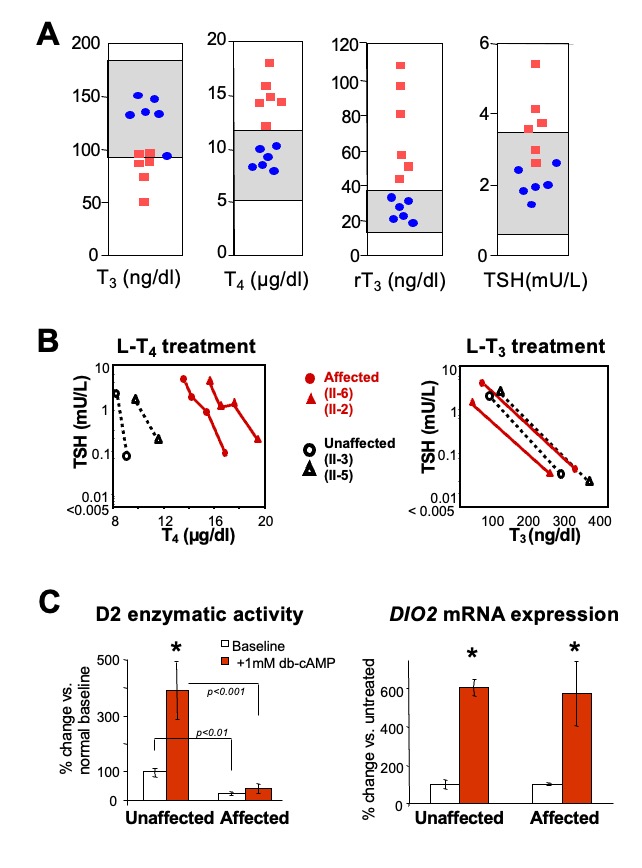
Figure 15. Thyroid function tests in several families with SBP2 deficiency studied in the authors’ laboratory. Grey regions indicate the normal range for the respective test. Affected individuals are represented as red squares and unaffected members of the families, as blue circles. B. In vivo studies: Serum TSH and corresponding serum T4 and T3 levels, before and during the oral administration of incremental doses of L-T4 and L-T3. Note the higher concentrations of T4 required to reduce serum TSH in the affected subjects; C. In vitro studies: Deiodinase 2 enzymatic activity and mRNA expression in cultured fibroblasts. Baseline and stimulated D2 activity is significantly lower in affected. There is a significant increase of DIO2 mRNA with dibutyryl cyclic adenosine monophosphate [(db)-cAMP)], in both unaffected and affected (*p <0.001) while there are no significant differences in baseline (db)-cAMP stimulated DIO2 mRNA in affected versus the unaffected.


Skin fibroblasts obtained from affected individuals and propagated in cell culture, showed reduced baseline and cAMP-stimulated D2 enzymatic activity, compared to fibroblasts from unaffected individuals. However, baseline and cAMP-stimulated D2 mRNA levels were not different compared to those in fibroblast from normal individuals (Figure 15C).


As SBP2 is epistatic to selenoprotein synthesis, SBP2 deficiency is expected to affect multiple selenoproteins. Indeed, serum concentrations of selenium, selenoprotein P and other selenoproteins are reduced, and skin fibroblasts have decreased D2 and glutathione peroxidase (Gpx) activities in affected individuals (8).


Thigh MRI of affected patients with muscle weakness showed muscle hypotrophy and increased signal in T1-weighted images suggesting of connective tissue / fatty infiltration in the thigh muscles, predominantly in the adductor magnus, biceps femoris and sartorius, with relative sparing of other muscle groups (282, 283, 285). This pattern is similar to that of individuals with myopathies caused by selenoprotein N1 (SEPN1) deficiency, suggesting that SEPN1 is also affected in the individuals with SBP2 deficiency. Detailed evaluation in the adult patient with multi-systemic involvement also demonstrated deficiencies in multiple selenoproteins: lack of testis-enriched selenoproteins resulting in failure of the latter stages of spermatogenesis and azoospermia, cutaneous deficiencies of antioxidant selenoenzymes causing increased cellular reactive oxygen species (ROS), and reduced selenoproteins in peripheral blood cells resulting in immune deficits (283).


Deficiencies of other selenoproteins of unknown function, such as SELH, SELT, SELW, SELI, were found and their consequences are as yet unknown (283). In some of these patients, multiple tissues and organs show damage mediated by reactive oxygen species, and it is conceivable that other pathologies linked to oxidative damage such as neoplasia, neurodegeneration, premature ageing, may manifest with time.


Molecular Basis of the Disorder


Clinical and laboratory investigations have established that the mutations in the SBP2 gene fully explain the observed abnormalities, as SBP2 is a major determinant in the incorporation of Sec during selenoprotein synthesis. Complete lack of SBP2 function is predicted to be lethal, as its immunodepletion eliminates Sec incorporation. The absence of lethality in the reported patients with SBP2 deficiency is attributed to the preservation of partial SBP2 activity and the hierarchy in the synthesis of selenoproteins.


The thyroid test abnormalities in subjects with SBP2 deficiency are consistent with a defect in TH metabolism due to the deficiency in deiodinases and have been found in all cases, even those with a relative mild phenotype. The mutant R540Q SBP2 behaves as a hypomorphic allele in in vitro studies using the corresponding R531Q mutation of the rat Sbp2 (289). The mutant molecule showed no binding to some, but not all SECIS elements, resulting in selective loss in the expression of a subset of selenoproteins. The affected child of another family was compound heterozygous and expressed ~24% of a normal transcript. In the case of the homozygous R128* mutation, smaller SBP2 isoforms translated from downstream ATGs were preserved which contained the intact C-terminus functional domains.


As the human selenoproteome comprises at least 25 selenoproteins (290, 291) it is not surprising that the phenotype of SBP2 deficiency is complex and goes beyond the thyroid test abnormalities that dominate the mild cases. The more severe phenotype reported in three families is due to a more extensive impairment in SBP2 function (292). In the patient with two nonsense mutations (282), the R770* mutation truncates the C-terminal functional domain in all the isoforms and likely abolishes SBP2 function. However, the R120* allele likely generates smaller functionally active SBP2 isoforms, but the overall amount would be less than that of the homozygous R128* patient (281), thus explaining the more severe phenotype. Low expression of functional SBP2 also explains the phenotype of the two patients from the United Kingdom. Increased proteasomal degradation was demonstrated for the C691R mutation, and Western blotting of skin fibroblasts from both probands showed lack of full length SBP2 protein expression (283)


THMD Caused by Mutation in the TRU-TCA1-1 Gene


Another inherited condition also reported to cause THMD is the mutation in the TRU-TCA1-1 gene encoding selenocysteine transfer RNA (tRNASec) (277), an essential molecule in the Sec-incorporation pathway. The first and only patient reported to date was found to have elevated serum T4 and rT3 levels, together with a normal serum T3, suggestive of impaired deiodinase activity, during the investigations for his abdominal pain, fatigue and muscle weakness. A low plasma selenium level was also found, together with undetectable red cell and plasma GPX, low plasma selenoprotein P (SEPP1), mild signaling intensity change in muscle imaging, and negligible SEPN1 expression in fibroblasts. However, SBP2 protein expression was normal and no mutation in the SBP2 gene was identified, leading to the suspicion of a defect in another gene involved in the selenoprotein synthesis pathway. A homozygous missense mutation in the TRU-TCA1-1 gene, resulting in the amino acid substitution C65G, was then identified in the proband and segregated with the phenotype in the family. Primary cells from the proband showed marked reduction of the mcm5Um isoform of tRNASec, needed mainly for the synthesis of stress-related selenoproteins, whereas the mcm5U isoform of tRNASec, mainly responsible for the synthesis of housekeeping selenoproteins, was relatively preserved.


Animal Models of THMD


To bypass the embryonic lethality of lacking Sbp2 (293), a global partial Sbp2 deficiency mouse model, Sbp2conditional knockout (Sbp2 iCKO) was generated using tamoxifen-inducible Cre-ER induced at P35 (294). The Sbp2iCKO mice replicate most of the characteristic thyroid function tests in patients, with high serum T4, rT3 and TSH, whereas serum T3 is normal (Figure 16A). The enzymatic activity of D1 in the liver, and the D2 enzymatic activity and Dio3 mRNA expression in the cerebrum were decreased in Sbp2 iCKO compared to Wt littermates (Figure 16B) (294). In addition to the affected selenoenzymes deiodinases, Sbp2 iCKO mice also had decreased expression and/or activity of other selenoproteins in the liver, cerebrum and serum (294). Decreased body weight was observed in Sbp2iCKO mice by 2 weeks after tamoxifen injection, similar to the failure-to-thrive phenotype in patients. Other phenotypes are being further investigated in Sbp2 iCKO mice in order to understand the mechanisms of SBP2 deficiency as a multi-organ syndrome.


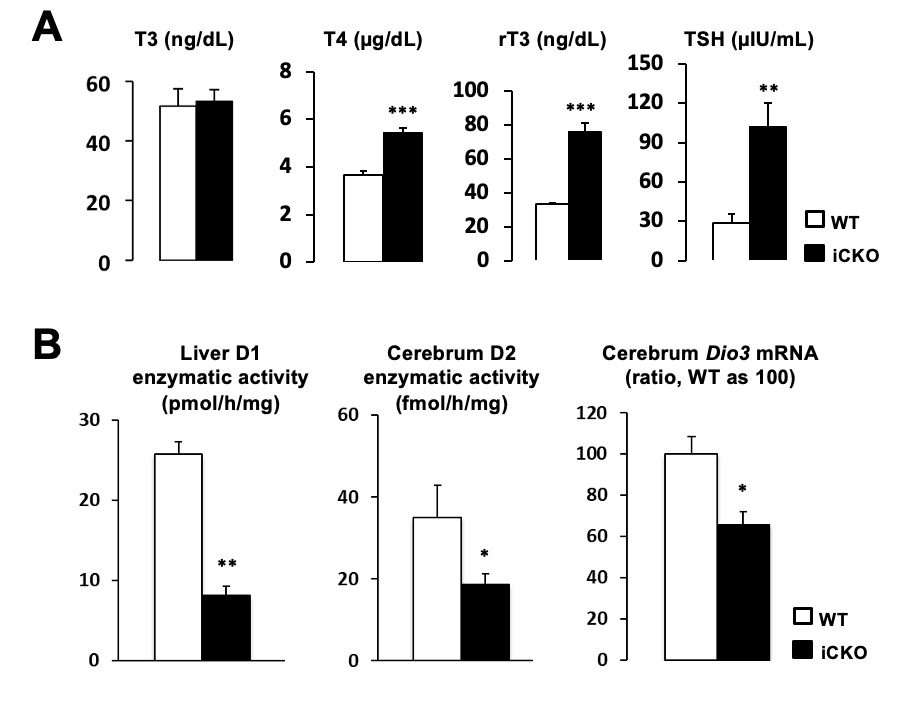
Figure 16. Data from Sbp2 iCKO vs Wt male mice. A. Serum TFTs in Sbp2 iCKO vs Wt male mice. B. Enzymatic activity of the D1 in liver, D2 in cerebrum and mRNA expression of Dio3 in cerebrum. Sbp2 iCKO mice represented as black bars and Wt littermates in open bars *, P <0.05; **, P <0.01; ***, P <0.001.


Differential Diagnosis


From the point of view of the thyroid phenotype, the combination of non-suppressed (normal or slightly elevated) serum TSH with increased concentrations of T4 and decreased T3 levels, is characteristic for the TH metabolism defects due to SBP2 deficiency. An elevated TSH and a general medical evaluation would help distinguishing the thyroid test abnormalities from those encountered in acute non-thyroidal illness, which in terms of iodothyronines could be similar. It is important to confirm the abnormalities by repeat testing several weeks or months apart because the consequence of a variety of non-thyroidal illnesses and some drugs are often transient. For a comprehensive thyroid evaluation, it is recommended to perform the entire panel of thyroid tests, including the free TH levels by dialysis, to exclude abnormalities in serum TH-binding proteins.


Because the clinical presentations of a THMD can be variable, broad and non-specific, including short stature and growth delay, the differential diagnosis can be extensive. Obtaining thyroid tests in first-degree relatives is important in determining the inheritance pattern of the phenotype, and identification of other affected individuals can help in categorizing the symptoms and signs. Given the recessive mode of inheritance, investigation of relatives is helpful in large families and when the patient has multiple siblings. For SBP2 deficiency in particular, measuring serum Se and SePP levels as well as GPX activity can avoid more invasive tests such are skin or muscle biopsies.


Finding a mutation in the SBP2 gene can be sufficient to provide a diagnosis if the mutation is predicted and/or demonstrated to result in a functionally defective protein or results in failure to synthesize the protein. Linkage analysis in smaller families is particularly helpful in excluding the involvement of SBP2. Failure to detect a SBP2 mutation by sequencing only coding regions of the gene is not sufficient, as putative mutations can exist in introns and regulatory elements. In this case, measuring the TSH responses to incremental doses of L-T4 and/or L-T3 could be used to confirm the biochemical diagnosis of TH metabolism defect, as described in the section on Laboratory Tests.


Treatment


Identification of the metabolic pathway responsible for the phenotype in these patients and the demonstration of defects in the SBP2 gene provided further insight into targeted treatment possibilities. Three such options, namely, administration of Se, TH and vitamin E were tested (270, 281, 295).


Administration of up to 400 mcg of selenium (295), in the form of selenomethionine but not selenite, normalized the serum selenium concentration but not selenoprotein P levels and did not restore the TH metabolism dysfunction. Se supplementation in form of selenomethionine contained in Se-rich yeast seems to be more effective as it can be incorporated nonspecifically into all circulating serum proteins (296), whereas selenite is metabolized and inserted as selenocysteine into the growing peptide chain of selenoproteins (297), therefore resulting in different Se bioavailability.


The effect of L-T3 administration was tested in three patients as it was demonstrated to equally suppress serum TSH concentration in affected and unaffected subjects, bypassing the defect (8). Delayed linear growth can be improved with L-T3 supplementation (281), but experience with TH administration in these patients is limited.


As increased oxidative stress state was documented in SBP2 deficiency, treatment with vitamin E was evaluated in a patient. The level of 7β-hydroxycholesterol, a free radical-mediated lipid peroxidation product, was found to be elevated in the patient at baseline, and was reduced to control levels after 2 weeks of α-tocopherol acetate treatment. The effect persisted during 2 years of treatment and at least 7 months after withdrawal (270). Other clinical features of SBP2 defects are treated symptomatically. Physical, occupational and speech therapy was required in some of these patients with developmental delay.


ACKNOWLEDGMENTS


Supported in part by Grants DK15070 and DK110322, from the National Institutes of Health.


Reproduced, in part, with permission from Dumitrescu AM, Korwutthikulrangsri M, and Refetoff S: Reduced sensitivity to Thyroid Hormone: Defects of Transport, Metabolism and Action (Chapter 64). In Werner & Ingbar's The Thyroid: A Fundamental and Clinical Text. Braverman, L.E., and Cooper D.S. (eds.), Wolters Kluver / Lippincott, Williams & Wilkins Publications, Philadelphia, PA., pp. 845-873, 2021, with permission.


REFERENCES


  1. Refetoff S, DeWind LT, DeGroot LJ. Familial syndrome combining deaf-mutism, stippled epiphyses, goiter, and abnormally high PBI: possible target organ refractoriness to thyroid hormone. J Clin Endocrinol Metab. 1967;27:279-94.
  2. Refetoff S, DeGroot LJ, Benard B, DeWind LT. Studies of a sibship with apparent hereditary resistance to the intracellular action of thyroid hormone. Metabolism. 1972;21:723-56.
  3. Sakurai A, Takeda K, Ain K, Ceccarelli P, Nakai A, Seino S, et al. Generalized resistance to thyroid hormone associated with a mutation in the ligand-binding domain of the human thyroid hormone receptor b. Proc Natl Acad Sci (USA). 1989;86:8977-81.
  4. Usala SJ, Tennyson GE, Bale AE, Lash RW, Gesundheit N, Wondisford FE, et al. A base mutation of the c-erbAb thyroid hormone receptor in a kindred with generalized thyroid hormone resistance. Molecular heterogeneity in two other kindreds. J Clin Invest. 1990;85:93-100.
  5. Refetoff S, Weiss RE, Usala SJ. The syndromes of resistance to thyroid hormone. Endocr Rev. 1993;14:348-99.
  6. Dumitrescu AM, Liao XH, Best TB, Brockmann K, Refetoff S. A Novel Syndrome Combining Thyroid and Neurological Abnormalities Is Associated with Mutations in a Monocarboxylate Transporter Gene. Am J Hum Genet. 2004 Jan;74(1):168-75. PubMed PMID: 14661163.
  7. Friesema EC, Grueters A, Biebermann H, Krude H, von Moers A, Reeser M, et al. Association between mutations in a thyroid hormone transporter and severe X-linked psychomotor retardation. Lancet. 2004 Oct 16;364(9443):1435-7. PubMed PMID: 15488219.
  8. Dumitrescu AM, Liao X-H, Abdullah SYM, Lado-Abeal J, Abdul-Majed F, Moeller LC, et al. Mutations in SECISBP2 result in abnormal thyroid hormone metabolism. Nat Genet. 2005 Nov;37(11):1247-52. PubMed PMID: 16228000.
  9. Bochukova E, Schoenmakers N, Agostini M, Schoenmakers E, Rajanayagam O, Keogh JM, et al. A Mutation in the Thyroid Hormone Receptor Alpha Gene. N Engl J Med. 2012 Jan 19;366(3):243-9. PubMed PMID: 22168587.
  10. Refetoff S, Bassett JH, Beck-Peccoz P, Bernal J, Brent G, Chatterjee K, et al. Classification and proposed nomenclature for inherited defects of thyroid hormone action, cell transport, and metabolism. Thyroid. 2014 Mar;24(3):407-9. PubMed PMID: 24588711. Epub 2014/03/05. eng.
  11. Refetoff S, Bassett JH, Beck-Peccoz P, Bernal J, Brent G, Chatterjee K, et al. Classification and proposed nomenclature for inherited defects of thyroid hormone action, cell transport, and metabolism. J Clin Endocrinol Metab. 2014 Mar;99(3):768-70. PubMed PMID: 24823702. Epub 2014/05/16. eng.
  12. Refetoff S, Bassett JH, Beck-Peccoz P, Bernal J, Brent G, Chatterjee K, et al. Classification and proposed nomenclature for inherited defects of thyroid hormone action, cell transport, and metabolism. Eur Thyroid J. 2014 Mar;3(1):7-9. PubMed PMID: 24847459. Epub 2014/05/23. eng.
  13. Bassett JH, Harvey CB, Williams GR. Mechanisms of thyroid hormone receptor-specific nuclear and extra nuclear actions. Mol Cell Endocrinol. 2003 Dec 31;213(1):1-11. PubMed PMID: 15062569.
  14. Flamant F, Cheng SY, Hollenberg AN, Moeller LC, Samarut J, Wondisford FE, et al. Thyroid Hormone Signaling Pathways: Time for a More Precise Nomenclature. Endocrinology. 2017 Jul 01;158(7):2052-7. PubMed PMID: 28472304.
  15. Friesema EC, Jansen J, Milici C, Visser TJ. Thyroid hormone transporters. Vitam Horm. 2005;70:137-67. PubMed PMID: 15727804.
  16. Bianco AC, Salvatore D, Gereben B, Berry MJ, Larsen PR. Biochemistry, cellular and molecular biology, and physiological roles of the iodothyronine selenodeiodinases. Endocr Rev. 2002;23(1):38-89. PubMed PMID: 11844744.
  17. Zhang J, Lazar MA. The mechanism of action of thyroid hormones. Annu Rev Physiol. 2000;62:439-66. PubMed PMID: 10845098.
  18. Yen PM, Ando S, Feng X, Liu Y, Maruvada P, Xia X. Thyroid hormone action at the cellular, genomic and target gene levels. Mol Cell Endocrinol. 2006 Feb 26;246(1-2):121-7. PubMed PMID: 16442701.
  19. Dumitrescu AM, Liao XH, Weiss RE, Millen K, Refetoff S. Tissue specific thyroid hormone deprivation and excess in Mct8 deficient mice. Endocrinology. 2006 Sep(147):4036-43. PubMed PMID: 16709608.
  20. van Mullem A, van Heerebeek R, Chrysis D, Visser E, Medici M, Andrikoula M, et al. Clinical phenotype and mutant TRalpha1. N Engl J Med. 2012 Apr 12;366(15):1451-3. PubMed PMID: 22494134. Epub 2012/04/13. eng.
  21. Weiss RE, Hayashi Y, Nagaya T, Petty KJ, Murata Y, Tunka H, et al. Dominant inheritance of resistance to thyroid hormone not linked to defects in the thyroid hormone receptors a or ß genes may be due to a defective co-factor. J Clin Endocrinol Metab. 1996 Dec;81(12):4196-203. PubMed PMID: 8954015.
  22. Weintraub BD, Gershengorn MC, Kourides IA, Fein H. Inappropriate secretion of thyroid stimulating hormone. Ann Intern Med. 1981;95:339-51.
  23. Ando S, Sarlis NJ, Krishan J, Feng X, Refetoff S, Zhang MQ, et al. Aberrant alternative splicing of thyroid hormone receptor in a TSH-secreting pituitary tumor is a mechanism for hormone resistance. Mol Endocrinol. 2001;15(9):1529-38.
  24. Tagami T, Usui T, Shimatsu A, Beniko M, Yamamoto H, Moriyama K, et al. Aberrant expression of thyroid hormone receptor beta isoform may cause inappropriate secretion of TSH in a TSH-secreting pituitary adenoma. J Clin Endocrinol Metab. 2011 Jun;96(6):E948-52. PubMed PMID: 21430027.
  25. Kaplan MM, Swartz SL, Larsen PR. Partial peripheral resistance to thyroid hormone. Am J Med. 1981;70(5):1115-21. PubMed PMID: 7234877.
  26. Usala SJ. Molecular diagnosis and characterization of thyroid hormone resistance syndromes. Thyroid. 1991;1:361-7.
  27. Beck-Peccoz P, Roncoroni R, Mariotti S, Medri G, Marcocci C, Brabant G, et al. Sex hormone-binding globulin measurement in patients with inappropriate secretion of thyrotropin (IST):Evidence against selective pituitary thyroid hormone resistance in nonneoplastic IST. J Clin Endocrinol Metab. 1990;71:19-25.
  28. Beck-Peccoz P, Chatterjee VKK. The variable clinical phenotype in thyroid hormone resistance syndrome. Thyroid. 1994;4:225-32.
  29. Collingwood TN, Adams M, Tone Y, Chatterjee VKK. Spectrum of transcriptional, dimerization, and dominant negative properties of twenty different mutant thyroid hormone ß-receptors in thyroid hormone resistance syndrome. Mol Endocrinol. 1994;8:1262-77.
  30. Weiss RE, Balzano S, Scherberg NH, Refetoff S. Neonatal detection of generalized resistance to thyroid hormone. JAMA. 1990;264:2245-50. PubMed PMID: 2120481.
  31. LaFranchi SH, Snyder DB, Sesser DE, Skeels MR, Singh N, Brent GA, et al. Follow-up of newborns with elevated screening T4 concentrations. J Pediatr. 2003 Sep;143(3):296-301. PubMed PMID: 14517508.
  32. Tajima T, Jo W, Fujikura K, Fukushi M, Fujieda K. Elevated free thyroxine levels detected by a neonatal screening system. Pediatr Res. 2009 Sep;66(3):312-6. PubMed PMID: 19542904.
  33. Personal-Observation.
  34. Takeda K, Sakurai A, DeGroot LJ, Refetoff S. Recessive inheritance of thyroid hormone resistance caused by complete deletion of the protein-coding region of the thyroid hormone receptor-ß gene. J Clin Endocrinol Metab. 1992 Jan;74(1):49-55. PubMed PMID: 1727829.
  35. Ono S, Schwartz ID, Mueller OT, Root AW, Usala SJ, Bercu BB. Homozygosity for a "dominant negative" thyroid hormone receptor gene responsible for generalized resistance to thyroid hormone. J Clin Endocrinol Metab. 1991;73:990-4.
  36. Ferrara AM, Onigata K, Ercan O, Woodhead H, WeissRE, Refetoff S. Homozygous thyroid hormone receptor beta gene mutations in resistance to thyroid hormone: Three new cases and review of the literature. J Clin Endocrinol Matab. 2012 Apr;97(4):1328-36. PubMed PMID: 22319036. eng.
  37. Usala SJ, Bale AE, Gesundheit N, Weinberger C, Lash RW, Wondisford FE, et al. Tight linkage between the syndrome of generalized thyroid hormone resistance and the human c-erbAb gene. Mol Endocrinol. 1988;2:1217-20.
  38. Weiss RE, Weinberg M, Refetoff S. Identical mutations in unrelated families with generalized resistance to thyroid hormone occur in cytosine-guanine-rich areas of the thyroid hormone receptor beta gene: Analysis of 15 families. J Clin Invest. 1993;91:2408-15.
  39. Zhou Z, Yang C, Lv F, Liu W, Yan S, Zang H, et al. Novel THRB mutation analysis in congenital hypothyroidism with thyroid dysgenesis. J Cell Biochem. 2018 Nov;119(11):9474-82. PubMed PMID: 30074255.
  40. Takeda K, Nemoto KI, Hayashi Y, Yamamoto M, Sakuta R, Kimura T, et al. Two Mutations in Thyroid Hormone Receptor Beta Gene (P453A and C36Y) in a Family with Resistance to Thyroid Hormone with Comorbid Myotonic Dystrophy. Thyroid. 2019 Apr;29(4):607-8. PubMed PMID: 30672388.
  41. Ando S, Sarlis NJ, Oldfield EH, Yen PM. Somatic mutation of TRbeta can cause a defect in negative regulation of TSH in a TSH-secreting pituitary tumor. J Clin Endocrinol Metab. 2001;86(11):5572-6. PubMed PMID: 11701737.
  42. Sadow P, Reutrakul S, Weiss RE, Refetoff S. Resistnace to thyroid hormone in the absence of mutations in the thyroid hormone receptor genes. Curr Opin Endocrinol Diabetes. 2000;7:253-9.
  43. Mitsuhashi T, Tennyson GE, Nikodem VM. Alternative splicing generates messages encoding rat c-erbA proteins that do not bind thyroid hormones. Proc Natl Acad Sci USA. 1988;85:5804-5.
  44. Macchia PE, Takeuchi Y, Kawai T, Cua K, Gauthier K, Chassande O, et al. Increased sensitivity to thyroid hormone in mice with complete deficiency of thyroid hormone receptor alpha. Proc Natl Acad Sci (USA). 2001 Jan 2;98(1):349-54. PubMed PMID: 11120878.
  45. Chassande O, Fraichard A, Gauthier K, Flamant F, Legrand C, Savatier P, et al. Identification of transcripts initiated from an internal promoter in the c-erb-Aa locus that encode inhibitors of retinoic acid receptor-a and triiodothyronine receptor activities. Mol Endocrinol. 1997;11:1278-90.
  46. Williams GR. Cloning and Characterization of Two Novel Thyroid Hormone Receptor beta Isoforms. Mol Cell Biol. 2000;20(22):8329-42.
  47. Tagami T, Yamamoto H, Moriyama K, Sawai K, Usui T, Shimatsu A, et al. Identification of a novel human thyroid hormone receptor beta isoform as a transcriptional modulator. Biochem Biophys Res Commun. 2010 Jun 11;396(4):983-8. PubMed PMID: 20470753. Epub 2010/05/18. eng.
  48. Gauthier K, Plateroti M, Harvey CB, Williams GR, Weiss RE, Refetoff S, et al. Genetic analysis reveals different functions for the products of the thyroid hormone receptor alpha locus. Mol Cell Biol. 2001;21(14):4748-60.
  49. Casas F, Rochard P, Rodier A, Cassar-Malek I, Marchal-Victorion S, Wiesner RJ, et al. A variant form of the nuclear triiodothyronine receptor c-ErbAalpha1 plays a direct role in regulation of mitochondrial RNA synthesis. Mol Cell Biol. 1999 Dec;19(12):7913-24. PubMed PMID: 10567517.
  50. Hodin RA, Lazar MA, Chin WW. Differential and tissue-specific regulation of the multiple rat c-erbA messenger RNA species by thyroid hormone. J Clin Invest. 1990;85:101-5.
  51. Macchia E, Nakai A, Janiga A, Sakurai A, Fisfalen ME, Gardner P, et al. Characterization of site-specific polyclonal antibodies to c-erbA peptides recognizing human thyroid hormone receptors a1, a2, and ß and native 3,5,3'-triiodothyronine receptor, and study of tissue distribution of the antigen. Endocrinology. 1990;126:3232-9.
  52. Strait KA, Schwartz HL, Perez-Castillo A, Oppenheimer JH. Relationship of c-erbA mRNA content to tissue triiodothyronine nuclear binding capacity and function in developing and adult rats. J Biol Chem. 1990;265:10514-21.
  53. Mannavola D, Moeller LC, Beck-Peccoz P, Persani L, Weiss RE, Refetoff S. A novel splice variant involving the 5' untranslated region of the thyroid hormone receptor ß1 (TRß1). J Endocrinol Invest. 2004;27:318-22.
  54. Frankton S, Harvey CB, Gleason LM, Fadel A, Williams GR. Multiple mRNA variants regulate cell-specific expression of human thyroid hormone receptor ß1. Mol Endocrinol. 2004;18(7):1931-642.
  55. Gauthier K, Chassande O, Platerotti M, Roux J-P, Legrand C, Rousset B, et al. Different functions for the thyroid hormone receptors TRa and TRß in the control of thyroid hormone production and post-natal development. EMBO J. 1999;18:623-31.
  56. Göthe S, Wang Z, Ng L, Kindblom JM, Campos barros A, Ohlsson C, et al. Mice devoid of all known thyroid hormone receptors are viable but exhibit disorders of the pituitary-thyroid axis, growth, and bone maturation. Genes & Dev. 1999;13:1329-41.
  57. Forman BM, Casanova J, Raaka BM, Ghysdael J, Samuels HH. Half-site spacing and orientation determines whether thyroid hormone and retinoic acid receptors and related factors bind to DNA response elements as monomers, homodimers, or heterodimers. Mol Endocrinol. 1992;6:429-42.
  58. Glass CK. Differential recognition of target genes by nuclear receptor monomers, dimers and heterodimers. Endocr Rev. 1994;15:391-407.
  59. Brent GA, Dunn MK, Harney JW, Gulick T, Larsen PR, Moore DD. Thyroid hormone aporeceptor represses T3-inducible promoters and blocks activity of the retinoic acid receptor. New Biologist. 1989;1:329-36.
  60. Koenig RJ. Thyroid hormone receptor coactivators and corepressors. Thyroid. 1998;8:703-13.
  61. Pazin MJ, Kadonaga JT. What's up and down with histone deacetylation and transcription? Cell. 1997;89:325-8.
  62. Yen PM, Darling DS, Carter RL, Forgione M, Umeda PK, Chin WW. Triiodothyronine (T3) decreases binding to DNA by T3-receptor homodimers but not receptor-auxiliary protein heterodimers. J Biol Chem. 1992;267:3565-8.
  63. Yu J, Koenig RJ. Regulation of Hepatocyte Thyroxine 5'-Deiodinase by T3 and Nuclear Receptor Coactivators as a Model of the Sick Euthyroid Syndrome. J Biol Chem. 2000;275(49):38296-301.
  64. Glass CK, Rose DW, Rosenfeld MG. Nuclear receptor coactivators. Current Opinion Cell Biol. 1997;9:222-32.
  65. Fondell JD, Guermah M, Malik S, Roeder RG. Thyroid hormone receptor-associated proteins and general positive cofactors mediate thyroid hormone receptor function in the absence of the TATA box-binding protein-associated factors of TFIID. Proc Natl Acad Sci USA. 1999;96:1959-64.
  66. Moeller LC, Cao X, Dumitrescu AM, Seo H, Refetoff S. Thyroid hormone mediated changes in gene expression can be initiated by cytosolic action of the thyroid hormone receptor beta through the phosphatidylinositol 3-kinase pathway. Nucl Recept Signal. 2006;4:e020. PubMed PMID: 16862226.
  67. Newell FW, Diddie KR. [Typical monochromacy, congenital deafness, and resistance to intracellular action of thyroid hormone (author's transl)]. Klinische Monatsblatter fur Augenheilkunde. 1977 Nov;171(5):731-4. PubMed PMID: 304503. Typische Monochromasie, angeborene Taubheit und Resistenz gegenuber der intrazellularen Wirkung des Thyreoideahormons.
  68. Jones I, Srinivas M, Ng L, Forrest D. The thyroid hormone receptor beta gene: structure and functions in the brain and sensory systems. Thyroid. 2003 Nov;13(11):1057-68. PubMed PMID: 14651789.
  69. Hayashi Y, Janssen OE, Weiss RE, Murata Y, Seo H, Refetoff S. The relative expression of mutant and normal thyroid hormone receptor genes in patients with generalized resistance to thyroid hormone determined by estimation of their specific messenger ribonucleic acid products. J Clin Endocrinol Metab. 1993;76(1):64-9. PubMed PMID: 8421105.
  70. Sakurai A, Miyamoto T, Refetoff S, DeGroot LJ. Dominant negative transcriptional regulation by a mutant thyroid hormone receptor ß in a family with generalized resistance to thyroid hormone. Mol Endocrinol. 1990;4:1988-94.
  71. Chatterjee VKK, Nagaya T, Madison LD, Datta S, Rantoumis A, Jameson JL. Thyroid hormone resistance syndrome.Inhibition of normal receptor function by mutant thyroid hormone receptors. J Clin Invest. 1991;87:1977-84.
  72. Yen PM, Sugawara A, Refetoff S, Chin WW. New insights on the mechanism(s) of the dominant negative effect of mutant thyroid hormone receptor in generalized resistance to thyroid hormone. J Clin Invest. 1992;90:1825-31.
  73. Piedrafita FJ, Ortiz MA, Pfahl M. Thyroid hormone receptor-ß mutants, associated with generalized resistance to thyroid hormone show defects in their ligand-sensitive repression function. Mol Endocrinol. 1995;9:1533-48.
  74. Au-Fliegner M, Helmer E, Casanova J, Raaka BM, Samuels HT. The conserved ninth C-terminal heptad in thyroid hormone and retinoic acid receptors mediates diverse responses by affecting heterodimer but not homodimer formation. Molecular and Cellular Biology. 1993;13(9):5725-37.
  75. Nagaya T, Jameson JL. Thyroid hormone receptor dimerization is required for the dominant negative inhibition by mutations that cause thyroid hormone resistance. J Biol Chem. 1993;268(21):15766-71.
  76. Yoh SM, Chatterjee VKK, Privalsky ML. Thyroid hormone resistance syndrome manifests as an aberrant interaction between mutant T3 receptor and transcriptional corepressor. Mol Endocrinol. 1997;11:470-80.
  77. Tagami T, Gu W-X, Peairs PT, West BL, Jameson JL. A novel natural mutation in the thyroid hormone receptor defines a dual functional domain that exchanges nuclear receptor corepressors and coactivators. Mol Endocrinol. 1998;12:1888-902.
  78. Collingwood TN, Rajanayagam O, Adams M, Wagner R, Cavaillès V, Kalkhoven E, et al. A natural transactivation mutation in the thyroid hormone ß receptor: Impaired interaction with putative transcriptional mediators. Proc Natl Acad Sci USA. 1997;94:248-53.
  79. Liu Y, Takeshita A, Misiti S, Chin WW, Yen PM. Lack of coactivator interaction can be a mechanism for dominant negative activity by mutant thyroid hormone receptors. Endocrinology. 1998;139:4197-204.
  80. Collingwood TN, Wagner R, Matthews CH, Clifton-Bligh RJ, Mark G, Rajanayagam O, et al. A role for helix 3 of the TRß ligand-binding domain in coactivator recruitment identified by characterization of a third cluster of mutations in resistance to thyroid hormone. Embo J. 1998;17(Aug 17):4760-70.
  81. Nagaya T, Madison LD, Jameson JL. Thyroid hormone receptor mutants that cause resistance to thyroid hormone. Evidence for receptor competition for DNA sequences in target genes. J Biol Chem. 1992;267:13014-9.
  82. Nagaya T, Fujieda N, Seo H. Requirement of corepressor binding of thyroid hormone receptor mutants for dominant negative inhibition. BiochemBiophys  Res Commun. 1998;247:620-3.
  83. Hayashi Y, Sunthornthepvarakul T, Refetoff S. Mutations of CpG dinucleotides located in the triiodothyronine (T3)-binding domain of the thyroid hormone receptor (TR) ß gene that appears to be devoid of natural mutations may not be detected because they are unlikely to produce the clinical phenotype of resistance to thyroid hormone. J Clin Invest. 1994;94:607-15.
  84. Korwutthikulrangsri M, Dosiou C, Dumitrescu AM, Refetoff S. A novel G385E variant in the cold region of T3-binding domain of THRB gene and investigations to assess its clinical significance. Europ Thyroid J. 2019:in press.
  85. Larsen CC, Dumitrescu A, Guerra-Arguero LM, Gallego-Suarez C, Vazquez-Mellado A, Vinogradova M, et al. Incidental Identification of a Thyroid Hormone Receptor Beta (THRB) Gene Variant in a Family with Autoimmune Thyroid Disease. Thyroid. 2013 Dec;23(12):1638-43. PubMed PMID: 23806029. Pubmed Central PMCID: 3868256. Epub 2013/06/29. eng.
  86. Rastinejad F, Perlmann T, Evans F, Sigler P. Structural determinants of nuclear receptor assembly on DNA direct repeats. Nature. 1995;375:203-11.
  87. Wagner RL, Apriletti JW, McGrath ME, West BL, Baxter JD, Fletterick RJ. A structural role for hormone in the thyroid hormone receptor. Nature. 1995;138:690-7.
  88. Marimuthu A, Feng W, Tagami T, Nguyen H, Jameson JL, Fletterick RJ, et al. TR surfaces and conformations required to bind nuclear receptor corepressor. Mol Endocrinol. 2002;16(2):271-86. PubMed PMID: 11818500.
  89. Huber BR, Desclozeaux M, West BL, Cunha-Lima ST, Nguyen HT, Baxter JD, et al. Thyroid hormone receptor-beta mutations conferring hormone resistance and reduced corepressor release exhibit decreased stability in the N-terminal ligand-binding domain. Mol Endocrinol. 2003 Jan;17(1):107-16. PubMed PMID: 12511610.
  90. Hayashi Y, Weiss RE, Sarne DH, Yen PM, Sunthornthepvarakul T, Marcocci C, et al. Do clinical manifestations of resistance to thyroid hormone correlate with the functional alteration of the corresponding mutant thyroid hormone-ß receptors? J Clin Endocrinol Metab. 1995;80:3246-56.
  91. Yagi H, Pohlenz J, Hayashi Y, Sakurai A, Refetoff S. Resistance to thyroid hormone caused by two mutant thyroid hormone receptor ß, R243Q and R243W, with marked impairment of function that cannot be explained by altered in-vitro 3,5,3'-triiodothyronine binding affinity. J Clin Endocrinol Metab. 1997;82:1608-14.
  92. Safer JD, Cohen RN, Hollenberg AN, Wondisford FE. Defective release of corepressor by hinge mutants of the thyroid hormone receptor found in patients with resistance to thyroid hormone. J Biol Chem. 1998;273:30175-82.
  93. Clifton-Bligh RJ, de Zegher F, Wagner RL, Collingwood TN, François I, Van Helvoirt M, et al. A novel mutation (R383H) in resistance to thyroid hormone syndrome predominantly impairs corepressor release and negative transcriptional regulation. Mol Endocrinol. 1998 May;12(5):609-21. PubMed PMID: 9605924.
  94. Flynn TR, Hollenberg AN, Cohen O, Menke JB, Usala SJ, Tollin S, et al. A novel C-terminal domain in the thyroid hormone receptor selectively mediates thyroid hormone inhibition. J Biol Chem. 1994;629(52):32713-6.
  95. Taniyama M, Ishikawa N, Momotani N, Ito K, Ban Y. Toxic multinodular goitre in a patient with generalized resistance to thyroid hormone who harbours the R429Q mutation in the thyroid hormone receptor beta gene. Clin Endocrinol (Oxf). 2001;54(1):121-4.
  96. Brucker-Davis F, Skarulis MC, Grace MB, Benichou J, Hauser P, Wiggs E, et al. Genetic and clinical features of 42 kindreds with resistance to thyroid hormone. The National Institutes of Health prospective study. Ann Intern Med. 1995;123:573-83.
  97. Safer JD, O'Connor MG, Colan SD, Srinivasan S, Tollin SP, Wondisford FE. The thyroid hormone receptor-ß gene mutation R383H is associated with isolated central resistance to thyroid hormone. J Clin Endocrinol Metab. 1999;84:3099-109.
  98. Lee S, Young BM, Wan W, Chan IH, Privalsky ML. A Mechanism for Pituitary-Resistance to Thyroid Hormone (PRTH) Syndrome: a Loss in Cooperative Coactivator Contacts by Thyroid Hormone Receptor (TR)[beta]2. Mol Endocrinol. 2011 Jul;25(7):1111-25. PubMed PMID: 21622532.
  99. Machado DS, Sabet A, Santiago LA, Sidhaye AR, Chiamolera MI, Ortiga-Carvalho TM, et al. A thyroid hormone receptor mutation that dissociates thyroid hormone regulation of gene expression in vivo. Proc Natl Acad Sci U S A. 2009 Jun 9;106(23):9441-6. PubMed PMID: 19439650.
  100. Alberobello AT, Congedo V, Liu H, Cochran C, Skarulis MC, Forrest D, et al. An intronic SNP in the thyroid hormone receptor beta gene is associated with pituitary cell-specific over-expression of a mutant thyroid hormone receptor beta2 (R338W) in the index case of pituitary-selective resistance to thyroid hormone. J Transl Med. 2011;9:144. PubMed PMID: 21871106. Pubmed Central PMCID: 3170239. Epub 2011/08/30. eng.
  101. Johansson C, Göthe S, Forrest D, Vennsrtöm B, Thorén P. Cardiovascular phenotype and temperature controlin mice lacking tyroid hormone receptor ß or both a1 and ß. Am J Physiol. 1999;276:H2006-H12.
  102. Gloss B, Trost SU, Bluhm WF, Swanson EA, Clark R, Winkfein R, et al. Cardiac Ion Channel Expression and Contractile Function in Mice with Deletion of Thyroid Hormone Receptor alpha or beta. Endocrinology. 2001;142(2):544-50.
  103. Kahaly GJ, Matthews CH, Mohr-Kahaly S, Richards CA, Chatterjee VK. Cardiac involvement in thyroid hormone resistance. J Clin Endocrinol Metab. 2002;87(1):204-122. PubMed PMID: 11788648.
  104. Lazar MA. Thyroid hormone receptors: multiple forms, multiple possibilities. Endocr Rev. 1993;14:184-93.
  105. Falcone M, Miyamoto T, Fierro-Renoy F, Nacchia E, DeGroot LJ. Antipeptide polyclonal antibodies specifically recognize each human thyroid hormone receptor isoform. Endocrinology. 1992;131:2419-29.
  106. Mixson AJ, Hauser P, Tennyson G, Renault JC, Bodenner DL, Weintraub BD. Differential expression of mutant and normal beta T3 receptor alleles in kindreds with generalized resistance to thyroid hormone. J Clin Invest. 1993;91:2296-300.
  107. Geffner ME, Su F, Ross NS, Hershman JM, Van Dop C, Menke JB, et al. An arginine to histidine mutation in codon 311 of the C-erbAß gene results in a mutant thyroid hormone receptor that does not mediate a dominant negative phenotype. J Clin Invest. 1993;91:538-46.
  108. Weiss RE, Stein MA, Duck SC, Chyna B, Phillips W, O'Brien T, et al. Low intelligence but not attention deficit hyperactivity disorder is associated with resistance to thyroid hormone caused by mutation R316H in the thyroid hormone receptor ß gene. J Clin Endocrinol Metab. 1994 Jun;78(6):1525-8. PubMed PMID: 8200958.
  109. Weiss RE, Marcocci C, Bruno-Bossio G, Refetoff S. Multiple genetic factors in the heterogeneity of thyroid hormone resistance. J Clin Endocrinol Metab. 1993;76:257-9.
  110. Vlaeminck-Guillem V, Margotat A, Torresani J, D'Herbomez M, Decoulx M, Wemeau JL. Resistance to thyroid hormone in a family with no TRß gene anomaly: pathogenic hypotheses. Ann Endocrinol (Paris). 2000;61(3):194-9.
  111. Parikh S, Ando S, Schneider A, Skarulis MC, Sarlis NJ, Yen PM. Resistance to thyroid hormone in a patient without thyroid hormone receptor mutations. Thyroid. 2002;12(1):81-6.
  112. Lado Abeal J, Albero Gamboa R, Araujo Vilar D, Barca Mallo O, Bernabeu Moron I, Calvo MT, et al. [Clinical and molecular study of five families with resistance to thyroid hormones.]. Med Clin (Barc). 2011 Nov 12;137(12):551-4. PubMed PMID: 21703645. Epub 2011/06/28. Estudio clinico y molecular de cinco familias con resistencia a la accion de las hormonas tiroideas. Spa.
  113. Macchia E, Lombardi M, Raffaelli V, Piaggi P, Macchia L, Scattina I, et al. Clinical and genetic characteristics of a large monocentric series of patients affected by thyroid hormone (Th) resistance and suggestions for differential diagnosis in patients without mutation of Th receptor beta. Clin Endocrinol (Oxf). 2014 Dec;81(6):921-8. PubMed PMID: 25040256.
  114. Reutrakul S, Sadow PM, Pannain S, Pohlenz J, Carvalho G, Macchia PE, et al. Search for abnormalities of nuclear corepressors, coactivators and a coregulator in families with resistance to thyroid hormone without thyroid hormone receptor ß or a genes mutations. J Clin Endocrinol Metab. 2000;85:3609-17.
  115. Mamanasiri S, Yesil S, Dumitrescu AM, Liao XH, Demir T, Weiss RE, et al. Mosaicism of a Thyroid Hormone Receptor (TR) Beta Gene Mutation in Resistance to Thyroid Hormone (RTH). J Clin Endocrinol Metab. 2006 Jun 27;91(9):3471-7. PubMed PMID: 16804041.
  116. Flamant F, Samarut J. Thyroid hormone receptors: lessons from knockout and knock-in mutant mice. Trends Endocrinol Metab. 2003 Mar;14(2):85-90. PubMed PMID: 12591179.
  117. Forrest D, Hanebuth E, Smeyne RJ, Evereds N, Stewart CL, Wehner JM, et al. Recessive resistance to thyroid hormone in mice lacking thyroid hormone receptor ß: evidence for tissue-specific modulation of receptor function. EMBO J. 1996;15:3006-15.
  118. Weiss RE, Forrest D, Pohlenz J, Cua K, Curran T, Refetoff S. Thyrotropin regulation by thyroid hormone in thyroid hormone receptor ß-deficient mice. Endocrinology. 1997;138:3624-9.
  119. Weiss RE, Murata Y, Cua K, Hayashi Y, Seo H, Refetoff S. Thyroid hormone action on liver, heart and energy expenditure in thyroid hormone receptor ß deficient mice. (Erratum, 141:4767, 2000). Endocrinology. 1998 Dec;139:4945-52. PubMed PMID: 9832432.
  120. Forrest D, Erway LC, Ng L, Altschuler R, Curran T. Thyroid hormone receptor ß is essential for development of auditory function. Nature Genet. 1996;13:354-7.
  121. Ng L, Hurley JB, Dierks B, Srinivas M, Salto C, Vennstrom B, et al. A thyroid hormone receptor that is required for the development of green cone photoreceptors. Nat Genet. 2001;27(1):94-8.
  122. Newell FW, Diddie KR. Typische Monochromasie, angeborene Taubheit und Resistenz gegenüber der intrazellulären Wikung des Thyroideahormons. Klin Mbl Augenheilk. 1977;171:731-4.
  123. Rüsch A, Erway LC, Oliver D, Vennström B, Forrest D. Thyroid hormone receptor ß-dependent expression of a potassium conductance in inner hair cells at the onset of hearing. Proc Natl Acad Sci (USA). 1998;95(26):15758-62.
  124. Abel ED, Boers ME, Pazos-Moura C, Moura E, Kaulbach H, Zakaria M, et al. Divergent roles for thyroid hormone receptor beta isoforms in the endocrine axis and auditory system. J Clin Invest. 1999;104:291-300.
  125. Mansouri A, Chawdhury K, Gruss P. Follicular cells of the thyroid gland require Pax8 gene function. Nature Genet. 1998;19:87-90. PubMed PMID: 9590297.
  126. Flamant F, Poguet AL, Plateroti M, Chassande O, Gauthier K, Streichenberger N, et al. Congenital Hypothyroid Pax8(-/-) Mutant Mice Can Be Rescued by Inactivating the TRalpha Gene. Mol Endocrinol. 2002;16(1):24-32.
  127. Hayashi Y, Mangoura D, Refetoff S. A mouse model of resistance to thyroid hormone produced by somatic gene transfer of a mutant thyroid hormone receptor. Mol Endocrinol. 1996;10:100-6.
  128. Kaneshige M, Kaneshige K, Zhu X-g, Dace A, Garrett L, Carter TA, et al. Mice with a targeted mutation in the thyroid hormone ß receptor gene exhibit impaired growth and resistanceto thyroid hormone. Proc Natl Acad Sci (USA). 2000;97:13209-14.
  129. Hashimoto K, Curty FH, Borges PP, Lee CE, Abel ED, Elmquist JK, et al. An unliganded thyroid hormone receptor causes severe neurological dysfunction. Proc Natl Acad Sci (USA). 2001;98:3998-4003.
  130. Weiss RE, Xu J, Ning G, Pohlenz J, O'Malley BW, Refetoff S. Mice deficient in the steroid receptor coactivator-1 (SRC-1) are resistant to thyroid hormone. EMBO J. 1999;18(7):1900-4. PubMed PMID: 10202153.
  131. Brown NS, Smart A, Sharma V, Brinkmeier ML, Greenlee L, Camper SA, et al. Thyroid hormone resistance and increased metabolic rate in the RXR-g-deficient mouse. J Clin Invest. 2000;106:73-9.
  132. Persani L, Borgato S, Romoli R, Asteria C, Pizzocardo A, Beck-Peccoz P. Changes in the degree of sialylation of carbohydrate chain modify the biological properties of circulating thyrotropin isoforms in various physiological and pathological states. J Clin Endocrinol Metab. 1998;83:2486-92.
  133. Bode HH, Danon M, Weintraub BD, Maloof F, Crawford JD. Partial target organ resistance to thyroid hormone. J Clin Invest. 1973;52:776-82.
  134. Tamagna EI, Carlson HE, Hershman JM, Reed AW. Pituitary and peripheral resistance to thyroid hormone. Clin Endocrinol. 1979;10:431-41.
  135. Bajorunas DR, Rosner W, Kourides IA. Use of bromocriptine in a patient with generalized resistance to thyroid hormone. J Clin Endocrinol Metab. 1984;58:731-5.
  136. Refetoff S, Salazar A, Smith TJ, Scherberg NH. The consequences of inappropriate treatment because of failure to recognize the syndrome of pituitary and peripheral tissue resistance to thyroid hormone. Metabolism. 1983;32:822-34. PubMed PMID: 6865780.
  137. Refetoff S, DeGroot LJ, Barsano CP. Defective thyroid hormone feedback regulation in the syndrome of peripheral resistance to thyroid hormone. J Clin Endocrinol Metab. 1980;51(1):41-5. PubMed PMID: 6769941.
  138. Kaplowitz PB, D'Ercole AJ, Utiger RD. Peripheral resistance to thyroid hormone in an infant. J Clin Endocrinol Metab. 1981;53:958-63.
  139. Murata Y, Refetoff S, Horwitz AL, Smith TJ. Hormonal regulation of glycosaminoglycan accumulation in fibroblasts from patients with resistance to thyroid hormone. J Clin Endocrinol Metab. 1983;57(6):1233-9. PubMed PMID: 6630416.
  140. Ceccarelli P, Refetoff S, Murata Y. Resistance to thyroid hormone diagnosed by the reduced response of fibroblasts to the triiodothyronine induced suppression of fibronectin synthesis. J Clin Endocrinol Metab. 1987;65(2):242-6. PubMed PMID: 3597704.
  141. Mäenpää J, Liewendahl K. Peripheral insensitivity to thyroid hormones in a euthyroid girl with goitre. Arch Dis Child. 1980;55:207-12.
  142. White P, Burton KA, Fowden AL, Dauncey MJ. Developmental expression analysis of thyroid hormone receptor isoforms reveals new insights into their essential functions in cardiac and skeletal muscles. Faseb J. 2001 Jun;15(8):1367-76. PubMed PMID: 11387234.
  143. Cooper DS, Ladenson PW, Nisula BC, Dunn JF, Chapman EM, Ridgway EC. Familial thyroid hormone resistance. Metabolism. 1982;31:504-9.
  144. Lamberg B-A, Liewendahl K. Thyroid hormone resistance. Ann Clin Res. 1980;12:243-53.
  145. Vandalem JL, Pirens G, Hennen G. Familial inappropriate TSH secretion: evidence suggesting a dissociated pituitary resistance to T3 and T4. J Endocrinol Invest. 1981;4:413-22.
  146. Lamberg BA, Sandström R, Rosengård S, Säarinen P, Evered DC. Sporadic and familial partial peripheral resistance to thyroid hormone. In: Harland WA, Orr JS, editors. Thyroid Hormone Metabolism. London: Academic Press; 1975. p. 139-61.
  147. Hauser P, Zametkin AJ, Martinez P, Vitiello B, Matochik JA, Mixson AJ, et al. Attention deficit-hyperactivity disorder in people with generalized resistance to thyroid hormone. N Engl J Med. 1993;328:997-1001.
  148. Weiss RE, Stein MA, Trommer B, Refetoff S. Attention-deficit hyperactivity disorder and thyroid function. J Pediatr. 1993;123:539-45.
  149. Elia J, Gulotta C, Rose SR, Martin G, Rapoport J. Thyroid function and attention-deficit hyperactivity disorder. J Am Acad Child Adolesc Psychiatry. 1994;33:169-72.
  150. Anselmo J, Cao D, Karrison T, Weiss RE, Refetoff S. Fetal loss associated with excess thyroid hormone exposure. Jama. 2004 Aug 11;292(6):691-5.
  151. Anselmo J, Scherberg NH, Dumitrescu AM, Refetoff S. Reduced Sensitivity to Thyroid Hormone as a Transgenerational Epigenetic Marker Transmitted Along the Human Male Line. Thyroid. 2019 Jun;29(6):778-82. PubMed PMID: 30938226.
  152. Weiss AH, Kelly JP, Bisset D, Deeb SS. Reduced L- and M- and increased S-cone functions in an infant with thyroid hormone resistance due to mutations in the THRbeta2 gene. Ophthalmic Genet. 2012 May 2. PubMed PMID: 22551329. Epub 2012/05/04. Eng.
  153. Lamberg BA. Congenital euthyroid goitre and partial peripheral resistance to thyroid hormones. Lancet. 1973;1:854-7.
  154. Bantle JP, Seeling S, Mariash CN, Ulstrom RA, Oppenheimer JH. Resistance to thyroid hormones: A disorder frequently confused with Graves' disease. Arch Intern Med. 1982;142:1867-71.
  155. Chait A, Kanter R, Green W, Kenny M. Defective thyroid hormone action in fibroblasts cultured from subjects with the syndrome of resistance to thyroid hormones. J Clin Endocrinol Metab. 1982;54:767-72.
  156. Ünlütürk U, Sriphrapradang C, Erdoğan MF, Emral R, Güldiken S, Refetoff S, et al. Management of differentiated thyroid cancer in the presence of resistance to thyroid hormone and TSH producing adenomas: A report of four cases and review of the literatures. J Clin Endocrinol Metab. 2013 Apr 3;98(6):2210-17. PubMed PMID: 23553855. Epub 2013/04/05. Eng.
  157. Schimmel M, Utiger R. Thyroidal and peripheral production of thyroid hormones:Review of recent findings and their clinical implications. Ann Intern Med. 1977;87:760-8.
  158. Gómez-Sáez JM, Fernández Castañer M, Navarro MA, Bonnin MR, Soler Ramón J, Roca A. Resistencia parcial a las hormonas tiroideas con bocio y eutiroidismo. Med Clin. 1981;76:412-6.
  159. Gheri RG, Bianchi R, Mariani G, Toccafondi R, Cappelli G, Brat A, et al. A new case of familial partial generalized resistance to thyroid hormone: Study of 3,5,3'-triiodothyronine (T3) binding to lymphocyte and skin fibroblast nuclei and in vivo conversion of thyroxine to T3. J Clin Endocrinol Metab. 1984;58:563-9.
  160. Sarne DH, Sobieszczyk S, Ain KB, Refetoff S. Serum thyrotropin and prolactin in the syndrome of generalized resistance to thyroid hormone:Responses to thyrotropin-releasing hormone stimulation and triiodothyronine suppression. J Clin Endocrinol Metab. 1990;70:1305-11.
  161. Kasai Y, Aritaki S, Utsunomiya M, Matsuno T. Twin sisters with Refetoff's Syndrome. J Jap Pediat Assoc. 1983;87:1203-12.
  162. Hughes IA, Ichikawa K, DeGroot LJ, John R, Jones MK, Hall R, et al. Non-adenomatous inappropriate TSH hypersecretion and euthyroidism requires no treatment. Clin Endocrinol. 1987;27:475-83. PubMed PMID: 3124992.
  163. Persani L, Asteria C, Tonacchera M, Vitti P, Chatterjee VKK, Beck-Peccoz P. Evidence for secretion of thyrotropin with enhanced bioactivity in syndromes of thyroid hormone resistance. J Clin Endocrinol Metab. 1994;78:1034-9.
  164. Barkoff MS, Kocherginsky M, Anselmo J, Weiss RE, Refetoff S. Autoimmunity in Patients with Resistance to Thyroid Hormone. J Clin Endocrinol Metab. 2010 Jul;95(7):3189-93. PubMed PMID: 20444926.
  165. David L, Blanc JF, Chatelain P, Rouchon A, François R. Goitre congéntal avec résistance péripherique partielle aux hormones thyroïdiennes.Ou syndrome de pseudo-hyperthyroïdie. Pédiatrie. 1979;34:443-9.
  166. Mitchell CS, Savage DB, Dufour S, Schoenmakers N, Murgatroyd P, Befroy D, et al. Resistance to thyroid hormone is associated with raised energy expenditure, muscle mitochondrial uncoupling, and hyperphagia. J Clin Invest. 2010 Apr;120(4):1345-54. PubMed PMID: 20237409.
  167. Pulcrano M, Palmieri EA, Ciulla DM, Campi I, Covelli D, Lombardi G, et al. Impact of resistance to thyroid hormone on the cardiovascular system in adults. J Clin Endocrinol Metab. 2009 Aug;94(8):2812-6. PubMed PMID: 19435825.
  168. Moeller LC, Dumitrescu AM, Walker RL, Meltzer PS, Refetoff S. Thyroid hormone responsive genes in cultured human fibroblasts. J Clin Endocrinol Metab. 2005 Feb;90(2):936-43. PubMed PMID: 15507505.
  169. Kunitake JM, Hartman N, Henson LC, Lieberman J, Williams DE, Wong M, et al. 3,5,3'-triiodothyroacetic acid therapy for thyroid hormone resistance. J Clin Endocrinol Metab. 1989;69:461-6.
  170. Magner JA, Petrick P, Menezes-Ferreira MM, Stelling M, Weintraub BD. Familial generalized resistance to thyroid hormones: report of three kindreds and correlation of patterns of affected tissues with the binding of [125I] triiodothyronine to fibroblast nuclei. J Endocrinol Invest. 1986;9:459-70.
  171. Beck-Peccoz P, Persani L, Faglia G. Glycoprotein hormone a-subunit in pituitary adenomas. Trends Endocrinol Metab. 1992;3:41-5.
  172. Mornex R, Tommasi M, Cure M, Farcot J, Orgiazzi J, Rousset B. Hyperthyroidie associee a un hypopituitarisme au cours de l'evolution d'une tumeur hypophysaire secretant T.S.H. Ann d'Endocrinol (Paris). 1972;33(4):390-6. PubMed PMID: 4197701.
  173. Hattori N, Ishihara T, Yamagami K, Shimatsu A. Macro TSH in patients with subclinical hypothyroidism. Clin Endocrinol (Oxf). 2015 Dec;83(6):923-30. PubMed PMID: 25388002. Epub 2014/11/13. Eng.
  174. Pohlenz J, Weiss RE, Macchia P, E., Pannain S, Lau IT, Ho H, et al. Five new families with resistance to thyroid hormone not caused by mutations in the thyroid hormone receptor ß gene. J Clin Endocrinol Metab. 1999;84:3919-28. PubMed PMID: 10566629.
  175. Shiwa T, Oki K, Awaya T, Nakanishi S, Yamane K. Resistance to thyroid hormone accompanied by graves' disease. Intern Med. 2011;50(18):1977-80. PubMed PMID: 21921380. Epub 2011/09/17. eng.
  176. Grasberger H, Ringkananont U, Croxson M, Refetoff S. Resistance to thyroid hormone in a patient with thyroid dysgenesis. Thyroid. 2005 Jul;15(7):730-3. PubMed PMID: 16053391.
  177. Borck G, Seewi O, Jung A, Schonau E, Kubisch C. Genetic causes of goiter and deafness: Pendred syndrome in a girl and cooccurrence of Pendred syndrome and resistance to thyroid hormone in her sister. J Clin Endocrinol Metab. 2009 Jun;94(6):2106-9. PubMed PMID: 19318451.
  178. Sabet A, Pallotta JA. Dichotomous responses to thyroid hormone treatment in a patient with primary hypothyroidism and thyroid hormone resistance. Thyroid. 2011 May;21(5):559-61. PubMed PMID: 21595517.
  179. Hassan AQ, Koh JT. Selective chemical rescue of a thyroid-hormone-receptor mutant, TRbeta (H435Y), identified in pituitary carcinoma and resistance to thyroid hormone. Angew Chem Int Ed Engl. 2008;47(38):7280-3. PubMed PMID: 18683837.
  180. Pappa T, Anselmo J, Mamanasiri S, Dumitrescu AM, Weiss RE, Refetoff S. Prenatal Diagnosis of Resistance to Thyroid Hormone and Its Clinical Implications. J Clin Endocrinol Metab. 2017 Oct 01;102(10):3775-82. PubMed PMID: 28938413.
  181. Asteria C, Rajanayagam O, Collingwood TN, Persani L, Romoli R, Mannavola D, et al. Prenatal diagnosis of thyroid hormone resistance. J Clin Endocrinol Metab. 1999;84:405-10.
  182. Weiss RE, Refetoff S. Treatment of resistance to thyroid hormone--primum non nocere. J Clin Endocrinol Metab. 1999;84(2):401-4.
  183. Safer JD, Colan SD, Fraser LM, Wondisford FE. A pituitary tumor in a patient with thyroid hormone resistance: a diagnostic dilemma. Thyroid. 2001;11(3):281-91. PubMed PMID: 11327621.
  184. Anselmo J, Refetoff S. Regression of a large goiter in a patient with resistance to thyroid hormone by every other day treatment with triiodothyronine. Thyroid. 2004 Jan;14(1):71-4. PubMed PMID: 15009917.
  185. Weiss RE, Stein MA, Refetoff S. Behavioral effects of liothyronine (L-T3) in children with attention deficit hyperactivity disorder in the presence an absence of resistance to thyroid hormone. Thyroid. 1997 jun;7(3):389-93. PubMed PMID: 9226208.
  186. Iglesias P, Diez JJ. [Therapeutic possibilities in patients with selective pituitary resistance to thyroid hormones.]. Med Clin (Barc). 2008 Mar 15;130(9):345-50. PubMed PMID: 18373914.
  187. Beck-Peccoz P, Piscitelli G, Cattaneo MG, Faglia G. Successful treatment of hyperthyroidism due to nonneoplastic pituitary TSH hypersecretion with 3,5,3'-triiodothyroacetic acid (TRIAC). J Endocrinol Invest. 1983;6:217-23.
  188. Radetti G, Persani L, Molinaro G, Mannavola D, Cortelazzi D, Chatterjee VKK, et al. Clinical and hormonal outcome after two years of triiodothyroacetic acid treatment in a child with thyroid hormone resistance. Thyroid. 1997;7:775-8.
  189. Takeda T, Suzuki S, Liu R-T, DeGroot LJ. Triiodothyroacetic acid has unique potential for therapy of resistance to thyroid hormone. J Clin Endocrinol Metab. 1995;80:2033-40.
  190. Kaneshige M, Suzuki H, Kaneshige K, Cheng J, Wimbrow H, Barlow C, et al. A targeted dominant negative mutation of the thyroid hormone alpha 1 receptor causes increased mortality, infertility, and dwarfism in mice. Proc Natl Acad Sci (USA). 2001;98:15095-100. PubMed PMID: 11734632.
  191. Tinnikov A, Nordstrom K, Thoren P, Kindblom JM, Malin S, Rozell B, et al. Retardation of post-natal development caused by a negatively acting thyroid hormone receptor alpha1. Embo J. 2002 Oct 1;21(19):5079-87. PubMed PMID: 12356724.
  192. Liu YY, Schultz JJ, Brent GA. A thyroid hormone receptor alpha gene mutation (P398H) Is associated with visceral adiposity and impaired catecholamine-stimulated lipolysis in mice. J Biol Chem. 2003 Jul 16;278:38913-20. PubMed PMID: 12869545.
  193. Quignodon L, Vincent S, Winter H, Samarut J, Flamant F. A Point Mutation in the Activation Function 2 Domain of Thyroid Hormone Receptor {alpha}1 Expressed after CRE-Mediated Recombination Partially Recapitulates Hypothyroidism. Mol Endocrinol. 2007 Oct;21(10):2350-60. PubMed PMID: 17622582.
  194. van Gucht ALM, Moran C, Meima ME, Visser WE, Chatterjee K, Visser TJ, et al. Resistance to Thyroid Hormone due to Heterozygous Mutations in Thyroid Hormone Receptor Alpha. Curr Top Dev Biol. 2017;125:337-55. PubMed PMID: 28527577.
  195. Espiard S, Savagner F, Flamant F, Vlaeminck-Guillem V, Guyot R, Munier M, et al. A novel mutation in THRA gene associated with an atypical phenotype of resistance to thyroid hormone. J Clin Endocrinol Metab. 2015 Jun 2:jc20151120. PubMed PMID: 26037512.
  196. Korkmaz O, Ozen S, Ozdemir TR, Goksen D, Darcan S. A novel thyroid hormone receptor alpha gene mutation, clinic characteristics, and follow-up findings in a patient with thyroid hormone resistance. Hormones (Athens). 2019 Jon;18(2):223-7. PubMed PMID: 30747412.
  197. Moran C, Agostini M, McGowan A, Schoenmakers E, Fairall L, Lyons G, et al. Contrasting Phenotypes in Resistance to Thyroid Hormone Alpha Correlate with Divergent Properties of Thyroid Hormone Receptor alpha1 Mutant Proteins. Thyroid. 2017 Jul;27(7):973-82. PubMed PMID: 28471274. Pubmed Central PMCID: PMC5561448.
  198. Moran C, Agostini M, Visser WE, Schoenmakers E, Schoenmakers N, Offiah AC, et al. Resistance to thyroid hormone caused by a mutation in thyroid hormone receptor (TR)alpha1 and TRalpha2: clinical, biochemical, and genetic analyses of three related patients. Lancet Diabetes Endocrinol. 2014 Jun 23. PubMed PMID: 24969835. Epub 2014/06/28. Eng.
  199. Moran C, Schoenmakers N, Agostini M, Schoenmakers E, Offiah A, Kydd A, et al. An adult female with resistance to thyroid hormone mediated by defective thyroid hormone receptor alpha. J Clin Endocrinol Metab. 2013 Nov;98(11):4254-61. PubMed PMID: 23940126. Epub 2013/08/14. eng.
  200. Tylki-Szymanska A, Acuna-Hidalgo R, Krajewska-Walasek M, Lecka-Ambroziak A, Steehouwer M, Gilissen C, et al. Thyroid hormone resistance syndrome due to mutations in the thyroid hormone receptor alpha gene (THRA). Journal of medical genetics. 2015 May;52(5):312-6. PubMed PMID: 25670821.
  201. van Gucht AL, Meima ME, Zwaveling-Soonawala N, Visser WE, Fliers E, Wennink JM, et al. Resistance to Thyroid Hormone Alpha in an 18-Month-Old Girl: Clinical, Therapeutic, and Molecular Characteristics. Thyroid. 2016 Mar;26(3):338-46. PubMed PMID: 26782358.
  202. van Gucht ALM, Meima ME, Moran C, Agostini M, Tylki-Szymanska A, Krajewska MW, et al. Anemia in Patients With Resistance to Thyroid Hormone alpha: A Role for Thyroid Hormone Receptor alpha in Human Erythropoiesis. J Clin Endocrinol Metab. 2017 Sep 01;102(9):3517-25. PubMed PMID: 28911146.
  203. Demir K, van Gucht AL, Buyukinan M, Catli G, Ayhan Y, Nijat Bas V, et al. Diverse Genotypes and Phenotypes of Three Novel Thyroid Hormone Receptor Alpha Mutations. J Clin Endocrinol Metab. 2016 May 4:jc20161404. PubMed PMID: 27144938.
  204. Moran C, Chatterjee K. Resistance to Thyroid Hormone alpha-Emerging Definition of a Disorder of Thyroid Hormone Action. J Clin Endocrinol Metab. 2016 Jul;101(7):2636-9. PubMed PMID: 27381958.
  205. Mittag J, Wallis K, Vennstrom B. Physiological consequences of the TRalpha1 aporeceptor state. Heart Fail Rev. 2010 Mar;15(2):111-5. PubMed PMID: 19009345. Epub 2008/11/15. eng.
  206. Hennemann G, Docter R, Friesema EC, de Jong M, Krenning EP, Visser TJ. Plasma membrane transport of thyroid hormones and its role in thyroid hormone metabolism and bioavailability. Endocr Rev. 2001 Aug;22(4):451-76. PubMed PMID: 11493579.
  207. Ekins R. The free hormone hypothesis and measurement of free hormones. Clin Chem. 1992;38:1289-93.
  208. Friesema EC, Docter R, Moerings EP, Stieger B, Hagenbuch B, Meier PJ, et al. Identification of thyroid hormone transporters. Biochem Biophys Res Commun. 1999 Jan 19;254(2):479-501. PubMed PMID: 9918867.
  209. van der Putten HH, Friesema EC, Abumrad NA, Everts ME, Visser TJ. Thyroid hormone transport by the rat fatty acid translocase. Endocrinology. 2003 Apr;144(4):1315-23. PubMed PMID: 12639914.
  210. Mitchell AM, Tom M, Mortimer RH. Thyroid hormone export from cells: contribution of P-glycoprotein. J Endocrinol. 2005 Apr;185(1):93-8. PubMed PMID: 15817830. Epub 2005/04/09. eng.
  211. Taylor PM, Ritchie JW. Tissue uptake of thyroid hormone by amino acid transporters. Best Pract Res Clin Endocrinol Metab. 2007 Jun;21(2):237-51. PubMed PMID: 17574006. Epub 2007/06/19. eng.
  212. Hagenbuch B. Cellular entry of thyroid hormones by organic anion transporting polypeptides. Best Pract Res Clin Endocrinol Metab. 2007 Jun;21(2):209-21. PubMed PMID: 17574004. Epub 2007/06/19. eng.
  213. Pizzagalli F, Hagenbuch B, Stieger B, Klenk U, Folkers G, Meier PJ. Identification of a novel human organic anion transporting polypeptide as a high affinity thyroxine transporter. Mol Endocrinol. 2002 Oct;16(10):2283-96. PubMed PMID: 12351693. Epub 2002/09/28. eng.
  214. Visser WE, Friesema EC, Jansen J, Visser TJ. Thyroid hormone transport by monocarboxylate transporters. Best Pract Res Clin Endocrinol Metab. 2007 Jun;21(2):223-36. PubMed PMID: 17574005.
  215. Friesema EC, Ganguly S, Abdalla A, Manning Fox JE, Halestrap AP, Visser TJ. Identification of monocarboxylate transporter 8 as a specific thyroid hormone transporter. J Biol Chem. 2003 Oct 10;278:40128-35. PubMed PMID: 12871948.
  216. Friesema EC, Jansen J, Jachtenberg JW, Visser WE, Kester MH, Visser TJ. Effective cellular uptake and efflux of thyroid hormone by human monocarboxylate transporter 10. Mol Endocrinol. 2008 Jun;22(6):1357-69. PubMed PMID: 18337592.
  217. Friesema EC, Kuiper GG, Jansen J, Visser TJ, Kester MH. Thyroid hormone transport by the human monocarboxylate transporter 8 and its rate-limiting role in intracellular metabolism. Mol Endocrinol. 2006 Nov;20(11):2761-72. PubMed PMID: 16887882.
  218. Stromme P, Groeneweg S, Lima de Souza EC, Zevenbergen C, Torgersbraten A, Holmgren A, et al. Mutated Thyroid Hormone Transporter OATP1C1 Associates with Severe Brain Hypometabolism and Juvenile Neurodegeneration. Thyroid. 2018 Nov;28(11):1406-15. PubMed PMID: 30296914.
  219. Papadimitriou A, Dumitrescu AM, Papavasiliou A, Fretzayas A, Nicolaidou P, Refetoff S. A novel monocarboxylate transporter 8 gene mutation as a cause of severe neonatal hypotonia and developmental delay. Pediatrics. 2008 Jan;121(1):e199-202. PubMed PMID: 18166539.
  220. Schwartz CE, Stevenson RE. The MCT8 thyroid hormone transporter and Allan-Herndon-Dudley syndrome. Best Pract Res Clin Endocrinol Metab. 2007 Jun;21(2):307-21. PubMed PMID: 17574010.
  221. Frints SG, Lenzner S, Bauters M, Jensen LR, Van Esch H, des Portes V, et al. MCT8 mutation analysis and identification of the first female with Allan-Herndon-Dudley syndrome due to loss of MCT8 expression. Eur J Hum Genet. 2008 Sept;16(9):1029-37. PubMed PMID: 18398436.
  222. Allan W, Herndon CN, Dudley FC. Some examples of the inheritance of mental deficiency: apparently sex-linked idiocy and microcephaly. Am J Ment Defic. 1944;48:325-34.
  223. Schwartz CE, Ulmer J, Brown A, Pancoast I, Goodman HO, Stevenson RE. Allan-Herndon syndrome. II. Linkage to DNA markers in Xq21. Am J Hum Genet. 1990 Sep;47(3):454-8. PubMed PMID: 2393020.
  224. Schwartz CE, May MM, Carpenter NJ, Rogers RC, Martin J, Bialer MG, et al. Allan-Herndon-Dudley Syndrome and the Monocarboxylate Transporter 8 (MCT8) Gene. Am J Hum Genet. 2005 Jul;77(1):41-53. PubMed PMID: 15889350.
  225. Braun D, Wirth EK, Wohlgemuth F, Reix N, Klein MO, Gruters A, et al. Aminoaciduria, but normal thyroid hormone levels and signalling, in mice lacking the amino acid and thyroid hormone transporter Slc7a8. Biochem J. 2011 Oct 15;439(2):249-55. PubMed PMID: 21726201. Epub 2011/07/06. eng.
  226. Muller J, Mayerl S, Visser TJ, Darras VM, Boelen A, Frappart L, et al. Tissue-specific alterations in thyroid hormone homeostasis in combined Mct10 and Mct8 deficiency. Endocrinology. 2014 Jan;155(1):315-25. PubMed PMID: 24248460. Epub 2013/11/20. eng.
  227. Mayerl S, Visser TJ, Darras VM, Horn S, Heuer H. Impact of oatp1c1 deficiency on thyroid hormone metabolism and action in the mouse brain. Endocrinology. 2012 Mar;153(3):1528-37. PubMed PMID: 22294745. Epub 2012/02/02. eng.
  228. Mayerl S, Muller J, Bauer R, Richert S, Kassmann CM, Darras VM, et al. Transporters MCT8 and OATP1C1 maintain murine brain thyroid hormone homeostasis. J Clin Invest. 2014 May;124(5):1987-99. PubMed PMID: 24691440. Pubmed Central PMCID: 4001533. Epub 2014/04/03. eng.
  229. Lafreniere RG, Carrel L, Willard HF. A novel transmembrane transporter encoded by the XPCT gene in Xq13.2. Hum Mol Genet. 1994 Jul;3(7):1133-9. PubMed PMID: 7981683.
  230. Halestrap AP, Meredith D. The SLC16 gene family-from monocarboxylate transporters (MCTs) to aromatic amino acid transporters and beyond. Pflugers Arch. 2004 Feb;447(5):619-28. PubMed PMID: 12739169.
  231. Korwutthikulrangsri M, Raimondi C, Dumitrescu AM, editors. A novel compound heterozygous SBP2 gene mutations in a boy with developmental delay and failure to thrive The 13th International Workshop on Resistance to Thyroid Hormone; Sept 2018; Doorn, Netherlands.
  232. Kleinau G, Schweizer U, Kinne A, Kohrle J, Gruters A, Krude H, et al. Insights into molecular properties of the human monocarboxylate transporter 8 by combining functional with structural information. Thyroid Res. 2011;4 Suppl 1:S4. PubMed PMID: 21835051. Pubmed Central PMCID: 3155110. Epub 2011/08/13. eng.
  233. Holden KR, Zuniga OF, May MM, Su H, Molinero MR, Rogers RC, et al. X-linked MCT8 gene mutations: characterization of the pediatric neurologic phenotype. J Child Neurol. 2005 Oct;20(10):852-7. PubMed PMID: 16417886.
  234. Visser WE, Jansen J, Friesema EC, Kester MH, Mancilla E, Lundgren J, et al. Novel pathogenic mechanism suggested by ex vivo analysis of MCT8 (SLC16A2) mutations. Hum Mutat. 2008 Jul 17;30:29-38. PubMed PMID: 18636565.
  235. Friesema EC, Visser WE, Visser TJ. Genetics and phenomics of thyroid hormone transport by MCT8. Mol Cell Endocrinol. 2010 Jan 18. PubMed PMID: 20083155.
  236. Boccone L, Mariotti S, Dessi V, Pruna D, Meloni A, Loudianos G. Allan-Herndon-Dudley syndrome (AHDS) caused by a novel SLC16A2 gene mutation showing severe neurologic features and unexpectedly low TRH-stimulated serum TSH. Eur J Med Genet. 2010 Nov-Dec;53(6):392-5. PubMed PMID: 20713192.
  237. Brockmann K, Dumitrescu AM, Best TT, Hanefeld F, Refetoff S. X-linked paroxysmal dyskinesia and severe global retardation caused by defective MCT8 gene. J Neurol. 2005 Jun;252(6):663-6. PubMed PMID: 15834651.
  238. Visser WE, Friesema EC, Visser TJ. Minireview: thyroid hormone transporters: the knowns and the unknowns. Mol Endocrinol. 2011 Jan;25(1):1-14. PubMed PMID: 20660303.
  239. Biebermann H, Ambrugger P, Tarnow P, von Moers A, Schweizer U, Grueters A. Extended clinical phenotype, endocrine investigations and functional studies of a loss-of-function mutation A150V in the thyroid hormone specific transporter MCT8. Eur J Endocrinol. 2005 Sep;153(3):359-66. PubMed PMID: 16131597.
  240. Herzovich V, Vaiani E, Marino R, Dratler G, Lazzati JM, Tilitzky S, et al. Unexpected Peripheral Markers of Thyroid Function in a Patient with a Novel Mutation of the MCT8 Thyroid Hormone Transporter Gene. Horm Res. 2007 Sep 15;67(1):1-6. PubMed PMID: 16974106.
  241. Wemeau JL, Pigeyre M, Proust-Lemoine E, d'Herbomez M, Gottrand F, Jansen J, et al. Beneficial effects of propylthiouracil plus L-thyroxine treatment in a patient with a mutation in MCT8. J Clin Endocrinol Metab. 2008 Jun;93(6):2084-8. PubMed PMID: 18334584.
  242. Fuchs O, Pfarr N, Pohlenz J, Schmidt H. Elevated serum triiodothyronine and intellectual and motor disability with paroxysmal dyskinesia caused by a monocarboxylate transporter 8 gene mutation. Dev Med Child Neurol. 2009 Mar;51(3):240-4. PubMed PMID: 19018842. Epub 2008/11/21. eng.
  243. Namba N, Etani Y, Kitaoka T, Nakamoto Y, Nakacho M, Bessho K, et al. Clinical phenotype and endocrinological investigations in a patient with a mutation in the MCT8 thyroid hormone transporter. Eur J Pediatr. 2008 Sep 25;167(7):785-91. PubMed PMID: 17899191.
  244. Vaurs-Barriere C, Deville M, Sarret C, Giraud G, Des Portes V, Prats-Vinas JM, et al. Pelizaeus-Merzbacher-Like disease presentation of MCT8 mutated male subjects. Ann Neurol. 2009 Jan;65(1):114-8. PubMed PMID: 19194886.
  245. Gika AD, Siddiqui A, Hulse AJ, Edwards S, Fallon P, McEntagart ME, et al. White matter abnormalities and dystonic motor disorder associated with mutations in the SLC16A2 gene. Dev Med & Child Neurol. 2010 May;52(5):475-82. PubMed PMID: 19811520.
  246. Kakinuma H, Itoh M, Takahashi H. A novel mutation in the monocarboxylate transporter 8 gene in a boy with putamen lesions and low free T4 levels in cerebrospinal fluid. J Pediatr. 2005 Oct;147(4):552-4. PubMed PMID: 16227048.
  247. Sijens PE, Rodiger LA, Meiners LC, Lunsing RJ. 1H magnetic resonance spectroscopy in monocarboxylate transporter 8 gene deficiency. J Clin Endocrinol Metab. 2008 May;93(5):1854-9. PubMed PMID: 18319316. Epub 2008/03/06. eng.
  248. Korwutthikulrangsri M, Fujisawa H, Fu J, Liao X-H, Dumitrescu AM, , editors. Contributions of the hypothalamus and pituitary in expressing the thyroid phenotype of Sbp2 deficiency: other regulatory tiers in addition to the thyroid gland. The 101st Annual Meeting of the Endocrine Society, ; 2019; New Orleans, LA.
  249. Crushell E, Reardon W. Elevated TSH levels in a mentally retarded boy. Eur J Pediatr. 2009 May;169(5):573-5. PubMed PMID: 19936787.
  250. Lopez-Espindola D, Morales-Bastos C, Grijota-Martinez C, Liao XH, Lev D, Sugo E, et al. Mutations of the thyroid hormone transporter MCT8 cause prenatal brain damage and persistent hypomyelination. J Clin Endocrinol Metab. 2014 Dec;99(12):E2799-804. PubMed PMID: 25222753. Epub 2014/09/16. eng.
  251. Dempsey MA, Dumitrescu AM, Refetoff S. MCT8 (SLS16A2)-Specific thyroid hormone cell transporter deficiency. GeneReviews. 2010. PubMed PMID: 20301789. Epub 2010/03/20. eng.
  252. Trajkovic M, Visser TJ, Mittag J, Horn S, Lukas J, Darras VM, et al. Abnormal thyroid hormone metabolism in mice lacking the monocarboxylate transporter 8. J Clin Invest. 2007 Mar 1;117(3):627-35. PubMed PMID: 17318265.
  253. Bernal J. Role of Monocarboxylate Anion Transporter 8 (MCT8) in Thyroid Hormone Transport: Answers from Mice. Endocrinology. 2006 Sep;147(9):4034-5. PubMed PMID: 16912236.
  254. Di Cosmo C, Liao XH, Ye H, Ferrara AM, Weiss RE, Refetoff S, et al. Mct8-deficient mice have increased energy xpenditure and reduced fat mass that is abrogated by normalization of serum T3 levels. Endocrinology. 2013 Dec;154(12):4885-95. PubMed PMID: 24029243. Epub 2013/09/14. Eng.
  255. Ferrara AM, Liao XH, Ye H, Weiss RE, Dumitrescu AM, Refetoff S. The Thyroid Hormone Analog DITPA Ameliorates Metabolic Parameters of Male Mice With Mct8 Deficiency. Endocrinology. 2015 Nov;156(11):3889-94. PubMed PMID: 26322373. Pubmed Central PMCID: 4606752.
  256. Trajkovic-Arsic M, Visser TJ, Darras VM, Friesema EC, Schlott B, Mittag J, et al. Consequences of Monocarboxylate Transporter 8 Deficiency for Renal Transport and Metabolism of Thyroid Hormones in Mice. Endocrinology. 2010 Feb;151(2):802-9. PubMed PMID: 19996182.
  257. Di Cosmo C, Liao XH, Dumitrescu AM, Philp NJ, Weiss RE, Refetoff S. Mice deficient in MCT8 reveal a mechanism regulating thyroid hormone secretion. J Clin Invest. 2010 Sept 1;120(9):3377-88. PubMed PMID: 20679730.
  258. Liao XH, Di Cosmo C, Dumitrescu AM, Hernandez A, Van Sande J, St Germain DL, et al. Distinct Roles of Deiodinases on the Phenotype of Mct8 Defect: A Comparison of Eight Different Mouse Genotypes. Endocrinology. 2011 Mar;152(3):1180-91. PubMed PMID: 21285310.
  259. Fliers E, Unmehopa UA, Alkemade A. Functional neuroanatomy of thyroid hormone feedback in the human hypothalamus and pituitary gland. Mol Cell Endocrinol. 2006 Jun 7;251(1-2):1-8. PubMed PMID: 16707210.
  260. Di Cosmo C, Liao XH, Dumitrescu AM, Weiss RE, Refetoff S. A thyroid hormone analogue with reduced dependence on the monocarboxylate transporter 8 (MCT8) for tissue transport. Endocrinology. 2009 Jun 4;150(9):4450-8. PubMed PMID: 19497976.
  261. Ferrara AM, Liao XH, Gil-Ibanez P, Bernal J, Weiss RE, Dumitrescu AM, et al. Placenta Passage of the Thyroid Hormone Analog DITPA to Male Wild-Type and Mct8-Deficient Mice. Endocrinology. 2014 Oct;155(10):4088-93. PubMed PMID: 25051435. Epub 2014/07/23. eng.
  262. Iwayama H, Liao XH, Braun L, Barez-Lopez S, Kaspar B, Weiss RE, et al. Adeno Associated Virus 9-Based Gene Therapy Delivers a Functional Monocarboxylate Transporter 8, Improving Thyroid Hormone Availability to the Brain of Mct8-Deficient Mice. Thyroid. 2016 Sep;26(9):1311-9. PubMed PMID: 27432638.
  263. Nishimura M, Naito S. Tissue-specific mRNA expression profiles of human solute carrier transporter superfamilies. Drug Metab Pharmacokinet. 2008;23(1):22-44. PubMed PMID: 18305372. Epub 2008/02/29. eng.
  264. Price NT, Jackson VN, Halestrap AP. Cloning and sequencing of four new mammalian monocarboxylate transporter (MCT) homologues confirms the existence of a transporter family with an ancient past. Biochem J. 1998 Jan 15;329 ( Pt 2):321-8. PubMed PMID: 9425115. Pubmed Central PMCID: 1219047. Epub 1998/02/28. eng.
  265. Heuer H, Maier MK, Iden S, Mittag J, Friesema EC, Visser TJ, et al. The monocarboxylate transporter 8 linked to human psychomotor retardation is highly expressed in thyroid hormone sensitive neuron populations. Endocrinology. 2005 Jan 20. PubMed PMID: 15661862.
  266. Roberts LM, Woodford K, Zhou M, Black DS, Haggerty JE, Tate EH, et al. Expression of the thyroid hormone transporters MCT8 (SLC16A2) and OATP14 (SLCO1C1) at the blood-brain barrier. Endocrinology. 2008 Dec;149(12):6251-61. PubMed PMID: 18687783.
  267. Trajkovic-Arsic M, Muller J, Darras VM, Groba C, Lee S, Weih D, et al. Impact of Monocarboxylate Transporter-8 Deficiency on the Hypothalamus-Pituitary-Thyroid Axis in Mice. Endocrinology. 2010 Oct;151(10):5053-62. PubMed PMID: 20702572.
  268. Braun D, Lelios I, Krause G, Schweizer U. Histidines in Potential Substrate Recognition Sites Affect Thyroid Hormone Transport by Monocarboxylate Transporter 8 (MCT8). Endocrinology. 2013 Apr 16. PubMed PMID: 23592749. Epub 2013/04/18. Eng.
  269. Lima de Souza EC, Groeneweg S, Visser WE, Peeters RP, Visser TJ. Importance of Cysteine Residues in the Thyroid Hormone Transporter MCT8. Endocrinology. 2013 May;154(5):1948-55. PubMed PMID: 23546606. Epub 2013/04/03. eng.
  270. Saito Y, Shichiri M, Hamajima T, Ishida N, Mita Y, Nakao S, et al. Enhancement of lipid peroxidation and its amelioration by vitamin E in a subject with mutations in the SBP2 gene. Journal of lipid research. 2015 Nov;56(11):2172-82. PubMed PMID: 26411970. Pubmed Central PMCID: 4617404.
  271. Verge CF, Konrad D, Cohen M, Di Cosmo C, Dumitrescu AM, Marcinkowski T, et al. Diiodothyropropionic Acid (DITPA) in the Treatment of MCT8 Deficiency. J Clin Endocrinol Metab. 2012 Dec;97(12):4515-23. PubMed PMID: 22993035. Epub 2012/09/21. eng.
  272. Lee JY, Kim MJ, Deliyanti D, Azari MF, Rossello F, Costin A, et al. Overcoming Monocarboxylate Transporter 8 (MCT8)-Deficiency to Promote Human Oligodendrocyte Differentiation and Myelination. EBioMedicine. 2017 Nov;25:122-35. PubMed PMID: 29111262. Pubmed Central PMCID: 5704066.
  273. Groeneweg S, Peeters RP, Moran C, Stoupa A, Auriol F, Tonduti D, et al. Effectiveness and safety of the tri-iodothyronine analogue Triac in children and adults with MCT8 deficiency: an international, single-arm, open-label, phase 2 trial. Lancet Diabetes Endocrinol. 2019 Sep;7(9):695-706. PubMed PMID: 31377265.
  274. Braun D, Schweizer U. The Chemical Chaperone Phenylbutyrate Rescues MCT8 Mutations Associated With Milder Phenotypes in Patients With Allan-Herndon-Dudley Syndrome. Endocrinology. 2017 Mar 1;158(3):678-91. PubMed PMID: 27977298.
  275. Groeneweg S, van den Berge A, Meima ME, Peeters RP, Visser TJ, Visser WE. Effects of Chemical Chaperones on Thyroid Hormone Transport by MCT8 Mutants in Patient-Derived Fibroblasts. Endocrinology. 2018 Mar 1;159(3):1290-302. PubMed PMID: 29309566.
  276. Bernal J, Pekonen F. Ontogenesis of the nuclear 3,5,3'-triiodothyronine receptor in the human fetal brain. Endocrinology. 1984 Feb;114(2):677-9. PubMed PMID: 6317365.
  277. Schoenmakers E, Carlson B, Agostini M, Moran C, Rajanayagam O, Bochukova E, et al. Mutation in human selenocysteine transfer RNA selectively disrupts selenoprotein synthesis. J Clin Invest. 2016 Mar 1;126(3):992-6. PubMed PMID: 26854926. Pubmed Central PMCID: 4767355.
  278. Agamy O, Ben Zeev B, Lev D, Marcus B, Fine D, Su D, et al. Mutations disrupting selenocysteine formation cause progressive cerebello-cerebral atrophy. Am J Hum Genet. 2010 Oct 8;87(4):538-44. PubMed PMID: 20920667. Pubmed Central PMCID: 2948803.
  279. Driscoll DM, Copeland PR. Mechanism and regulation of selenoprotein synthesis. Annu Rev Nutr. 2003;23:17-40. PubMed PMID: 12524431.
  280. Koenig RJ. Regulation of type 1 iodothyronine deiodinase in health and disease. Thyroid. 2005 Aug;15(8):835-40. PubMed PMID: 16131326.
  281. Di Cosmo C, McLellan N, Liao XH, Khanna KK, Weiss RE, Papp L, et al. Clinical and molecular characterization of a novel selenocysteine insertion sequence-binding protein 2 (SBP2) gene mutation (R128X). J Clin Endocrinol Metab. 2009 0CT;94(10):4003-9. PubMed PMID: 19602558.
  282. Azevedo MF, Barra GB, Naves LA, Ribeiro Velasco LF, Godoy Garcia Castro P, de Castro LC, et al. Selenoprotein-related disease in a young girl caused by nonsense mutations in the SBP2 gene. J Clin Endocrinol Metab. 2010 Aug;95(8):4066-71. PubMed PMID: 20501692.
  283. Schoenmakers E, Agostini M, Mitchell C, Schoenmakers N, Papp L, Rajanayagam O, et al. Mutations in the selenocysteine insertion sequence-binding protein 2 gene lead to a multisystem selenoprotein deficiency disorder in humans. J Clin Invest. 2010 Dec 1;120(12):4220-35. PubMed PMID: 21084748.
  284. Hamajima T, Mushimoto Y, Kobayashi H, Saito Y, Onigata K. Novel compound heterozygous mutations in the SBP2 gene: characteristic clinical manifestations and the implications of GH and triiodothyronine in longitudinal bone growth and maturation. Eur J Endocrinol. 2012 Apr;166(4):757-64. PubMed PMID: 22247018. Epub 2012/01/17. eng.
  285. Catli G, Fujisawa H, Kirbiyik O, Mimoto MS, Gencpinar P, Ozdemir TR, et al. A Novel Homozygous Selenocysteine Insertion Sequence Binding Protein 2 (SECISBP2, SBP2) Gene Mutation in a Turkish Boy. Thyroid. 2018 Sep;28(9):1221-3. PubMed PMID: 29882503.
  286. Lescure A, Allmang C, Yamada K, Carbon P, Krol A. cDNA cloning, expression pattern and RNA binding analysis of human selenocysteine insertion sequence (SECIS) binding protein 2. Gene. 2002 May 29;291(1-2):279-85. PubMed PMID: 12095701.
  287. Copeland PR. Regulation of gene expression by stop codon recoding: selenocysteine. Gene. 2003 Jul 17;312:17-25. PubMed PMID: 12909337.
  288. Papp LV, Lu J, Striebel F, Kennedy D, Holmgren A, Khanna KK. The redox state of SECIS binding protein 2 controls its localization and selenocysteine incorporation function. Mol Cell Biol. 2006 Jul;26(13):4895-910. PubMed PMID: 16782878.
  289. Bubenik JL, Driscoll DM. Altered RNA-binding activity underlies abnormal thyroid hormone metabolism linked to a mutation in Sec insertion sequence binding protein 2. J Biol Chem. 2007 Sep 27;282:34653-62. PubMed PMID: 17901054.
  290. Kryukov GV, Castellano S, Novoselov SV, Lobanov AV, Zehtab O, Guigo R, et al. Characterization of mammalian selenoproteomes. Science. 2003 May 30;300(5624):1439-43. PubMed PMID: 12775843.
  291. Papp LV, Lu J, Holmgren A, Khanna KK. From selenium to selenoproteins: synthesis, identity, and their role in human health. Antioxid Redox Signal. 2007 Jul;9(7):775-806. PubMed PMID: 17508906.
  292. Dumitrescu A, Di Cosmo C, Liao XH, Weiss R, Refetoff S. The syndrome of inherited partial SBP2 deficiency in humans. Antioxid Redox Signal. 2010 April 1;12(7):905-20. PubMed PMID: 19769464.
  293. Seeher S, Atassi T, Mahdi Y, Carlson BA, Braun D, Wirth EK, et al. Secisbp2 is essential for embryonic development and enhances selenoprotein expression. Antioxid Redox Signal. 2014 Aug 20;21(6):835-49. PubMed PMID: 24274065. Pubmed Central PMCID: 4116110. Epub 2013/11/28. eng.
  294. Fu J, Fujisawa H, Follman B, Liao XH, Dumitrescu AM. Thyroid Hormone Metabolism Defects in a Mouse Model of SBP2 Deficiency. Endocrinology. 2017 Dec 1;158(12):4317-30. PubMed PMID: 29029094. Pubmed Central PMCID: PMC5711384.
  295. Schomburg L, Dumitrescu AM, Liao XH, Bin-Abbas B, Hoeflich J, Kohrle J, et al. Selenium supplementation fails to correct the selenoprotein synthesis defect in subjects with SBP2 gene mutations. Thyroid. 2009 Mar;19(3):277-81. PubMed PMID: 19265499.
  296. Burk RF, Norsworthy BK, Hill KE, Motley AK, Byrne DW. Effects of chemical form of selenium on plasma biomarkers in a high-dose human supplementation trial. Cancer Epidemiol Biomarkers Prev. 2006 Apr;15(4):804-10. PubMed PMID: 16614127. Epub 2006/04/15. eng.
  297. Xu J, Yang F, An X, Hu Q. Anticarcinogenic activity of selenium-enriched green tea extracts in vivo. J Agric Food Chem. 2007 Jun 27;55(13):5349-53. PubMed PMID: 17542612. Epub 2007/06/05. eng.
  298. Feng W, Ribeiro RCJ, Wagner RL, Nguyen H, Apriletti JW, Fletterick RJ, et al. Hormone-dependent coactivator binding to a hydrophobic cleft on nuclear receptors. Science. 1998;280:1747-9.
  299. Chen JD, Evans RM. A transcriptional co-repressor that interacts with nuclear hormone receptors. Nature. 1995;377:454-7.
  300. Hörlein AJ, Näär AM, Heinzel T, Torchia J, Gloss B, Kurokawa R, et al. Ligand-independent repression by the thyroid hormone receptor mediated by a nuclear receptor co-repressor. Nature. 1995;377:397-404.
  301. Busch K, Martin B, Baniahmad A, Renkawitz R, Muller M. At least three subdomains of v-erbA are involved in its silencing function. Mol Endocrinol. 1997;11:379-89.
  302. Forman BM, Samuels HH. Interactions among a subfamily of nuclear hormone receptors: the regulatory zipper model. Mol Endocrinol. 1990;4:1293-301.
  303. Kurokawa R, Yu VC, Naar A, Kyakumoto S, Han Z, Silverman S, et al. Differential orientations of the DNA-binding domain and carboxy-terminal dimerization interface regulate binding site selection by nuclear receptor heterodimers. Genes & Development. 1993;7:1423-35.
  304. Beck-Peccoz P, Chatterjee VKK, Chin WW, DeGroot LJ, Jameson JL, Nakamura H, et al. Nomenclature of thyroid hormone receptor ß-gene mutations in resistance to thyroid hormone: Consensus statement from the first workshop on thyroid hormone resistance, July 10-11, 1993, Cambridge, United Kingdom. JClin Endocrinol Metab. 1994 Apr; 78(4):990-3. PubMed PMID: 8157732.
  305. Tone Y, Collingwood TN, Adams M, Chatterjee VK. Functional analysis of a transactivation domain in the thyroid hormone ß receptor. J Biol Chem. 1994;269:31157-61.
  306. Baniahmad A, Leng X, Burris TP, Tsai SY, Tsai M-J, O'Malley BW. The tau 4 activation domain of the thyroid hormone receptor is required for release of a putative corepressor(s) necessary for transcriptional silencing. Mol Cell Biol. 1995;15:76-86.
  307. Hamy F, Helbeque NJ, Henichart P. Comparison between synthetic nuclear localisation signal peptides from the steroid thyroid hormone receptor superfamily. Biochem Byophys Res Commun. 1992;183:289-93.
  308. Wurtz J-M, Bourguet W, Renaud J-P, Vivat V, Chambon P, Moras D. A canonical strusture for the ligand-binding domain of the nuclear receptors. Nature Struct Biol. 1996;3:87-94.


Lipoprotein (a) in Youth

ABSTRACT


Lipoprotein (a) [Lp(a)] represents a class of lipoproteins with structural similarity to low-density lipoprotein (LDL). In adults, Lp(a) has been shown to be an independent risk factor in the development of atherosclerotic cardiovascular diseases (ASCVD) and calcific aortic valve disease (CAVD). Outcomes in youth are limited by the paucity of data but several studies suggest that it is a risk factor for arterial ischemic stroke (AIS). The usual pitfalls of extrapolating from adult data may be less problematic for Lp(a) given that the gene is fully expressed at a very young age and high levels in childhood are associated with elevated levels in adulthood, irrespective of pubertal development or lifestyle changes. Universal screening for elevated lipoprotein (a) is controversial, with some groups recommending universal screening and others advocating for selective screening. Regardless of strategy, screening is warranted given that the gene for Lp(a) is inherited as an autosomal co-dominant trait and is one the most heritable disorders in humans. We will review recent guideline-based evidence for Lp(a), the distribution and interpretation of the Lp(a) measurement, and pharmaceutical therapies to reduce Lp(a). We will also summarize the available evidence and recommendations regarding the detection and treatment of youth with elevated Lp(a). Although the relative merits of screening and treating Lp(a) in youth may be debatable, it is clear that youth who enter adulthood with the lowest possible burden of risk factors will have a much lower risk of developing ASCVD in adulthood.


INTRODUCTION


Just over a decade ago, there was little consensus about whether or not Lp(a), a highly atherogenic lipoprotein, was an independent ASCVD risk factor. Much of the discordance was attributable to both biologic and analytical problems, including the unparalleled structural variability, racial/ethnic variations, difficulty defining ‘normal’ levels, and lack of consensus with respect to measurement methodology. The wider availability of improved methods for measuring Lp(a) coupled with data from observational studies of large diverse populations, genome-wide association studies (GWAS), and large Mendelian randomization studies leave little doubt that in adults, Lp(a) is an independent risk factor for ASCVD including coronary heart disease (CHD), ischemic stroke, peripheral arterial disease, and calcific aortic valve disease (CAVD) (1-9).   Data suggest that Lp(a) is the strongest independent genetic risk factor for both myocardial infarction (MI) and aortic stenosis (10), and inversely correlated with life expectancy (11).


In many ways, Lp(a) is more atherogenic than low density lipoprotein cholesterol (LDL-C) because of its pro-inflammatory and antifibrinolytic properties (12). The bulk of available data show that Lp(a) is predictive of ASCVD events independent of the LDL-C level (13); the lifetime risk of ASCVD increases with higher Lp(a) levels independent of the LDL-C level.


Although fewer studies have focused on Lp(a) in youth, data in the pediatric population suggests that it augments the risk of future ASCVD and is a risk factor for arterial ischemic stroke (AIS) including recurrent events.  Recently, data from YFS (Cardiovascular Risk in Young Finns) and the BHS (Bogalusa Heart Study) showed adults with early onset ASCVD were more likely to have Lp(a) ≥ 30 mg/dL at 9-24 years of age, with a hazard ratio of 2.0 in YFS and 2.5 in BHS (14). Like familial hypercholesterolemia (FH), Lp(a) is a highly hereditable disorder and although the genes for these two lipid disorders are not linked, when they occur jointly and/or in combination with other common risk factors such as diabetes and hypertension, they markedly accelerate the development of premature ASCVD, underscoring the importance of cascade screening and reverse cascade screening in families (15-17).  


EPIDEMIOLOGY AND GENETICS


The distribution and prevalence of elevated Lp(a) levels in the population are based on data from well-known epidemiologic studies including the Copenhagen General Population Study (18), Epic-Norfolk (19), and the Multi-Ethnic Study of Atherosclerosis (20). In children, initial data came from the 3rd National Health Nutrition and Examination Survey (NHANES), which characterized Lp(a) levels in 4-19 year-old youth (21). Since then multiple studies have evaluated Lp(a) levels in youth (22) and newborns (23) The percentile distributions and prevalence of Lp(a) > 30 mg/dL in youth aged 4–19 years from the NHANES survey is shown in Figure 1. To better understand the choice of cut points in youth and adults, the distribution of Lp(a) in the Danish adult population from the Copenhagen study is shown in Figure 2.


Figure 1. The percentiles distributions and prevalence of Lp(a) > 30 mg/dL in youth aged 4–19 years from the NHANES study (Ref 24).

Fig 2. Distributions of Lp(a) levels in ∼3000 men and 3000 women in the Copenhagen General Population Study from Ref. 21.

The distribution is highly skewed towards low levels and varies with gender. A threshold value of 50 mg/dL corresponding to values > 80th percentile in a predominately Caucasian population have been proposed by the European Atherosclerosis Society/European Society of Cardiology (EAS/ESC) (24) and the National Lipid Association guideline statement but these values are not used in all guidelines. Many laboratories across the U.S. consider values > 30 mg/dL as abnormal, which may arguably be more appropriate since this is a value above which excess ASCVD risk begins to accrue (25).  


Significant variability in Lp(a) levels exists among different races and ethnicities (see NHANES data in Figure 1); higher rates of elevated Lp(a) in Black children have been demonstrated compared to White children (26). In adults, the median (inter-quartile range) values for White adults in the Copenhagen study were 12 mg/dL (5-32 mg/dL), while in Hispanic adults the mean was 19 mg/dL (8–43 mg/dL), and in Black adults it was 39 mg/dL (19–69 mg/dL) (18).  The UK Biobank study found that the median value of Lp(a) was the lowest in Chinese individuals (16 nmol/L) slightly higher in Whites and South Asians (19 and 31 nmol/L respectively) and the highest in Black individuals (75 nmol/L) (4). 


Overall, the concentration of Lp(a) can vary up to a 1000-fold among individuals and up to ∼3-fold higher levels are reported in Black populations compared to White populations (2, 27, 28). This can be compared to the extremes of LDL-C where there is approximately a 5-fold difference between individuals with normal values versus those with familial hypercholesterolemia (FH). Lipoprotein (a) and LDL-C levels in children can also vary throughout the year and in the setting of infection. Gidding et al studied the combined biologic and analytic variation in Lp(a) and other lipid levels measured 4 times over a one year period when children were healthy as well as within a week after acute infections in 63 adolescents (29). The 50th percentile for variability in children’s Lp(a) was 19%, but 5% of children had up to 40% variability in Lp(a) over the one year period. For LDL-C, less variability overall was noted (25% variability for the 50th and 95th percentile).  No significant differences were observed for lipids after acute infections, except for a statistically significant drop in HDL-C and apo A-I.


The gene encoding apo(a) is inherited as an autosomal co-dominant trait and is one of the most heritable disorders in humans with estimates of 0.51 to 0.98 for the total Lp(a) level (30-32), accounting for the strong association with parental ASCVD (31, 32). By some estimates, up to 90% of the variation in the Lp(a) level is attributed to genetic expression (30). A child inherits one allele from each parent; as a result, most individuals produce two distinct Lp(a) isoforms differing with respect to both structure and concentration.


When an evaluated Lp(a) is found in an individual of any age, it is vitally important to emphasize this strong genetic inheritance pattern and facilitate screening of family members. Zawacki et al in fact noted that a family history of early-onset ASCVD correlated better with an elevated Lp(a) level in a child (>50 mg/dL) than an elevated LDL-C level (>190 mg/dL) (16). This is similar to findings from the LIPIGEN (Lipid Transport Disorders Italian Genetic Network) pediatric group (33). Cascade screening (parent to child) as well as reverse cascade screening (child to parent) has a high yield for detecting new cases. In the SAFEHEART (Spanish Familial Hypercholesterolemia Cohort) study, Ellis et al showed that in individuals with both FH and an elevated Lp(a), 1 new case of elevated Lp(a) was detected for every 2.4 individuals screened; index cases with FH who did not have an elevated Lp(a) level detected 1 individual for every 5.8 individuals screened (15). In Australia, a cascade screening program for FH and high Lp(a) found a new case of FH for every 1.5 relatives tested, a new case of high Lp(a) and FH for every 2.1 relatives tested, and a new case of isolated high Lp(a) in every 3.0 relatives tested (17).  Youth with FH and a family history of premature ASCVD (defined as onset of ASCVD in male relatives ≤ 50 years and females ≤ 60 years), were 3 times more likely to have an elevated Lp(a) level (≥ 50 mg/dL) than those with late onset ASCVD (16). The Family Heart Foundation (www.thefhfoundation.org) and the National Lipid Association (www.lipid.org) provide a number of resources for patients and clinicians to facilitate a better understanding and identification of affected family members.


When screening for elevated lipoprotein (a), biochemical testing, as opposed to genetic testing, is generally performed (see testing discussion below in Interpretation of Lp(a) Levels).  In contrast, FH can be diagnosed either by biochemical measurement of LDL-C or through genetic testing.


INTERPRETATION OF Lp(a) LEVELS


The unparalleled polymorphism in the apo(a) gene gives rise to the vast diversity of levels among individuals and ethnicities. This polymorphism is the result of a varying number of repeats of one of the kringle domains (tri-looped structures depicted in Figure 3) resulting in ~55 different isoforms of apo(a) ranging from 300 – 800 kDa. It is this structural heterogeneity that has also led to interassay variability, lack of standardization, and consequently much difficulty correlating and reconciling differences in reported outcomes (34, 35) . The serum Lp(a) level is inversely related to the size of the apo(a) protein i.e., individuals with small apo(a) isoforms have high serum Lp(a) levels while individuals with large apo(a) isoforms have low serum Lp(a) levels. As noted above, the size of the apo(a) isoforms is inherited, with an individual having two distinct apo(a) isoforms derived from apo(a) genes from their mother and father. This results in individuals having two different size Lp(a) particles in the serum.


Fig 3. Structure of lipoprotein(a) depicting the apo(a) protein with repeating KIV domains linked through a S-S bond to apoB100. TG=triglycerides, CE=cholesterol ester, FC=free cholesterol, PL=phospholipid (from Ref 1).

There are also multiple methods to measure Lp(a) (36), reported as either the molecular weight (mass concentration) in mg/dL or the particle (molar) concentration (nmol/L), and these measures are not interconvertible. The molecular weight of the Lp(a) particle includes all components shown in the Lp(a) structure in Fig. 3, namely the apo(a) protein, the LDL-like particle (including the protein portion which accounts for roughly one-third of the particle mass), the associated particle lipids (free cholesterol, triglycerides, phospholipids), and carbohydrate moieties. As noted above, there is substantial variation in the molecular weight due to the variability in the two apo(a) isoforms each person expresses. Additionally, the size of the apo(a) isoform, i.e., small versus large, has been proposed as a key determinant of the atherogenic characteristics (37). Although much of the literature discussing population distribution of values and/or the attributable ASCVD risk references report Lp(a) values in mg/dL, a value strongly influenced by the apo(a) size, it has been suggested that measuring the number of Lp(a) particles (nmol/L) is preferred, in part because Lp(a) reference material is standardized in nmol/L and independent of isoform size (1). This approach was affirmed in a landmark study by Gudbjartsson et al showing that in a large Icelandic population, the association of Lp(a) with CHD was highly correlated with the molar concentration rather than the type pf of apo(a) isoform (38). In the past, a conversion factor of 2.85 for small apo(a) isoforms and 1.85 for large apo(a) isoforms with a mean of 2.4 nmol/L per 1 mg has been used.  However, since individuals can express two distinct apo(a) isoforms, this conversion estimate can be inaccurate and is not generally recommended. Like the measurement of apoB100 (the protein portion of the LDL particle), neither assay is affected by whether or not the individual was fasting since they measure lipoprotein mass or molar levels do not vary with food intake.


In a standard lipid profile, the cholesterol carried by Lp(a), i.e., Lp(a)-C, is included in the LDL-C and non-HDL-C measurement. A simplified way to think of this is to imagine lipoproteins as "buckets" that carry cholesterol and triglyceride. The Lp(a) measurement itself is the number of "buckets" whereas the cholesterol carried by this "bucket” is included in the LDL-C measurement. Correction factors have been proposed to estimate the contribution of Lp(a)-C to the calculated LDL-C value based on the Dahlen equation, but these are rarely used or reported in the literature (36). With the development of drugs designed to specifically lower Lp(a) and Lp(a)-C knowledge of the true LDL-C and Lp(a)-C levels may assume greater importance (39).


Methods are being developed to measure Lp(a) cholesterol levels (40); these methods indicate that calculating the cholesterol in Lp(a) using equations may not be accurate. The EAS consensus panel recommended to avoid routine correction of LDL-C by subtracting 30% of the Lp(a) mass measurement till we have more data on the Lp(a) cholesterol content (13).


DEVELOPMENTAL AND DYNAMIC CHANGES IN Lp(a)


Lp(a) is detectable in the serum of newborn infants; gestational age but not birth weight seems to affect newborn levels (21, 41, 42). Lp(a) levels in umbilical cord blood correlated strongly with measurements on neonatal venous blood, which had moderate correlations with levels at 2 months and 15 months of age.  Most significantly, Lp(a) levels at birth greater than the 90th percentile predicted lipoprotein (a) > 42mg/dL at 15 months (43).  This is consistent with previous studies of Lp(a) showing full expression of the gene product in the first (44) and second (45) years of life, a pattern strikingly different from other lipoproteins.. In fact, no other lipoprotein level seems to track as perfectly to adulthood as Lp(a). The highly hereditable trait is reflected by a close correlation with the Lp(a) level and the number of grandparents the child has with a history of CHD (46).  However, some studies suggest there is variability in Lp(a) measurements in childhood; one study of children referred to a pediatric lipid clinic showed 22% of children who were on no lipid lowering therapy had an increase in Lp(a) in adulthood.  Among children prescribed statin monotherapy or statin/ezetimibe in combination, 43% and 9% of children had higher Lp(a) in adulthood respectively (22).  Analysis of the YFS cohort showed that most individuals with Lp(a) ≥ 30mg/dL at any point continued to have high Lp(a) (47), indicating that the clinical impact of variability in Lp(a) during childhood may not be clinically significant. 


Lp(a) is produced by the liver, but the clearance pathways are not well understood. The clearance of Lp(a) is not predominantly regulated by the LDL receptor and therefore lowering LDL-C levels with statins or ezetimibe does not lower Lp(a) levels. The kidney appears to play an important role in Lp(a) clearance as renal disease is associated with increased Lp(a) levels. The levels of Lp(a) appear to be regulated primarily by the rate of production of Lp(a). Renal disease may increase levels while severe liver disease may result in lower Lp(a) levels (1). Recently, high endogenous levels or therapeutic administration of human growth hormone were linked to increased serum Lp(a) levels, which may explain the association between childhood human growth hormone treatment and higher risk of ASCVD (48).


SCREENING FOR ELEVATED Lp(a)


Expert opinions on screening strategies for elevated Lp(a) differ.  The National Lipid Association recommends a selective screening strategy which is summarized in Table 1 (1). The European Atherosclerosis Society recommends universal screening in adulthood and a selective screening strategy for youth (13).  The American College of Cardiology and the American Heart Association do not have official screening guidelines for Lp(a) (49).  Canadian guidelines (50) and the European Society of Cardiology (13) advise universal screening for Lp(a) in adulthood.  The 2011 Expert Panel on Integrated Guidelines for Cardiovascular Health and Risk Reduction in Children and Adolescents suggested testing Lp(a) in children with ischemic or hemorrhagic stroke, or with a family history of ASCVD not explained by classical risk factors (51). However, it should be noted that since the time of their publication the knowledge regarding Lp(a) as a risk factor has been considerably strengthened - data which was incorporated into the NLA statement.


The main argument against universal Lp(a) testing in adults or children is that to date, no clinical trials have been able to show benefit from treatment aimed at lowering Lp(a) (52). However, such data are expected to be forthcoming with the release of drugs that specifically target Lp(a). Thanassoulis argues that “although there is no targeted therapy for Lp(a) lowering yet, to properly care for our cardiovascular patients requires knowledge of Lp(a). Individuals with high Lp(a) have a higher burden of atherogenic lipoproteins and are therefore at higher cardiovascular risk, which can only be detected by Lp(a) measurement. These individuals can obtain significant benefit from more aggressive lifestyle modifications and the maintenance of optimal risk factors throughout life.” This is similar to advice from Zawacki et al (16) who noted that “reverse-cascade screening of children with FH and high Lp(a) represents two opportunities for potentially life-saving diagnosis and treatment for family members” providing “an opportunity to intervene at an earlier age for both children and their adult relatives.” In summarizing key points, the NLA guidelines noted that “Even in the absence of an approved Lp(a)-lowering medication, in youth found to have an elevated level of Lp(a), it is important to emphasize early and lifelong adoption of a heart-healthy lifestyle by the child and family members, especially with respect to smoking avoidance or cessation, given the thrombotic risk attributable to Lp(a)” (1).


Table 1. NLA Recommendations (from Ref 1)

Clinically suspected or genetically confirmed FH.

A family history of first-degree relatives with premature ASCVD (<55 years of age in men, <65 years of age in women). 

An unknown cause of ischemic stroke.

A parent or sibling found to have an elevated Lp(a).

All recommendations were Class IIb (weak) and were based on limited data (Level C-LD)


Some professional societies have also suggested levels be measured in those whose LDL-C levels fails to decrease as predicted following statin therapy, and individuals with a history of coronary artery restenosis or recurrent ASCVD not explained by other risk factors (53-55). 


RELATIONSHIP WITH STROKE IN YOUTH


The most extensive data on the impact of Lp(a) in youth come from pediatric stroke studies. Although the evidence for Lp(a) as a stroke risk factor is not as robust as the relationship with CHD, in part likely due to the more heterogeneous etiology for stroke, i.e., both ischemic (large and small artery), hemorrhagic, and embolic, several meta-analyses concluded that an elevated Lp(a) level is a risk factor for incident stroke in adults (8, 56-58) as well as a large prospective, observational study demonstrating that Lp(a) levels were independently associated with large artery stroke, odds ratio (OR) of 1.48 per unit log10 Lp(a) increase and recurrent cerebrovascular events (58).  Tsimikas suggests that the etiology and relationship of Lp(a) with stroke is age dependent, with the more purely antifibrinolytic properties predominating in children and also noting that children with strokes frequently have other exacerbating diseases including congenital heart disease, coagulation disorders, or chronic inflammatory conditions. By contrast, the proinflammatory effects and proatherogenic effects of Lp(a) predominate in adults. Boffa and Koschinsky note that associations of genetic risk factors for thrombosis in children are less contaminated by acquired risk factors such as smoking as in the adult population and may therefore more accurately represent the thrombotic risk of Lp(a) (13, 59, 60).


The recommendation of the 2011 Expert Panel (51) included Lp(a) in lipid screening focused on youth with an ischemic or hemorrhagic stroke. This built on the 2008 pediatric stroke guidelines; although not specifically classified  as a risk factor that warranted screening, Lp(a) was listed as one of the hypercoagulable abnormalities that may cause stroke (61). Sultan et al included observational studies of imaging-confirmed AIS where lipid levels, including Lp(a), were available (62). Race/ethnicity were not specified; and the majority of studies were from Germany and the United Kingdom. There was a strong, positive association of AIS with Lp(a) (odds ratio [OR] 4.24 (confidence interval [CI] 2.94 – 6.11)). Kenet et al reported a pooled OR 6.53 (CI 4.46 – 9.55) for elevated Lp(a) in cases of AIS (63). A third case-control study in predominately white U.S. children only found a positive association of a Lp(a) >90thpercentile using race-specific cut points with recurrent AIS but the effect was large - OR 14.0 (CI 1.0 – 184, p=0.05)., OR 14.0, but with a substantially larger CI 1.0 – 184 but P=0.05. This effect was correlated with a small apo(a) isoform size below 10th percentile (OR 12.8 (1.61 – 101), P=0.02) (64). An important consideration in these studies is that Lp(a) levels were measured in many cases after the initiation of anticoagulation therapy, which likely included aspirin, the latter which has been reported to reduce Lp(a).


While venous thromboembolism (VTE) is rare in children and the majority of events are due to central venous line-related thrombotic events or underlying medical conditions (i.e., congenital heart disease, infection, cancer, prematurity), several studies reported an increased risk of VTE with an elevated Lp(a) level (65, 66).  However, this has not been supported in larger adult studies (13). As is the case in many studies of the impact of childhood risk factors, long-term studies linking elevated levels of Lp(a) to adult-onset ASCVD-related events are limited.


LIFESTYLE CHANGES TO LOWER Lp(a)


As Lp(a) levels are dominated by genetic influence, conventional wisdom has been that diet has little impact (53). Paradoxically, multiple studies have reported that a low-fat diet and low-fat-high-carbohydrate diets significantly increase Lp(a) in adults (67-69). More limited studies have demonstrated similar findings in youth.  Brandstatter et al measured Lp(a) mass and the apo(a) isoform size before and after a 3-week hypocaloric diet and exercise in obese children (67). With a 6.6% decrease in body weight, they observed a ~20% decrease in Lp(a) levels, which was comparable to the declines seen for LDL-C and triglycerides. The decline in Lp(a) was greater in youth with higher baseline levels of Lp(a). Studies of a diet enriched in plant sterols (70) failed to significantly change Lp(a) levels.  Data on lipoprotein (a) levels in low carbohydrate diets are mixed, with one study showing a low glycemic index diet did not change Lp(a) levels (71) and another study showing a decrease in Lp(a) with a low carbohydrate diet (72).  It is unclear if weight loss or diet composition is the primary factor. Importantly, a healthy diet, exercise, avoidance of tobacco (including secondhand smoke exposure), and maintaining a healthy body weight are fundamental in minimizing the acquisition of additional risk factors that compound the atherogenic effect of an elevated Lp(a) level.


PHARMACEUTICAL INTERVENTIONS TO LOWER Lp(a)


Currently, there are no Food and Drug Administration (FDA) approved medications for targeted lowering of Lp(a) in adults or children. Previously niacin, which has been shown to lower Lp(a) levels, was commonly used in adults with elevated Lp(a) but failed to prevent ASCVD events in two clinical outcome trials, the Atherothrombosis Intervention in Metabolic Syndrome With Low HDL/High Triglycerides and Impact on Global Health Outcomes (AIM-HIGH) (73) and the Second Heart Protection Study (HPS-2 THRIVE) (74). Although proprotein convertase subtilisin/kexin 9 inhibitors (PCSK9i) are not indicated for targeted treatment of Lp(a), studies show significant reductions. For example, the FOURIER study found that adults with the highest Lp(a) levels had greater reductions in Lp(a) with their use and greater risk reduction (75). Only one clinical trial of this class of drugs has included adolescents, all of whom had homozygous FH. In this population evolocumab was safe and effective (76).


Statin therapy has been the foundation treatment to reduce LDL-C and to lower the risk of ASCVD events but it does not seem to reduce Lp(a) mass appreciably and in fact may actually increase levels of Lp(a) (77). Despite this trend, statins remain the mainstay of pharmaceutical therapy to reduce ASCVD risk in both children and adults. Statin therapy in children with high Lp(a) remains controversial, with very limited data to guide clinical decision making. Generally speaking, statin therapy is not recommended for children whose sole risk factor is an elevated Lp(a) level, but as in adults, it is the first-line therapy to reduce LDL-C in youth with a high risk of developing premature ASCVD as adults (51) and it should be considered when a child has elevated LDL-C and Lp(a), particularly with a family history of premature ASCVD or other ASCVD risk factors (51). A 20-year study using pravastatin in children affirmed both the long-term safety and efficacy of this approach in 214 youth with FH (78).  


In addition to the effects of PCSK9i and niacin, mipomersen,  lomitapide, and cholesterol-ester-transfer protein inhibitors have also been shown to decrease Lp(a) concentrations (79-81). Antisense oligonucleotides to apo(a) mRNA are in development (80, 82) and, in the future, may play a role in treatment of elevated Lp(a) in children (83). While bempedoic acid lowers LDL-C, it has a minimal impact on the Lp(a) level (2.4% elevation) (84). The effect of the various pharmaceuticals on Lp(a) levels is shown in Table 2. Finally, lipoprotein apheresis, which removes all apoB-containing lipoproteins including LDL-C and Lp(a), can be used but is generally reserved for youth with extremely high short-term risk of ASCVD events such as those with homozygous FH (85, 86).


Table 2. Effect of Lipid Lowering Drugs on Lp(a) Levels

Statins

No Effect or slight increase

Ezetimibe

No Effect or slight increase

Fibrates

No Effect

Bempedoic Acid

Minimal Effect

Niacin

Decrease 15-25%. Greatest decrease in patients with highest Lp(a) levels

PCSK9 Inhibitors

Decrease 20-30%

Estrogen

Decrease 20-35%

Mipomersen*

Decrease 25-30%

Lomitapide*

Decrease 15-20%

CETP Inhibitors**

Decrease ~ 25%

Apo (a) antisense**

Decrease > 75%

*Only approved for the treatment of Homozygous FH; **not currently available


CONCLUSIONS


Future investigations of the relationship of Lp(a) and ASCVD risk will require large and ethnically diverse populations as well as uniformity and standardization of Lp(a) measurement. As is the case in most pediatric outcome studies, sample size is problematic. However, the usual pitfalls of extrapolating from adult data may be less problematic for Lp(a) given that the gene is fully expressed at a young age. Clearly in cases of AIS and strong family history of ASCVD, measurement of Lp(a) is warranted. Whether or not youth with markedly elevated Lp(a) levels should be treated with lipid-lowering medications (i.e., statins) remains controversial.

At a minimum, encouraging avoidance of acquired ASCVD risk factors is a critical component of the health care we can provide children and their parents. Emphasis should be placed on teaching youth about the importance of lifelong tobacco avoidance. The role of maintaining a healthy body weight and daily physical activity is critical in helping reduce the additional inflammatory risk attributable to obesity and insulin resistance, problems which are exacerbated by the development of added risk factors (low HDL-C, type 2 diabetes, and hypertension). In young women with an elevated Lp(a) level, issues surrounding the potential thrombotic risk of oral contraceptives should also be addressed and attention given to choosing a formulation with the lowest risk (87).


Given that a child’s medical history is often forgotten with time, it is essential that youth appreciate and articulate the importance of Lp(a) as a risk factor to their future health care providers and be aware that their children may acquire this risk factor. While the relative merits of screening and treating Lp(a) in the pediatric population may be debatable, what is irrefutable is that youth who enter adulthood with the lowest possible burden of ASCVD risk will have a much lower risk of developing ASCVD than those with multiple risk factors, including elevated Lp(a).


REFERENCES


  1. Wilson DP, Jacobson TA, Jones PH, Koschinsky ML, McNeal CJ, Nordestgaard BG, et al. Use of Lipoprotein(a) in clinical practice: A biomarker whose time has come. A scientific statement from the National Lipid Association. J Clin Lipidol. 2019;13(3):374-92.
  2. Kronenberg F, Utermann G. Lipoprotein(a): resurrected by genetics. J Intern Med. 2013;273(1):6-30.
  3. Ruscica M, Sirtori CR, Corsini A, Watts GF, Sahebkar A. Lipoprotein(a): Knowns, unknowns and uncertainties. Pharmacol Res. 2021;173:105812.
  4. Patel AP, Wang M, Pirruccello JP, Ellinor PT, Ng K, Kathiresan S, et al. Lp(a) (Lipoprotein[a]) Concentrations and Incident Atherosclerotic Cardiovascular Disease: New Insights From a Large National Biobank. Arterioscler Thromb Vasc Biol. 2021;41(1):465-74.
  5. Mehta A, Jain V, Saeed A, Saseen JJ, Gulati M, Ballantyne CM, et al. Lipoprotein(a) and ethnicities. Atherosclerosis. 2022;349:42-52.
  6. Virani SS, Koschinsky ML, Maher L, Mehta A, Orringer CE, Santos RD, et al. Global think tank on the clinical considerations and management of lipoprotein(a): The top questions and answers regarding what clinicians need to know. Prog Cardiovasc Dis. 2022;73:32-40.
  7. Ooi EM, Ellis KL, Barrett PHR, Watts GF, Hung J, Beilby JP, et al. Lipoprotein(a) and apolipoprotein(a) isoform size: Associations with angiographic extent and severity of coronary artery disease, and carotid artery plaque. Atherosclerosis. 2018;275:232-8.
  8. Langsted A, Nordestgaard BG, Kamstrup PR. Elevated Lipoprotein(a) and Risk of Ischemic Stroke. J Am Coll Cardiol. 2019;74(1):54-66.
  9. Varvel S, McConnell JP, Tsimikas S. Prevalence of Elevated Lp(a) Mass Levels and Patient Thresholds in 532 359 Patients in the United States. Arteriosclerosis, Thrombosis, and Vascular Biology. 2016;36(11):2239-45.
  10. Afshar M, Thanassoulis G. Lipoprotein(a): new insights from modern genomics. Curr Opin Lipidol. 2017;28(2):170-6.
  11. Arsenault B, Pelletier W, Kaiser Y, Perrot N, Couture C, Khaw K-T, et al. Long-Term Exposure to Elevated Lipoprotein(A) Levels Influences Human Longevity. SSRN Electronic Journal. 2019: 10.2139/ssrn.3404259.
  12. Safarova MS MP. Thrombosis, Inflammation, and Lipoprotein (a): Clinical Implications. 2023 2023 Mar 4. In: Lipoprotein (a) [Internet]. Cham: Springer International Publishing; [189-206].
  13. Kronenberg F, Mora S, Stroes ESG, Ference BA, Arsenault BJ, Berglund L, et al. Lipoprotein(a) in atherosclerotic cardiovascular disease and aortic stenosis: a European Atherosclerosis Society consensus statement Eur Heart J. 2022;43(39):3925-46.
  14. Raitakari O, Kartiosuo N, Pahkala K, Hutri-Kähönen N, Bazzano LA, Chen W, et al. Lipoprotein(a) in Youth and Prediction of Major Cardiovascular Outcomes in Adulthood. Circulation.0(0).
  15. Ellis KL, Perez de Isla L, Alonso R, Fuentes F, Watts GF, Mata P. Value of Measuring Lipoprotein(a) During Cascade Testing for Familial Hypercholesterolemia. Journal of the American College of Cardiology. 2019;73(9):1029-39.
  16. Zawacki AW, Dodge A, Woo KM, Ralphe JC, Peterson AL. In pediatric familial hypercholesterolemia, lipoprotein(a) is more predictive than LDL-C for early onset of cardiovascular disease in family members. J Clin Lipidol. 2018;12(6):1445-51.
  17. Chakraborty A, Pang J, Chan DC, Ellis KL, Hooper AJ, Bell DA, et al. Cascade testing for elevated lipoprotein(a) in relatives of probands with familial hypercholesterolaemia and elevated lipoprotein(a). Atherosclerosis. 2022;349:219-26.
  18. Nordestgaard BG, Chapman MJ, Ray K, Boren J, Andreotti F, Watts GF, et al. Lipoprotein(a) as a cardiovascular risk factor: current status. European heart journal. 2010;31(23):2844-53.
  19. Verbeek R, Boekholdt SM, Stoekenbroek RM, Hovingh GK, Witztum JL, Wareham NJ, et al. Population and assay thresholds for the predictive value of lipoprotein (a) for coronary artery disease: the EPIC-Norfolk Prospective Population Study. Journal of lipid research. 2016;57(4):697-705.
  20. Guan W, Cao J, Steffen BT, Post WS, Stein JH, Tattersall MC, et al. Race is a key variable in assigning lipoprotein(a) cutoff values for coronary heart disease risk assessment: the Multi-Ethnic Study of Atherosclerosis. Arteriosclerosis, thrombosis, and vascular biology. 2015;35(4):996-1001.
  21. Obisesan TO, Aliyu MH, Adediran AS, Bond V, Maxwell CJ, Rotimi CN. Correlates of serum lipoprotein (A) in children and adolescents in the United States. The third National Health Nutrition and Examination Survey (NHANES-III). Lipids in health and disease. 2004;3:29.
  22. de Boer LM, Hof MH, Wiegman A, Stroobants AK, Kastelein JJP, Hutten BA. Lipoprotein(a) levels from childhood to adulthood: Data in nearly 3,000 children who visited a pediatric lipid clinic. Atherosclerosis. 2022;349:227-32.
  23. Strandkjær N, Hansen MK, Nielsen ST, Frikke-Schmidt R, Tybjærg-Hansen A, Nordestgaard BG, et al. Lipoprotein(a) Levels at Birth and in Early Childhood: The COMPARE Study. The Journal of Clinical Endocrinology & Metabolism. 2021.
  24. Authors/Task Force M, Guidelines ESCCfP, Societies ESCNC. 2019 ESC/EAS guidelines for the management of dyslipidaemias: Lipid modification to reduce cardiovascular risk. Atherosclerosis. 2019;290:140-205.
  25. Alshami N, Qayum O, Chew W, Raghuveer G. Elevated lipoprotein (a) within the pediatric population. Congenital Heart Disease. 2017;12:663.
  26. Qayum O, Alshami N, Ibezim CF, Reid KJ, Noel-MacDonnell JR, Raghuveer G. Lipoprotein (a): Examination of Cardiovascular Risk in a Pediatric Referral Population. Pediatric cardiology. 2018;39(8):1540-6.
  27. Jacobson TA. Lipoprotein(a), cardiovascular disease, and contemporary management. Mayo Clinic proceedings. 2013;88(11):1294-311.
  28. Paultre F, Pearson TA, Weil HF, Tuck CH, Myerson M, Rubin J, et al. High levels of Lp(a) with a small apo(a) isoform are associated with coronary artery disease in African American and white men. Arteriosclerosis, thrombosis, and vascular biology. 2000;20(12):2619-24.
  29. Gidding SS, Stone NJ, Bookstein LC, Laskarzewski PM, Stein EA. Month-to-month variability of lipids, lipoproteins, and apolipoproteins and the impact of acute infection in adolescents. J Pediatr. 1998;133(2):242-6.
  30. Boerwinkle E, Leffert CC, Lin J, Lackner C, Chiesa G, Hobbs HH. Apolipoprotein(a) gene accounts for greater than 90% of the variation in plasma lipoprotein(a) concentrations. The Journal of clinical investigation. 1992;90(1):52-60.
  31. Enkhmaa B, Anuurad E, Zhang W, Kim K, Berglund L. Heritability of apolipoprotein (a) traits in two-generational African-American and Caucasian families. Journal of lipid research. 2019;60(9):1603-9.
  32. Schmidt K, Noureen A, Kronenberg F, Utermann G. Structure, function, and genetics of lipoprotein (a). Journal of lipid research. 2016;57(8):1339-59.
  33. Pederiva C, Capra ME, Biasucci G, Banderali G, Fabrizi E, Gazzotti M, et al. Lipoprotein(a) and family history for cardiovascular disease in paediatric patients: A new frontier in cardiovascular risk stratification. Data from the LIPIGEN paediatric group. Atherosclerosis. 2022;349:233-9.
  34. Clouet-Foraison N VT, Marcovina SM. Standardization of Analytical Methods for the Measurement of Lipoprotein (a): Bridging Past and Future Initiatives. 2023 2023 Mar 4. In: Lipoprotein (a) [Internet]. Cham: Springer International Publishing; [297-323].
  35. Sullivan D WC, Perera N, Ramanathan J, Badrick T. Measurement of Lipoprotein (a) in the Clinical Laboratory. 2023 2023 Mar 4. In: Lipoprotein (a) [Internet]. Cham: Springer International Publishing; [281-95].
  36. McNeal CJ. Lipoprotein(a): Its relevance to the pediatric population. Journal of clinical lipidology. 2015;9(5 Suppl):S57-66.
  37. Ward NC, Kostner KM, Sullivan DR, Nestel P, Watts GF. Molecular, Population, and Clinical Aspects of Lipoprotein(a): A Bridge Too Far? Journal of clinical medicine. 2019;8(12):2073.
  38. Gudbjartsson DF, Thorgeirsson G, Sulem P, Helgadottir A, Gylfason A, Saemundsdottir J, et al. Lipoprotein(a) Concentration and Risks of Cardiovascular Disease and Diabetes. Journal of the American College of Cardiology. 2019;74(24):2982-94.
  39. Viney NJ, Yeang C, Yang X, Xia S, Witztum JL, Tsimikas S. Relationship between "LDL-C", estimated true LDL-C, apolipoprotein B-100, and PCSK9 levels following lipoprotein(a) lowering with an antisense oligonucleotide. Journal of clinical lipidology. 2018;12(3):702-10.
  40. Yeang C, Witztum JL, Tsimikas S. Novel method for quantification of lipoprotein(a)-cholesterol: implications for improving accuracy of LDL-C measurements. J Lipid Res. 2021;62:100053.
  41. Kwiterovich PO, Jr., Virgil DG, Garrett ES, Otvos J, Driggers R, Blakemore K, et al. Lipoprotein heterogeneity at birth: influence of gestational age and race on lipoprotein subclasses and Lp (a) lipoprotein. Ethnicity & disease. 2004;14(3):351-9.
  42. Pulzer F, Haase U, Kratzsch J, Richter V, Rassoul F, Kiess W, et al. Lipoprotein(a) levels in formerly small-for-gestational-age children. Hormone research. 1999;52(5):241-6.
  43. Strandkjær N, Hansen MK, Nielsen ST, Frikke-Schmidt R, Tybjærg-Hansen A, Nordestgaard BG, et al. Lipoprotein(a) Levels at Birth and in Early Childhood: The COMPARE Study. J Clin Endocrinol Metab. 2022;107(2):324-35.
  44. Wang XL, Wilcken DE, Dudman NP. Early expression of the apolipoprotein (a) gene: relationships between infants' and their parents' serum apolipoprotein (a) levels. Pediatrics. 1992;89(3):401-6.
  45. Rifai N, Heiss G, Doetsch K. Lipoprotein(a) at birth, in blacks and whites. Atherosclerosis. 1992;92(2-3):123-9.
  46. Srinivasan SR, Dahlen GH, Jarpa RA, Webber LS, Berenson GS. Racial (black-white) differences in serum lipoprotein (a) distribution and its relation to parental myocardial infarction in children. Bogalusa Heart Study. Circulation. 1991;84(1):160-7.
  47. Raitakari O, Kivelä A, Pahkala K, Rovio S, Mykkänen J, Ahola-Olli A, et al. Long-term tracking and population characteristics of lipoprotein (a) in the Cardiovascular Risk in Young Finns Study. Atherosclerosis. 2022;356:18-27.
  48. Laron Z. Increase of serum lipoprotein (a), an adverse effect of growth hormone treatment. Growth Horm IGF Res. 2022;67:101503.
  49. Grundy SM, Stone NJ, Bailey AL, Beam C, Birtcher KK, Blumenthal RS, et al. 2018 AHA/ACC/AACVPR/AAPA/ABC/ACPM/ADA/AGS/APhA/ASPC/NLA/PCNA Guideline on the Management of Blood Cholesterol. A Report of the American College of Cardiology/American Heart Association Task Force on Clinical Practice Guidelines. 2019;73(24):e285-e350.
  50. Pearson GJ, Thanassoulis G, Anderson TJ, Barry AR, Couture P, Dayan N, et al. 2021 Canadian Cardiovascular Society Guidelines for the Management of Dyslipidemia for the Prevention of Cardiovascular Disease in Adults. Can J Cardiol. 2021;37(8):1129-50.
  51. Expert Panel on Integrated Guidelines for Cardiovascular H, Risk Reduction in C, Adolescents, National Heart L, Blood I. Expert panel on integrated guidelines for cardiovascular health and risk reduction in children and adolescents: summary report. Pediatrics. 2011;128 Suppl 5:S213-56.
  52. Stone NJ, Robinson JG, Lichtenstein AH, Bairey Merz CN, Blum CB, Eckel RH, et al. 2013 ACC/AHA guideline on the treatment of blood cholesterol to reduce atherosclerotic cardiovascular risk in adults: a report of the American College of Cardiology/American Heart Association Task Force on Practice Guidelines. Journal of the American College of Cardiology. 2014;63(25 Pt B):2889-934.
  53. Kostner KM, Kostner GM. Therapy of hyper-Lp(a). Handbook of experimental pharmacology. 2005(170):519-36.
  54. Nowak-Gottl U, Langer C, Bergs S, Thedieck S, Strater R, Stoll M. Genetics of hemostasis: differential effects of heritability and household components influencing lipid concentrations and clotting factor levels in 282 pediatric stroke families. Environmental health perspectives. 2008;116(6):839-43.
  55. van Capelleveen JC, van der Valk FM, Stroes ES. Current therapies for lowering lipoprotein (a). Journal of lipid research. 2016;57(9):1612-8.
  56. Emerging Risk Factors C, Erqou S, Kaptoge S, Perry PL, Di Angelantonio E, Thompson A, et al. Lipoprotein(a) concentration and the risk of coronary heart disease, stroke, and nonvascular mortality. Jama. 2009;302(4):412-23.
  57. Nave AH, Lange KS, Leonards CO, Siegerink B, Doehner W, Landmesser U, et al. Lipoprotein (a) as a risk factor for ischemic stroke: a meta-analysis. Atherosclerosis. 2015;242(2):496-503.
  58. Arnold M, Schweizer J, Nakas CT, Schütz V, Westphal LP, Inauen C, et al. Lipoprotein(a) is associated with large artery atherosclerosis stroke aetiology and stroke recurrence among patients below the age of 60 years: results from the BIOSIGNAL study. Eur Heart J. 2021;42(22):2186-96.
  59. Boffa MB, Koschinsky ML. Lipoprotein (a): truly a direct prothrombotic factor in cardiovascular disease? J Lipid Res. 2016;57(5):745-57.
  60. Tsimikas S. Elevated lipoprotein(a) and the risk of stroke in children, young adults, and the elderly. Eur Heart J. 2021;42(22):2197-200.
  61. Roach ES, Golomb MR, Adams R, Biller J, Daniels S, Deveber G, et al. Management of stroke in infants and children: a scientific statement from a Special Writing Group of the American Heart Association Stroke Council and the Council on Cardiovascular Disease in the Young. Stroke. 2008;39(9):2644-91.
  62. Simma B, Martin G, Muller T, Huemer M. Risk factors for pediatric stroke: consequences for therapy and quality of life. Pediatric neurology. 2007;37(2):121-6.
  63. Kenet G, Lutkhoff LK, Albisetti M, Bernard T, Bonduel M, Brandao L, et al. Impact of thrombophilia on risk of arterial ischemic stroke or cerebral sinovenous thrombosis in neonates and children: a systematic review and meta-analysis of observational studies. Circulation. 2010;121(16):1838-47.
  64. Goldenberg NA, Bernard TJ, Hillhouse J, Armstrong-Wells J, Galinkin J, Knapp-Clevenger R, et al. Elevated lipoprotein (a), small apolipoprotein (a), and the risk of arterial ischemic stroke in North American children. Haematologica. 2013;98(5):802-7.
  65. Nowak-Gottl U, Junker R, Hartmeier M, Koch HG, Munchow N, Assmann G, et al. Increased lipoprotein(a) is an important risk factor for venous thromboembolism in childhood. Circulation. 1999;100(7):743-8.
  66. Revel-Vilk S, Chan A, Bauman M, Massicotte P. Prothrombotic conditions in an unselected cohort of children with venous thromboembolic disease. Journal of thrombosis and haemostasis : JTH. 2003;1(5):915-21.
  67. Brandstatter A, Lingenhel A, Zwiauer K, Strobl W, Kronenberg F. Decrease of Lp(a) during weight reduction in obese children is modified by the apo(a) kringle-IV copy number variation. International journal of obesity. 2009;33(10):1136-42.
  68. Faghihnia N, Tsimikas S, Miller ER, Witztum JL, Krauss RM. Changes in lipoprotein(a), oxidized phospholipids, and LDL subclasses with a low-fat high-carbohydrate diet. Journal of lipid research. 2010;51(11):3324-30.
  69. Shin MJ, Blanche PJ, Rawlings RS, Fernstrom HS, Krauss RM. Increased plasma concentrations of lipoprotein(a) during a low-fat, high-carbohydrate diet are associated with increased plasma concentrations of apolipoprotein C-III bound to apolipoprotein B-containing lipoproteins. The American journal of clinical nutrition. 2007;85(6):1527-32.
  70. Garoufi A, Vorre S, Soldatou A, Tsentidis C, Kossiva L, Drakatos A, et al. Plant sterols-enriched diet decreases small, dense LDL-cholesterol levels in children with hypercholesterolemia: a prospective study. Italian journal of pediatrics. 2014;40:42.
  71. Rouhani MH, Kelishadi R, Hashemipour M, Esmaillzadeh A, Azadbakht L. The effect of an energy restricted low glycemic index diet on blood lipids, apolipoproteins and lipoprotein (a) among adolescent girls with excess weight: a randomized clinical trial. Lipids. 2013;48(12):1197-205.
  72. Ebbeling CB, Knapp A, Johnson A, Wong JMW, Greco KF, Ma C, et al. Effects of a low-carbohydrate diet on insulin-resistant dyslipoproteinemia-a randomized controlled feeding trial. Am J Clin Nutr. 2022;115(1):154-62.
  73. Albers JJ, Slee A, O'Brien KD, Robinson JG, Kashyap ML, Kwiterovich PO, Jr., et al. Relationship of apolipoproteins A-1 and B, and lipoprotein(a) to cardiovascular outcomes: the AIM-HIGH trial (Atherothrombosis Intervention in Metabolic Syndrome with Low HDL/High Triglyceride and Impact on Global Health Outcomes). Journal of the American College of Cardiology. 2013;62(17):1575-9.
  74. Hps Thrive Collaborative Group, Landray MJ, Haynes R, Hopewell JC, Parish S, Aung T, et al. Effects of extended-release niacin with laropiprant in high-risk patients. The New England journal of medicine. 2014;371(3):203-12.
  75. O'Donoghue ML, Fazio S, Giugliano RP, Stroes ESG, Kanevsky E, Gouni-Berthold I, et al. Lipoprotein(a), PCSK9 Inhibition, and Cardiovascular Risk. Circulation. 2019;139(12):1483-92.
  76. Raal FJ, Honarpour N, Blom DJ, Hovingh GK, Xu F, Scott R, et al. Inhibition of PCSK9 with evolocumab in homozygous familial hypercholesterolaemia (TESLA Part B): a randomised, double-blind, placebo-controlled trial. Lancet. 2015;385(9965):341-50.
  77. Tsimikas S, Gordts PLSM, Nora C, Yeang C, Witztum JL. Statin therapy increases lipoprotein(a) levels. Eur Heart J. 2019.
  78. Luirink IK, Wiegman A, Kusters DM, Hof MH, Groothoff JW, de Groot E, et al. 20-Year Follow-up of Statins in Children with Familial Hypercholesterolemia. The New England journal of medicine. 2019;381(16):1547-56.
  79. Parhofer KG. Lipoprotein(a): medical treatment options for an elusive molecule. Current pharmaceutical design. 2011;17(9):871-6.
  80. Ray KK, Corral P, Morales E, Nicholls SJ. Pharmacological lipid-modification therapies for prevention of ischaemic heart disease: current and future options. Lancet. 2019;394(10199):697-708.
  81. Santos RD, Raal FJ, Catapano AL, Witztum JL, Steinhagen-Thiessen E, Tsimikas S. Mipomersen, an antisense oligonucleotide to apolipoprotein B-100, reduces lipoprotein(a) in various populations with hypercholesterolemia: results of 4 phase III trials. Arteriosclerosis, thrombosis, and vascular biology. 2015;35(3):689-99.
  82. Lippi G, Targher G. Optimal therapy for reduction of lipoprotein(a). Journal of clinical pharmacy and therapeutics. 2012;37(1):1-3.
  83. de Boer LM, Wiegman A, Swerdlow DI, Kastelein JJP, Hutten BA. Pharmacotherapy for children with elevated levels of lipoprotein(a): future directions. Expert Opin Pharmacother. 2022;23(14):1601-15.
  84. Ridker PM, Lei L, Ray KK, Ballantyne CM, Bradwin G, Rifai N. Effects of bempedoic acid on CRP, IL-6, fibrinogen and lipoprotein(a) in patients with residual inflammatory risk: A secondary analysis of the CLEAR harmony trial. J Clin Lipidol. 2023;17(2):297-302.
  85. Franchini M, Capuzzo E, Liumbruno GM. Lipoprotein apheresis for the treatment of elevated circulating levels of lipoprotein(a): a critical literature review. Blood transfusion = Trasfusione del sangue. 2016;14(5):413-8.
  86. Thompson G, Parhofer KG. Current Role of Lipoprotein Apheresis. Current atherosclerosis reports. 2019;21(7):26.
  87. Sidney S, Cheetham TC, Connell FA, Ouellet-Hellstrom R, Graham DJ, Davis D, et al. Recent combined hormonal contraceptives (CHCs) and the risk of thromboembolism and other cardiovascular events in new users. Contraception. 2013;87(1):93-100.

Approach To Hypercalcemia

ABSTRACT


A reduction in serum calcium can stimulate parathyroid hormone (PTH) release which may then increase bone resorption, enhance renal calcium reabsorption, and stimulate renal conversion of 25-hydroxyvitamin D, to the active moiety 1,25-dihydroxyvitamin D [1,25(OH)2D] which then will enhance intestinal calcium absorption. These mechanisms restore the serum calcium to normal and inhibit further production of PTH and 1,25(OH)2D. Normal serum concentrations of total calcium generally range between 8.5 and 10.5 mg/dL (2.12 to 2.62 mM) and ionized calcium between 4.65-5.30 mg/dL (1.16-1.31 mM). Decreased PTH and decreased 1,25(OH)2D should accompany hypercalcemia unless PTH or 1,25(OH)2D is causal. Hypercalcemia may be caused by: Endocrine Disorders with Excess PTH including primary sporadic and familial hyperparathyroidism(syndromic and non-syndromic), and tertiary hyperparathyroidism; Endocrine Disorders Without Excess PTH including hyperthyroidism, pheochromocytoma, VIPoma, hypoadrenalism, and Jansen's Metaphyseal Chondrodysplasia; Malignancy-Associated Hypercalcemia, which can be caused by elevated PTH-related protein (PTHrP), or other factors (e.g. increased 1,25(OH)2D in lymphomas); Inflammatory Disorders including Granulomatous Diseases, where excess 1,25(OH)2D production may be causal, and viral syndromes (HIV); Pediatric Syndromes including Williams Syndrome and Idiopathic Infantile Hypercalcemia, where inappropriate levels of 1,25(OH)2D may occur due to a mutation in the 25-hydroxyvitamin D-24-hydroxylase gene (CYP24A1); medication, including thiazide diuretics, lithium, vitamin D, vitamin A, antiestrogens, theophylline; and prolonged immobilization, particularly in states of high bone turnover. Treatment should be aimed at the underlying disorder, however, if serum calcium exceeds 12 to 14mg/dL (3 to 3.5mM), acute hydration and agents that inhibit bone resorption are required. Under selected conditions, calcimimetics, calciuresis, glucocorticoids, or dialysis may be needed.    


DEFINITION OF HYPERCALCEMIA


Hypercalcemia can be defined as a serum calcium greater than 2 standard deviations above the normal mean in a reference laboratory. Calcium in the blood is normally transported partly bound to plasma proteins (about 45%), notably albumin, partly bound to small anions such as phosphate and citrate (about 10%) and partly in the free or ionized state (about 45%) (1). Although only the ionized calcium is metabolically active i.e., subject to transport into cells and capable of activating cellular processes, most laboratories report total serum calcium concentrations. Concentrations of total calcium in normal serum generally range between 8.5 and 10.5 mg/dL (2.12 to 2.62 mM) and levels above this are considered to be consistent with hypercalcemia. Nevertheless, reference ranges may vary between laboratories. The normal range of ionized calcium is generally 4.65-5.25 mg/dL (1.16-1.31 mM), but again values may vary slightly between laboratories. When protein concentrations, and especially albumin concentrations, fluctuate substantially, total calcium levels may vary, whereas the ionized calcium may remain relatively stable. Thus, dehydration, or hemoconcentration during venipuncture may elevate serum albumin, and a falsely elevated total serum calcium may be reported (“pseudo-hypercalcemia”). Such elevations in total calcium, when albumin levels are increased, can be "corrected" by subtracting 0.8 mg/dL from the total calcium for every 1.0 g/dL by which the serum albumin concentration is >4 g/dL. Conversely when albumin levels are low, total calcium can be corrected by adding 0.8 mg/dL for every 1.0 g/dL by which the albumin is <4 g/dL. Thus, to correct for an abnormally high or low serum albumin the following formula can be used: Corrected calcium (mg/dL) = measured total serum calcium (mg/dL) + [4.0- serum albumin (g/dL) X 0.8] or Corrected calcium (mM) = measured total Ca (mM) + [40 - serum albumin (g/L)] X 0.02. Nevertheless, although algorithms to adjust for albumin levels are widely used, their accuracy may be poor. Even in the presence of a normal serum albumin, changes in blood pH can alter the equilibrium constant of the albumin-Ca++ complex, with acidosis reducing the binding and alkalosis enhancing it. Consequently, when major shifts in serum protein or pH are present it is most prudent to directly measure the ionized calcium level in order to determine the presence of hypercalcemia.


PHYSIOLOGY OF CALCIUM HOMEOSTASIS


The extracellular fluid (ECF) concentration of calcium is tightly maintained within a rather narrow range because of the importance of the calcium ion to numerous cellular functions including cell division, cell adhesion and plasma membrane integrity, protein secretion, muscle contraction, neuronal excitability, glycogen metabolism, and coagulation.


The skeleton, the gut and the kidney play a major role in assuring calcium homeostasis. Overall, in a typical individual, if 1000 mg of calcium are ingested in the diet per day, approximately 200 mg will be absorbed. Approximately 10 g of calcium will be filtered daily through the kidney and most will be reabsorbed with about 200 mg being excreted in the urine. The normal 24-hour excretion of calcium may however vary between approximately 100 and 300 mg per day (2.5 to 7.5 mmoles per day). The skeleton, a storage site of about 1 kg of calcium, is the major calcium reservoir in the body and bone turnover (bone formation coupled with bone resorption) will determine the net entry of calcium into or egress of calcium out of the skeleton. When bone turnover is balanced, approximately 500 mg of calcium is released from bone per day and the equivalent amount is accreted per day (Fig. 1).


Figure 1. Calcium balance. On average, if, in a typical adult approximately 1g of elemental calcium (Ca+2) is ingested per day, about 200mg/day will be absorbed and 800mg/day excreted. Approximately 1kg of Ca+2 is stored in bone and about 500mg/day is released by resorption or deposited during bone formation. Of the 10g of Ca+2 filtered through the kidney per day only about 200mg appears in the urine, the remainder being reabsorbed.

Tight regulation of the ECF calcium concentration is maintained through the action of calcium-sensitive cells which modulate the production of hormones (2-5). These hormones act on specific cells in bone, gut and kidney which can respond by altering fluxes of calcium to maintain ECF calcium. The parathyroid glands detect ECF calcium via a calcium sensing receptor (CaSR) (6). Thus, a reduction in ECF calcium can reduce stimulation of the parathyroid CaSR and facilitate release of parathyroid hormone (PTH) from the parathyroid glands in the neck. PTH can then act to enhance calcium reabsorption in the kidney while at the same time inhibit phosphate reabsorption producing phosphaturia. Reduced ECF calcium per se can also act via a CaSR in the loop of Henle to allow renal calcium reabsorption.


PTH and hypocalcemia can both stimulate the conversion of the inert metabolite of vitamin D, 25-hydroxyvitamin D [25(OH)D], to the active moiety 1,25-dihydroxyvitamin D [1,25(OH)2D] (7), which in turn will enhance intestinal calcium absorption, and to a lesser extent phosphate reabsorption. 1,25(OH)2D can stimulate the production of the hormone fibroblast growth factor 23 (FGF23) from osteocytes in bone and the released FGF23 can inhibit phosphate transport in the renal proximal tubule and therefore cause phosphaturia and hypophosphatemia. PTH can also increase bone resorption and liberate both calcium and phosphate from the skeleton. The net effect of the increased reabsorption of renal calcium, the increased absorption of calcium from the gut, and the mobilization of calcium from bone, is to restore the ECF calcium to normal and to inhibit further production of PTH and 1,25(OH)2D. FGF23 elevation will also reduce 1,25(OH)2D production. The opposite sequence of events i.e., diminished PTH and 1,25(OH)2D secretion should occur when the ECF calcium is raised above the normal range and the effect of suppressing the release of these hormones should diminish skeletal calcium release, intestinal calcium absorption, and renal calcium reabsorption and restore the elevated ECF calcium to normal. Consequently, decreased levels of PTH and decreased levels of 1,25(OH)2D should accompany hypercalcemia unless the PTH or 1,25(OH)2D is the cause of the hypercalcemia.


REGULATION OF THE PRODUCTION AND ACTION OF HUMORAL MEDIATORS OF CALCIUM HOMEOSTASIS


Regulation of Parathyroid Hormone Production


PTH is an 84 amino acid peptide whose known bioactivity resides within the NH2-terminal 34 residues. Consequently, a synthetic peptide, PTH (1-34) (teriparatide), can mimic many of its actions. The major regulator of PTH secretion from the parathyroid glands is the ECF calcium acting via CaSR. The relationship between ECF calcium and PTH secretion is governed by a steep inverse sigmoidal curve which is characterized by a maximal secretory rate at low ECF calcium, a midpoint or "set point" which is the level of ECF calcium which half-maximally suppresses PTH, and a minimal secretory rate at high ECF calcium (8). The rate at which ECF calcium falls may also dictate the magnitude of the secretory response with a rapid fall in ECF calcium stimulating a more robust secretory response. As well higher levels of PTH are observed at the same ECF calcium when calcium is falling rather than rising, producing a hysteresis response (9).


CaSR has a large NH2-terminal extracellular domain which binds ECF calcium, seven plasma membrane-spanning helices and a cytoplasmic COOH-terminal domain. It is a member of the superfamily of G protein coupled receptors and in the parathyroid chief cells is linked to various intracellular second-messenger systems. Transduction of the ECF calcium signal via this molecule leads to alterations in PTH secretion.


A change in ECF calcium will also produce a change in PTH metabolism in the parathyroid cell however this response is somewhat slower than the secretory response. Thus, a rise in calcium will promote enhanced PTH degradation and the release of bioinert mid-region and COOH fragments and a fall in calcium will decrease intracellular degradation so that more intact bioactive PTH is secreted (10-12). Bioinactive PTH fragments, which can also be generated in the liver, are cleared by the kidney (13). With sustained low ECF calcium there is a change in PTH biosynthesis which represents an even slower response. Thus, low ECF calcium, acting via CaSR leads to increased transcription of the gene encoding PTH and enhanced stability of PTH mRNA (14,15). Finally, sustained hypocalcemia can eventually lead to parathyroid cell proliferation (16) and an increased total secretory capacity of the parathyroid gland. Although sustained hypercalcemia can conversely reduce parathyroid gland size, hypercalcemia appears less effective in diminishing parathyroid chief cells once a prolonged stimulus to hyperplasia has occurred.


Additional factors including catecholamines and other biogenic amines, prostaglandins (17), cations (e.g., lithium and magnesium), phosphate per se (5) and transforming growth factor alpha (TGFa) (18) have been implicated in the regulation of PTH secretion (5). The phosphaturic factor, FGF23, also suppresses PTH gene expression and secretion (19). One of the most important regulators appears to be 1,25(OH)2D which may tonically reduce PTH release (20), decrease PTH gene expression (15) and inhibit parathyroid cell proliferation (16, 21).


PTH Actions


RENAL ACTIONS


The kidney is a central organ in ensuring calcium balance and PTH has a major role in fine-tuning this renal function (22-24). PTH has little effect on modulating calcium fluxes in the proximal tubule where 65% of the filtered calcium is reabsorbed, coupled to the bulk transport of solutes such as sodium and water (23). Nevertheless, in this region PTH binds (25) to its cognate receptor, the type I PTH/PTHrP receptor (PTHR1) a 7-transmembrane-spanning G protein-coupled protein which is linked to both the adenylate cyclase system and the phospholipase C system (26-28). Stimulation of adenylate cyclase is believed to be the major mechanism whereby PTH causes internalization of the type II Na+/Pi (inorganic phosphate) co-transporters, NaPi-IIa and NaPi-IIc, in the proximal tubule, leading to decreased phosphate reabsorption and phosphaturia (29).


In this nephron region, PTH can, after binding to the PTHR1, also stimulate CYP27B1, the 25(OH)D-1a hydroxylase [1a(OH)ase], leading to increased conversion of 25(OH)D to 1,25(OH)2D (30). A reduction in ECF calcium can itself stimulate 1,25(OH)2D production. Finally, PTH can also inhibit Na+ and HCO3- reabsorption in the proximal tubule by inhibiting the apical type 3 Na+/H+ exchanger (31), and the basolateral Na+/K+-ATPase (32) as well as by inhibiting apical Na+/Pi cotransport.


About 20% of filtered calcium is reabsorbed in the cortical thick ascending limb of the loop of Henle (CTAL) and 15% in the distal convoluted tubule (DCT) and it is here that PTH also binds to PTHR1 (27) and again by a cyclic AMP-mediated mechanism (33), enhances calcium reabsorption. In the CTAL, at least, this appears to occur by increasing the activity of the Na/K/2Cl cotransporter that drives NaCl reabsorption and also stimulates paracellular calcium and magnesium reabsorption (34). The CaSR is also resident in the CTAL (35) and can respond to an increased ECF calcium by activating phospholipase A2, reducing the activity of the Na/K/2Cl cotransporter and of an apical K channel, and diminishing paracellular calcium and magnesium reabsorption. Consequently, a raised ECF calcium antagonizes the effect of PTH in this nephron segment and ECF calcium can in fact participate in this way in the regulation of its own homeostasis. Furthermore, the inhibition of NaCl reabsorption and loss of NaCl in the urine that results may contribute to the volume depletion observed in severe hypercalcemia.


In the DCT, PTH can also influence transcellular calcium transport (36). This is a multistep process involving transfer of luminal Ca2+ into the renal tubule cell via the transient receptor potential channel (TRPV5), translocation of Ca2+across the cell from apical to basolateral surface a process involving proteins such as calbindin-D28K, and finally active extrusion of Ca2+ from the cell into the blood via a Na+/Ca2+ exchanger, designated NCX1. PTH markedly stimulates Ca2+ reabsorption in the DCT primarily by augmenting NCX1 activity via a cyclic AMP-mediated mechanism.


SKELETAL ACTIONS  


In bone, the PTHR1 is localized on cells of the osteoblast lineage which are of mesenchymal origin (37) but not on osteoclasts which are of hematogenous origin. Nevertheless, in the postnatal state the major physiologic role of PTH appears to be to maintain normal calcium homeostasis by enhancing osteoclastic bone resorption, notably cortical bone resorption, and liberating calcium into the ECF. This effect of PTH on increasing osteoclast stimulation is indirect, with PTH binding to the PTHR1 on pre-osteoblastic stromal cells (38) and other cells of the osteoblast lineage including osteocytes (39) and enhancing the production of the cytokine RANKL (receptor activator of NFkappaB ligand), a member of the tumor necrosis factor (TNF) family (40). Simultaneously, levels of a soluble decoy receptor for RANKL, termed osteoprotegerin, are diminished facilitating the capacity for increased cell-bound RANKL to interact with its cognate receptor, RANK, on cells of the osteoclast series. Multinucleated osteoclasts are derived from hematogenous precursors which commit to the monocyte/macrophage lineage, and then proliferate and differentiate as mononuclear precursors, eventually fusing to form multinucleated osteoclasts (41). These can then be activated to form bone-resorbing osteoclasts. RANKL can drive many of these proliferation/differentiation/fusion/activation steps although other cytokines, notably monocyte-colony stimulating factor (M-CSF) may participate in this process (41).


Endogenous PTH has also been shown to exert a physiologic anabolic effect, particularly on trabecular bone formation in both the fetus and neonate (42,43), and intermittent exogenous PTH administration can increase both cortical and trabecular compartments in adult mice. (44). PTH has been reported to increase growth factor production, notably insulin-like growth factor-1 (IGF-1) production, which may contribute to its anabolic effect (45). In addition, the anabolic effect of PTH in part lies via activation of the canonical Wnt growth factor signaling pathway, a critical pathway for bone formation. One mechanism of this activation is via inhibition of sclerostin (39), an osteocyte-derived antagonist of the Wnt pathway. PTH has been suggested to elicit increases in production and activity of cells of the osteoblast pathway and to decrease osteoblast apoptosis (46). It is conceivable that different modes of anabolic action occur depending on the stage of development of the organism and environmental stimuli.


It has been noted that although increased PTH activity increases coupled bone turnover i.e., both osteoblastic bone formation and osteoclastic bone resorption, continuous exogenous administration of PTH in vivo can lead to net enhanced bone resorption and hypercalcemia whereas intermittent exogenous administration can lead to net increasing bone formation and therefore an anabolic effect (47).


Regulation of Vitamin D Production


Vitamin D3 (cholecalciferol) is a biologically inert secosteroid that is made in the skin (48). After exposure to sunlight 7-dehydrocholesterol is transformed by UVB radiation to previtamin D3 which undergoes isomerization into vitamin D3. Vitamin D3 is then translocated into the circulation where it is bound to the vitamin D-binding protein (DBP). There are no documented cases of vitamin D intoxication occurring due to excessive sunlight exposure most likely due to the fact that prolonged UVB exposure transforms both previtamin D3 and vitamin D3 to biologically inactive metabolites. Vitamin D3 (and vitamin D2 or ergocalciferol) can also enter the circulation after absorption from food in the gut notably fatty foods, fish oils, and foods fortified with vitamin D. In the liver, vitamin D can be converted to 25(OH)D by a cytochrome P450-vitamin D 25-hydroxylase (CYP2R1), which generally converts vitamin D to 25(OH)D almost constitutively (49).


Consequently serum 25(OH)D is the most abundant circulating metabolite of vitamin D, reflects the integrated levels of vitamin D from both cutaneous and dietary sources, and can be used as an index of vitamin D deficiency, sufficiency, or intoxication. However, 25(OH)D is also biologically inert except when present in very high concentrations, and is transported, bound to DBP, to the kidney where it is converted by the cytochrome P450- monooxygenase, 25(OH)D-1a hydroxylase (CYP27B1) to the active moiety, 1,25(OH)2D (50). Although the kidney is the major source of circulating hormonal 1,25(OH)2D, a variety of extra-renal cells have been reported to synthesize 1,25(OH)2D, notably skin cells, monocytes/macrophages, bone cells (51), and the placenta during pregnancy (52). The 1,25(OH)2D produced by many of these non-renal tissues may act in a paracrine/autocrine fashion to regulate cell growth, differentiation, and local function. The renal production of 1,25(OH)2D is stimulated by hypocalcemia, hypophosphatemia, and elevated PTH levels. The renal 1a(OH)ase is potently inhibited by the phosphaturic hormone, fibroblast growth factor (FGF) 23 and also by 1,25(OH)2D per se in a negative feedback loop. As well, FGF23 and 1,25(OH)2D can both stimulate a 24-hydroxylase enzyme (CYP24A1). This cytochrome P450 monooxygenase produces 24,25(OH)2D and 1,24,25(OH)3D from 25(OH)D and 1,25(OH)2D respectively (53). These metabolites are generally believed to be biologically inert and represent the first step in biodegradation. After several further hydroxylations, cleavage of the secosteroid side chain occurs between carbons 23 and 24 leading to the production of the inert, water-soluble end product calcitroic acid. This metabolism may occur in kidney, liver and target tissues such as intestine and bone.


Vitamin D Actions


The unbound active form of vitamin D, 1,25(OH)2D can enter target cells and interact with the ligand-binding domain of a specific nuclear receptor (VDR) (54). The 1,25(OH)2D-VDR complex heterodimerizes with the retinoid X receptor (RXR) and then interacts with a vitamin D-responsive element (VDRE) on a target gene to enhance or inhibit the transcription of such target genes. The activity of the VDR is enhanced by co-activator proteins that can also bind to discrete regions of the VDR and remodel chromatin, acetylate nucleosomal histones and contact the basal transcriptional machinery. Co-repressors can bind to the VDR in the absence of ligand and also modify its activity. Although ligand-independent VDR activation and non-genomic actions of 1,25(OH)2D have been reported their physiologic significance is currently unclear.


A major biologic function of circulating 1,25(OH)2D is to increase the efficiency of the small intestine to absorb dietary calcium. Intestinal absorption of calcium occurs by an active transcellular path and by a non-saturable paracellular path. Active calcium absorption accounts for 10-15% of a dietary load (55). Active transcellular intestinal absorption involves (as does Ca+2 reabsorption in the kidney), three sequential cellular steps, a rate-limiting step involving transfer of luminal Ca+2 into the intestinal cell via the epithelial Ca+2  channel TRPV6, or via other calcium channels, intracellular diffusion, mediated by the Ca+2 -binding protein, calbindin-D9K or by other calcium binding proteins such as calmodulin, and extrusion at the basolateral surface into the blood predominantly through the activity of the Ca+2 -ATPase, PMCA 1b (56). 1,25(OH)2D, by interacting with the VDR (57) mainly, but not exclusively, in the duodenum, appears to increase all 3 steps by increasing gene expression of TRPV6, a channel-associated protein, annexin2 calbindin-D9K and to a lesser extent, the basolateral extrusion system PMCA1b (36,56). Calcium within the cell may also be sequestered by intracellular organelles such as the endoplasmic reticulum and mitochondria which could also contribute to the protection of the cell against excessively high calcium. Increasing evidence now supports regulation by 1,25(OH)2D of active transport of calcium by distal as well as proximal segments of the intestine as well as paracellular calcium transport (58), and by modulating additional intestinal targets (59). Reductions in dietary intake of calcium can lead to increased PTH secretion and increased 1,25(OH)2D production which can enhance fractional calcium absorption and compensate for the dietary reduction. Although 1,25(OH)2D also increases phosphate absorption, mainly in the jejunum and ileum, nearly 50% of dietary phosphorus can be absorbed even in the absence of 1,25(OH)2D.


Although vitamin D is known to be essential for normal mineralization of bone, its major role in this respect appears to be largely indirect i.e., by enhancing intestinal absorption of calcium and phosphate in the small intestine, maintaining these ions in the normal range and thereby facilitating hydroxyapatite deposition in bone matrix. The major direct function of 1,25(OH)2D on bone appears to be to enhance mobilization of calcium stores when dietary calcium is insufficient to maintain a normal ECF calcium (60). As with PTH, 1,25(OH)2D enhances osteoclastic bone resorption by binding to its receptors in cells of the osteoblast lineage and stimulating the RANK/RANKL system to enhance the proliferation, differentiation and activation of the osteoclastic system from its monocytic precursors (41), but high concentrations may also inhibit calcium deposition in bone (61). Endogenous 1,25(OH)2D has also been reported to have an anabolic role in vivo (56,62).


Although effects of 1,25(OH)2D on both calcium and phosphorus handling in the kidney have been reported, it remains uncertain whether 1,25(OH)2D plays a major role in altering renal tubular reabsorption or excretion of these ions in humans.


PTHrP was discovered as the mediator of the syndrome of "humoral hypercalcemia of malignancy" (HHM) (63). In this syndrome a variety of cancers, essentially in the absence of skeletal metastases, produce a PTH-like substance which can cause a constellation of biochemical abnormalities including hypercalcemia, hypophosphatemia, and increased urinary cyclic AMP excretion. These mimic the biochemical effects of PTH but occur in the absence of detectable circulating levels of this hormone.


PTHrP is encoded by a single-copy gene, PTHLH, located on chromosome 12 whereas the gene encoding PTH is found on chromosome 11. Nevertheless, these two chromosomes encode many similar genes and are believed to have arisen by an ancient duplication event. Consequently, PTHLH and PTH may be members of a single gene family (64,65). The human PTHLH gene which is driven by at least three promoters, contains at least seven exons, shows several patterns of alternative splicing, and is considerably more complex than the PTH gene. Each gene encodes a leader or "pre" sequence, a "pro" sequence and a mature form. In the case of human PTH, the mature form is 84 amino acids. In the case of human PTHrP, 3 isoforms of 139, 141 and 173 residues can occur by alternate splicing, and sequences of these isoforms are identical through residue 139. Several common structural features of the PTHLH and PTH genes suggest that they are related. Thus, the major coding exon of both genes starts precisely at the same nucleotide, one base before the codons encoding the Lys-Arg residues of the prohormone sequences of each hormone. In the NH2 terminus of both peptides, 8 of the first 13 amino acid residues are identical. These identities although limited are believed to be responsible for the similar bioactivities of the NH2 terminal domains of these peptides (66), such that synthetic PTH (1-34) and synthetic PTHrP (1-34) interact with a common receptor (PTHR1) (26,27) and have similar effects on calcium and phosphate homeostasis. Thus, PTHrP is the second member of the PTH family to have been discovered. A hypothalamic peptide called tuberoinfundibular peptide of 39 residues (TIP 39) appears to represent a third member of the PTH gene family (67) and can interact at a second PTH receptor termed the type II receptor (PTHR2) (68) (to which PTHrP does not bind (Fig. 2). The precise physiologic role of TIP 39 (also called PTH2) and of PTHR2 remain to be elucidated, however the TIP39/PTHR2 system has been implicated in the control of nociception, fear and fear incubation, anxiety and depression-like behaviors, and maternal and social behaviors. It also appears to influence thermoregulation and potentially auditory responses (69).

Figure 2. PTH and PTHR gene families: PTHrP, PTH and TIP39 appear to be products of a single gene family. Although only nine amino acids in the NH2-terminal domains of these three peptides are conserved these are functionally important residues. The receptors for these peptides, PTHR1 and PTHR2, are both 7 transmembrane-spanning G protein-coupled receptors which seem to be products of a single gene family. PTHrP binds and activates PTHR1; it binds weakly to PTHR2 and does not activate it. PTH can bind and activate both PTHR1 and PTHR2. TIP39 can bind to and activate PTHR2 but not PTHR1.

REGULATION OF PTHrP PRODUCTION


In contrast to PTH, whose expression is limited mainly to parathyroid cells, PTHrP is widely expressed in many fetal and adult tissues (70). This is compatible with its primary role as a modulator of cell growth and differentiation. A major locus of regulation of PTHrP production is at the level of gene transcription although both regulated and constitutive secretion of the hormone have been described in various cell types (71,72).


Key stimulators of gene transcription are a variety of growth factors and cytokines (73) including epidermal growth factor (EGF) (74), IGF-1 (75), and transforming growth factor b (TGFb) (76). Inhibition of growth factor action, by employing a farnesyl transferase inhibitor to decrease ras-mediated cell signaling, has proved effective in inhibiting PTHrP production in vitro and in studies in vivo using an animal model of malignancy which overproduced PTHrP (77). Hypercalcemia associated with these tumors was also diminished.


Several steroidal hormones including 1,25(OH)2D (78), glucocorticoids (79), and androgens (80) have been reported to be potent inhibitors of PTHrP gene expression. This prompted the use of 1,25(OH)2D (81) and of low calcemic analogues of vitamin D (82) in studies with tumor cells, both in vitro and in animals in vivo, to determine if overproduction of PTHrP by these tumors could be inhibited. Indeed, PTHrP production was inhibited, the associated hypercalcemia was reduced, and survival of the animals was increased.


PTHrP is biosynthesized as a precursor form, proPTHrP and the propeptide must be cleaved to the mature peptide in order to achieve optimal bioactivity. This occurs by prohormone convertase activity (83). This processing locus was attacked using a furin antisense approach to block prohormone convertase activity in an animal tumor model which overproduces PTHrP (84). Bioactive PTHrP production was diminished with this intervention, and, in vivo, the hypercalcemia associated with the control tumor was not observed.


Serine proteases may also act on PTHrP internally, in various cell types, to cleave an NH2 terminal fragment, a midregion fragment (85) and carboxyl terminal fragments (86) from the mature forms, each with apparently distinct bioactivities. The in vivo significance of this processing remains to be determined. Nevertheless, PTHrP has been described as a polyhormone.


PTHrP ACTIONS


The major effects of PTHrP appear to be mediated by binding of an NH2 terminal domain, PTHrP (1-36), to the PTHR1 linked to adenylate cyclase, or phospholipase C. In some developing tissues, e.g., teeth. PTHrP is expressed in epithelial cells whereas the PTHR1 is in adjacent mesenchymal cells facilitating epithelial-mesenchymal interactions (87).


A mid-region domain of PTHrP (37-86) has been implicated in placental calcium transport (85) and a COOH terminal region (107-139) has been reported to inhibit osteoclasts (86). Nevertheless, distinct receptors for these putative bioactive regions have not been described.

A bipartite nuclear localization sequence (NLS) has been discovered in PTHrP at sequence positions 87 to 106 and has been shown to be capable, in vitro, of directing PTHrP to the nucleus and, in fact, to the nucleolus (88). Translocation from the cytoplasm to the nucleus is facilitated by binding to importin beta and seems cell cycle dependent. Although cyclin-dependent (cdc2) kinase can phosphorylate PTHrP this may not be the sole regulator of PTHrP nuclear import (89). Inasmuch as PTHrP contains a presequence or leader sequence which directs it to the secretory pathway, 3 pathways have been postulated which could lead it to access to the cytoplasm and thence the nucleus. Thus, PTHrP has been shown in some studies to be internalized after secretion and to access the cytoplasm by this route (90). Reverse transport of PTHrP from the endoplasmic reticulum to the cytoplasm has been reported in other studies (91). Finally, alternate initiation of translation at downstream non-AUG codons that allowed nascent PTHrP to bypass ER transit and localize to the nucleus and nucleolus has also been reported (92). In vitro studies have suggested that nuclear localization of PTHrP may be involved in its proliferative activity and/or in inhibition of apoptosis (87), and in vivo, PTHrP “knockin” mice have been reported which express truncated forms of PTHrP that lack the NLS and the carboxyl -terminus but retain the amino terminus and the capacity to bind to PTHR1. The resulting mutants show growth retardation, defects in multiple organs and early lethality. Consequently, these studies indicate a functional in vivo role for the nuclear localization of this protein (93,94).


Overall, reported physiologic effects of PTHrP can be grouped into those relating to ion homeostasis; those relating to smooth muscle relaxation; and those associated with cell growth, differentiation and apoptosis. The majority of the physiological effects of PTHrP appear to occur by short-range i.e., paracrine/autocrine and intracrine mechanisms rather than long-range i.e. endocrine mechanisms.


With respect to ion homeostasis PTHrP can modulate placental calcium transport and appears necessary for normal fetal calcium homeostasis (95). In the adult, however the major role in calcium and phosphorus homeostasis appears to be carried out by PTH rather than by PTHrP in view of the fact that PTHrP concentrations in normal adults are either very low or undetectable. This situation reverses when neoplasms constitutively hypersecrete PTHrP in which case PTHrP mimics the effects of PTH on bone and kidney and the resultant hypercalcemia suppresses endogenous PTH secretion.


PTHrP has been shown to cause smooth muscle relaxation in a variety of tissues including blood vessels (96) (leading to dilatation), uterus (97), and bladder (98). The physiologic significance of these effects however remains to be determined.


Finally, PTHrP has been shown to modify cell growth, differentiated function and programmed cell death in a variety of different fetal and adult tissues. Most notable have been breast (99), skin (100), nervous tissue (101) and pancreatic islets (102) where PTHrP appears to function to assure normal development. The most striking developmental effects of PTHrP however have been in the skeleton. Targeted deletion of the PTHrP gene in mice produces a lethal chondrodysplasia (103,104), demonstrating the important and non-redundant role of PTHrP in endochondral bone formation. Animals die at birth, although the cause of death is uncertain. A major alteration appears to occur in the cartilaginous growth plate where, in the absence of PTHrP, chondrocyte proliferation is reduced and accelerated chondrocyte differentiation and apoptosis occurs. Increased bone formation occurs, apparently due to secondary hyperparathyroidism (42) and the overall effect is a severely deformed skeleton. Even more severe skeletal dysplasia occurs when either the gene encoding the PTHR1 itself (105) or the genes encoding both PTH and PTHrP are deleted (42). Both models produce similar phenotypes in mice. In the PTHrP knock-in mice that express PTHrP (1-84) but not the NLS or carboxyl terminus, the epiphyseal growth plate was markedly abnormal in this model, but the abnormality consisted of a reduced proliferative zone but normal hypertrophic zone architecture, suggesting that secreted and intracellular PTHrP may act synergistically to regulate the growth plate. In humans, an inactivating mutation of the PTHR1 produces a similar lethal chondro-osseous dysplasia termed Blomstrand's Syndrome (106,107). Consequently these in vivo observations demonstrate that PTHrP is essential, at least for normal development of the cartilaginous growth plate and endochondral bone formation. Interestingly mice that are heterozygous for PTHrP ablation appear normal at birth but develop reduced trabecular bone as they age demonstrating an osseous phenotype due to haploinsufficiency (37). This has been shown to be via a paracrine effect of PTHrP located in osteoblastic cells (108). Furthermore, hypoparathyroid mice that have PTHrP haploinsufficiency do not develop the increased trabecular bone mass that is a characteristic of hypoparathyroidism (109). PTHrP knock-in mice that express PTHrP (1-84) but lack the NLS and carboxyl terminus also appear to develop reductions in osteoblastic activity again suggesting synergy between the extra-cellular and intracellular actions of PTHrP (110). In humans, variants of the PTHLH gene have been associated with achievement of peak bone mass and in genome wide association studies have been associated with reduced bone mineral density. Overall, therefore the two ligands of PTHR1 i.e., PTH and PTHrP appear to have differing roles in utero and post-natally. In the fetus PTH appears to exert anabolic activity in trabecular bone whereas PTHrP regulates the orderly development of the growth plate. In contrast, in postnatal life, PTHrP acting as a paracrine/autocrine modulator assumes an anabolic role for bone whereas PTH predominantly defends against a decrease in extracellular fluid calcium by resorbing bone.


MEDIATORS OF BONE REMODELING


Normal adult bone is constantly undergoing "turnover" or remodeling (111). This is characterized by sequences of activation of osteoclasts followed by osteoclastic bone resorption followed by osteoblastic bone formation, which occur on the same bone surface. The process of bone modelling is the predominant event in the growing skeleton and can lead to changes in skeletal shape, but the process can also persist into adult bone; modelling is characterized by bone-forming osteoblasts and bone-resorbing osteoclasts acting on different bone surfaces and acting independent of each other, resulting in changes in bone size and shape. The sequential cellular activities in remodeling occur on the same bone surface in focal and discrete packets in both trabecular and cortical bone and are termed bone remodeling units or bone multicellular units (BMUs). This coupling of osteoblastic bone formation to bone resorption may occur via the action of growth factors released by resorbed bone e.g., TGFb, IGF-1 and fibroblast growth factor (FGF) which can induce osteoclast apoptosis and also induce chemotaxis of osteoblast precursors, including mesenchymal stem cells, and facilitate their proliferation and differentiation at the site of repair. Homodimeric platelet-derived growth factor (PDGF) composed of two B units (PDGF-BB) may also be released from matrix and induce blood vessel formation that may also provide progenitor cells for later differentiation into osteoblasts and bone formation (112). In addition, direct activation of cells of the osteoblast phenotype by osteoclast family members appears to occur, and such “coupling “mechanisms include a number of secreted factors, as well as molecules involved in direct cell–cell communication between osteoclasts and the osteoblast lineage. Although a number of molecular signals regulating this direct osteoclast-osteoblast coupling process have been described (113), their precise in vivo role remains to be established. A number of additional systemic and local factors regulate the process of bone remodeling. In general, those factors which enhance bone resorption may do so by creating an imbalance between the depth of osteoclastic bone erosion and the extent of osteoblastic repair or by increasing the numbers of remodeling units which are active at any given time i.e., by increasing the activation frequency of bone remodeling. These latter processes can also result in thinning and ultimately in perforation of trabecular bone and in increased porosity of cortical bone. One predominant example in which osteoblastic activity does not completely repair and replace the defect left by previous resorption is in multiple myeloma; in this case it has been reported that myeloma cells may release inhibitors of the Wnt signaling pathway such as the protein Dickoff (Dkk) which inhibit osteoblast production (114), while stimulation of osteoclastic resorption continues. Such an imbalance can occasionally also occur in association with some advanced solid malignancies.


Systemic hormones such as PTH, PTHrP and 1,25(OH)2D can all initiate osteoclastic bone resorption and increase the activation frequency of bone remodeling. Thyroid hormone receptors are present in osteoblastic cells and triiodothyronine can stimulate osteoclastic bone resorption and produce a high turnover state in bone (115). Vitamin A has a direct stimulatory effect on osteoclasts and can induce bone resorption as well (116).


A variety of local factors are critical for physiologic bone resorption and regulation of the normal bone-remodeling sequence and can be produced by osteoblastic, osteoclastic and immune cells. Thus, for example, interleukin-1 (IL-1) and M-CSF can be produced by both osteoblastic cells and by cells of the osteoclastic lineage. TNFα is released by monocytic cells, TNFβ (lymphotoxin) by activated T lymphocytes, and interleukin-6 (IL-6) by osteoclastic cells (117). All can enhance osteoclastic bone resorption. Leukotrienes are eicosanoids that are produced from arachidonic acid via a 5-lipoxygenase enzyme and can also induce osteoclastic bone resorption. Prostaglandins, particularly of the E series, may also stimulate bone resorption in vitro but appear to predominantly increase formation in vivo (118). Consequently, a variety of cytokines, growth factors, and eicosanoids may be produced in the bone environment and act to regulate the bone remodeling sequence. The inappropriate production of these regulators in pathologic conditions such as cancer (Fig. 3) may therefore contribute to altered bone dynamics, altered calcium fluxes through bone, and ultimately in altered ECF calcium homeostasis.

Figure 3. Production of bone resorbing substances by neoplasms. Tumor cells may release proteases which can facilitate tumor cell progression through unmineralized matrix. Tumors cells can also release PTHrP, cytokines, eicosanoids and growth factors (eg EGF) which can act on cells of the osteoblastic lineage to increase production of cytokines such as M-CSF and RANKL and to decrease production of OPG. RANKL can bind to its cognate receptor RANK in osteoclastic cells, which are of hepatopoietic origin, and increase production and activation of multinucleated osteoclasts which can resorb mineralized bone.

HYPERCALCEMIC DISORDERS


Hypercalcemic disorders can be broadly grouped into Endocrine Disorders, Malignant Disorders, Inflammatory Disorders, Pediatric Syndromes, Medication-Induced Hypercalcemia, and Immobilization (Table 1) (119). Approximately 90% of patients with hypercalcemia have primary hyperparathyroidism (PHPT) or malignancy-associated hypercalcemia (MAH).

Table 1. Hypercalcemic Disorders

 1. Endocrine Disorders with Excess PTH Production

A. Sporadic PHPT

B. Familial Syndromic PHPT

a) Multiple Endocrine Neoplasia, Type 1 (MEN1) and 4 (MEN4)

b) Multiple Endocrine Neoplasia, Type 2A (MEN2A)

c) Hyperparathyroidism-Jaw Tumor Syndrome

C. Familial Non-Syndromic PHPT

a) Familial Isolated Hyperparathyroidism (FIH)

b) Familial Hypocalciuric Hypercalcemia (FHH) 1-3 and Neonatal Severe Primary Hyperparathyroidism (NSHPT)

c) Autoimmune Hypocalciuric Hypercalcemia

D. Tertiary Hyperparathyroidism        

 2. Endocrine Disorders without Excess PTH Production

A. Hyperthyroidism

B. Pheochromocytoma

C. Vipoma

D. Hypoadrenalism

E. Jansen`s Metaphyseal Chondrodysplasia

 3. Malignancy-Associated Hypercalcemia (MAH)

A. MAH with Elevated PTHrP

a) Humoral Hypercalcemia of Malignancy (HHM)

b) Solid Tumors With Elevated PTHrP and Skeletal Metastases

c) Hematologic Malignancies With Elevated PTHrP

B. MAH with Elevation of Other Systemic Factors

a) MAH With Elevated 1,25(OH)2D

b) MAH With Elevated Cytokines

c) Ectopic  Hyperparathryoidism

d) Multiple  Myeloma

 4. Inflammatory Disorders Causing Hypercalcemia

A. Granulomatous Disorders

B. Viral Syndromes (HIV)

 5. Pediatric Syndromes

A. Williams Syndrome

B. Idiopathic Infantile Hypercalcemia(CYP 24A1, SLC34A1 mutations)

C. Hypophosphatasia

D. Congenital Lactase Deficiency

E. Congenital Sucrase-Isomaltase Deficiency

 6. Medication-Induced

A. Thiazides                            H. Milk-Alkali Syndrome

B. Lithium                                 I. SGLT2  Inhibitors

C. Vitamin D                            J. Immune Checkpoint Inhibitors

D. Vitamin A                            K. Denosumab

E. Antiestrogens                      L.Teriparatide, Abaloparatide

F. Theophylline                        M. Foscarnet

G. Aluminum Intoxication         N. Ketogenic diet

 7. Alterations in Muscle and Bone

A. Immobilization

B. Intense Exercise

C. Rhabdomyolysis

ENDOCRINE DISORDERS ASSOCIATED WITH HYPERCALCEMIA


Endocrine Disorders Associated with Excess PTH Production

.

A detailed discussion of primary hyperparathyroidism appears in an associated Endotext chapter. Consequently, only selected issues will be addressed here.


SPORADIC PRIMARY HYPERPARATHYROIDISM


Sporadic PHPT is generally (at least 85-90% of cases) associated with a single parathyroid adenoma which overproduces PTH. Although 10-15% of cases may be associated with multigland hyperplasia, it seems prudent to consider that at least some if not most of these cases represent familial rather than sporadic disease (120). The presence of multiple adenomas should also suggest the possibility that all glands are involved as part of a familial syndrome. Malignant sporadic PHPT may occur as a consequence of parathyroid carcinoma, but is a relatively rare event (about 1% of cases).


To date, the genes that are the most strongly implicated in parathyroid adenomas underlying sporadic benign PHPT are an oncogene CCND1, that encodes a key regulator of the cell cycle (cyclin D1) and MEN1, a tumor suppressor gene, also implicated in familial multiple endocrine neoplasia type I (121). Mutations in CDKN1B/p27 and other cyclin-dependent kinase inhibitor genes, including EZH2, ZFX, CTNNB1/β-catenin, have been seen in smaller subsets of sporadic adenomas (122). as have other cyclin-dependent kinase inhibitor genes, including CDKN1A, CDKN2B, and CDKN2C which have each been implicated in familial forms of PHPT. Rare germline mutations in CDC73 (HRPT2, a tumor suppressor gene associated with the Hyperparathyroidism-Jaw Tumor syndrome (123), and implicated in most sporadic parathyroid carcinomas (124). can occasionally be observed in sporadic adenomas. Additionally, mutations in CASR, which has also been implicated in a familial form of PHPT (Familial Hypocalciuric Hypercalcemia), has occasionally been observed in sporadic PHPT (125). The glial cells missing 2 (GCM2) gene (previously called GCMB) encodes the GCM2 transcription factor, which is essential to the development of the parathyroid glands and subsequent PTH expression. Activating variants of GCM2, which have been implicated in familial isolated hyperparathyroidism (FIHP) have also been reported as potential predisposition alleles in sporadic parathyroid tumors (126-129).


Other important parathyroid regulatory pathways that may play a role in the pathogenesis of hyperparathyroidism are those related to the principal regulators or parathyroid cell proliferation and PTH secretion i.e., 1,25(OH)2D, Ca+2 and phosphate. Rarely, sporadic hyperparathyroidism with hypocalciuria may occur, caused by inhibitory antibodies to the calcium-sensing receptor. This syndrome has been termed Autoimmune Hypocalciuric Hypercalcemia (130). The clinical manifestations of these disorders are caused by the overproduction of PTH and its effect on bone resorption, on its capacity to stimulate renal 1,25(OH)2D production and renal calcium reabsorption, and on the resultant elevation of ECF calcium which can result in an increased filtered renal load of calcium. Increased ECF calcium can itself increase calcium excretion by stimulating the renal tubular CaSR and inhibiting tubular calcium reabsorption (Fig. 4).


Three major clinical subtypes of benign sporadic PHPT, the most common form of PHPT, have been described (131). In Symptomatic PHPT, the symptoms and signs of hypercalcemia are present and are determined by the rate of increase in serum calcium, and the severity of the hypercalcemia. Symptomatic PHPT may also be associated with overt skeletal and renal complications that may include fractures and/or osteitis fibrosa cystica, and/or, chronic kidney disease, nephrolithiasis and/or nephrocalcinosis.


In Asymptomatic PHPT, there are no overt symptoms or signs of hypercalcemia and the disorder is generally discovered by biochemical screening. After evaluation, target organ involvement may or may not be found. In the third subgroup, normocalcemic PHPT, skeletal or renal complications may or may not be found after clinical evaluation.


About 80% of cases of patients with benign sporadic PHPT present as mild or “asymptomatic” hyperparathyroidism in which hypercalcemia is generally less than 1mg/dL (0.25 mM) above the upper limit of normal and may be normal intermittently (132). However significant increases in serum calcium may occur even after 13 years of follow up. Excess PTH production can produce significant bone loss. Classically this is manifested by discrete lesions including subperiosteal bone resorption of the distal phalanges, osteitis fibrosa cystica characterized by bone cysts and "brown tumors" (i.e., collections of osteoclasts intermixed with poorly mineralized woven bone), and ultimately fractures. However, although these manifestations were commonly seen in the past, they are less frequently seen today (2% of cases) (133136). Whether this severe bone disease reflects a delay in detecting primary hyperparathyroidism early, or as seems equally plausible, is a manifestation of excess PTH action in the face of marginal or deficient vitamin D and calcium intake (137), remains to be determined. The more common skeletal manifestation of excess circulating PTH, reflects the "catabolic bone activity" of PTH, (138) and production of an osteoporosis clinical picture. Consequently, the severity of bone disease appears considerably diminished.


Possibly as a consequence of less severe bone disease, hypercalcemia is also less marked, the filtered load of renal calcium is lower and the incidence of kidney stones and particularly of nephrocalcinosis has declined as well. Nevertheless, hypercalciuria still occurs in 35-40% of patients with primary benign sporadic hyperparathyroidism and kidney stones occur in 15-20% (139). About 25% of patients with mild (“asymptomatic”) sporadic PHPT have been reported to develop renal manifestations within 10 years, including renal concentrating defects or kidney stones. In regions of the globe, where relative or absolute vitamin D deficiency may limit the severity of hypercalcemia and therefore the filtered load of calcium, the incidence of nephrolithiasis (10-40%) does not appear to be as different as is the incidence of bone disease.


The higher incidence of benign sporadic PHPT in women and in an older age group (140) also appears to distinguish the current presentation of this disorder in certain regions of the world. Overall, in countries where routine biochemical screening is common (with tests including serum calcium and albumin), although the incidence of PHPT rises, the presentation changes toward the asymptomatic and even the normocalcemic variants of PHPT. Healthcare system practices, as well as more routine biochemical screening of the population both appear to account for this (141,142).

Figure 4. Disordered mineral homeostasis in hyperparathyroidism. In primary sporadic hyperparathyroidism PTH is generally overproduced by a single parathyroid adenoma. Increased PTH secretion leads to a net increase in skeletal resorption with release of Ca+2 and Pi (inorganic phosphate) from bone. PTH also increases renal 1α (OH)ase activity leading to increased production of 1,25(OH)2D from 25(OH)D and increased Ca+2 and Pi absorption from the small intestine. PTH also enhances renal Ca+2 reabsorption and inhibits Pi reabsorption resulting in increased urine Pi excretion. The net result is an increase in ECF calcium and a decrease in ECF phosphate.

Abnormalities other than skeletal and renal have been associated with benign sporadic PHPT. These include gastrointestinal manifestations such as dyspepsia and acute pancreatitis. The incidence of peptic ulcer disease in sporadic PHPT is currently estimated to be about 10%, the same as in the general population but, the presence of multiple peptic ulcers may suggest the presence of multiple endocrine neoplasia type I (MENI). Acute pancreatitis. may be a manifestation of hypercalcemia per se but is estimated to occur in only 1.5% of those with sporadic PHPT. Neuromuscular abnormalities manifested by weakness and fatigue and accompanied by EMG changes may occur although the pathophysiology is uncertain. The relationship of hypertension and other cardiovascular manifestations as well as neuropsychiatric symptoms to the hyperparathyroidism remains unclear inasmuch as the former is generally not reversible when the hyperparathyroidism is treated and the latter is quite common in the population at large and difficult to ascribe to hyperparathyroidism. Rarely, primary sporadic PHPT may present with severe acute hypercalcemia (parathyroid crisis) (143).


Surgical removal of the parathyroid adenoma currently remains the treatment of choice if the serum calcium is consistently greater than 1mg/dL (0.25mM) above normal; if there is evidence of bone disease [i.e. a BMD T-score of <−2.5 at the lumbar spine, total hip, femoral neck, or 33% radius (1/3 site), and/or a previous fracture fragility or a fracture diagnosed on imaging ( densitometric vertebral fracture assessment [ VFA] or vertebral X-ray) ]; if there is evidence of renal involvement [i.e. if eGFR or creatinine clearance is reduced to <60 ml/min, the urinary calcium excretion is greater than 250mg/d (>6.2 mmol) for women or greater than 300mg/d (>7.48 mmol) for men, or it there is evidence of nephrocalcinosis or nephrolithiasis by ultrasound or x-ray or other imaging modality; (144). Surgery is also indicated if the patient is less than age 50. and in patients for whom medical surveillance is either not desired or not possible (145).


Parathyroid imaging is not recommended to establish or confirm the diagnosis of PHPT, but has become routine for preoperative localization of the abnormal parathyroid tissue. The most commonly employed preoperative parathyroid imaging techniques are radionuclide imaging (i.e., technetium-99 m-sestamibi subtraction scintigraphy), high resolution neck ultrasound and contrast-enhanced four dimensional (4D) computed tomography (CT). Magnetic resonance imaging, and positron emission tomography scanning, arteriography, and selective venous sampling for PTH are usually reserved for patients who have not been cured by previous explorations or for whom other localization techniques are not informative or are discordant.


The type of surgical procedure i.e., noninvasive or standard, and the use of operative adjuncts (e.g., rapid PTH assay) is institution specific and should be based on the expertise and resource availability of the surgeon and institution. Where more than one gland is enlarged it is reasonable to assume that this is multiple glandular disease and removal of 3½ glands is indicated. Severe, chronic hypercalcemia is more commonly associated with parathyroid carcinoma. Complete resection of the primary lesion is urgent in this case.


For those patients with PHPT who meet guidelines for surgery but are unable or unwilling to undergo parathyroidectomy, medical therapy may be considered. Calcium intake should be 800 mg/day for women <50 and men <70 years of age, 1000 mg/day for women >50 and men >70 years old (corresponding to the U.S. Institute of Medicine nutritional guidelines). If necessary, vitamin D should be supplemented to achieve levels of 25OHD which are >30 ng/mL (70mmol/L) but less than the upper limit of normal for the laboratory reference range. The calcimimetic agent cinacalcet (146) (that mimics or potentiates the action of calcium at the CaSR) may be used be used in patients with PHPT with severe chronic hypercalcemia who are not surgical candidates, in order to reduce the serum calcium concentration into the normal range. Bisphosphonates, e.g., alendronate (147), or denosumab, can be employed to increase bone density if there are no contraindications. Bisphosphonates or denosumab in combination with cinacalcet can be considered to lower the serum calcium and to increase BMD.


Although estrogen therapy has been advocated for the treatment of PHPT in postmenopausal women (148) potential adverse effects of estrogen therapy, including breast cancer and cardiovascular complications, make this option unattractive. The effect of conjugated estrogen on the reduction of serum calcium is inconsistent (149,150). Although selective estrogen receptor modulators may be an alternative (149), and a very short-term report with raloxifene demonstrated a significant reduction in the serum calcium concentration, (151) few long-term studies have been done to assess this.


FAMILIAL SYNDROMIC PRIMARY HYPERPARATHYROIDISM   


Although familial PHPT syndromes are dominantly inherited, approximately 10% may occur through de novo pathogenic variants. Genetic evaluation should be considered for patients <30 years old, those with multigland disease by history or imaging, and/or those with a family history of hypercalcemia and/or a syndromic disease. Family history was the strongest predictor of hereditary PHPT in a recently reported cohort (152).


Multiple Endocrine Neoplasia, Type 1 and 4 (MEN1 and 4)


MEN1 is a familial disorder with an autosomal dominant pattern of inheritance which is characterized by tumors in the anterior pituitary, parathyroid, and enteropancreatic endocrine cells (although tumors in several other endocrine and non-endocrine tissues may also be associated with the syndrome) (153) (Fig. 5). Patients exhibit loss-of-function germline mutations in the tumor suppressor gene, MEN1, which encodes the nuclear protein, menin (154).


Tumors in a proband in at least 2 MEN1 sites (pituitary, parathyroid, or enteropancreatic endocrine cells) and in at least one of these sites in a first-degree relative confirms the clinical phenotype. The most common and the earliest endocrinopathy is PHPT (80-100% of cases) (155). In contrast to sporadic PHPT however MEN1 occurs in both sexes equally and patients are younger at the time of diagnosis. Furthermore, in contrast to the frequent occurrence of a single adenoma in sporadic disease, multigland involvement in an asymmetric fashion is the norm in MEN1. Enteropancreatic tumors are usually multiple and gastrinomas are the most common. These may produce the Zollinger-Ellison Syndrome, and occur in the duodenum as well as in the pancreatic islets. Gastrinomas can potentially produce considerable morbidity due to the potential for ulcers and the possibility of metastatic disease.Insulinomas, glucagonomas, VIPomas, and other islet tumors can occur as well. A variety of functioning anterior pituitary tumors can occur although prolactinomas are most frequent and anterior pituitary tumors may also be non-functioning. Finally, foregut carcinoids and other endocrine tumors have been described with lesser frequency and skin tumors such as facial angiofibromas and truncal collagenomas may occur and appear specific for MEN1.


Probands or kindreds with MEN1-like features with germline autosomal dominant mutation of the cyclin dependent kinase inhibitor CDKN1B, encoding P27 (Kip1) have been described and the syndrome named MEN4. Patients with MEN4 are characterized by the same combination of tumors as MEN1 but MEN4 is a rarer cause of hereditary PHPTH; thus, the prevalence of MEN4 among all MEN1 probands plus MEN1-like probands is approximately 1%.

Figure 5. Familial hyperparathyroidism. Familial hyperparathyroidism (FHPT) can occur in the MENI Syndrome, in which MEN1 is mutated; in MEN4 in which CDKN1B is mutated; in the MEN2A Syndrome, in which RET is mutated; in FHH and NSHPT in which CaSR, GNA11 or AP2S1 is mutated; and in the Hyperparathyroidism-Jaw Tumor (HPT-JT) Syndrome in which CDC73 is mutated. Familial isolated hyperparathyroidism (FIH) refers to familial hyperparathyroidism in the absence of the specific features of the other documented syndromes and suggests that other genes relevant to parathyroid neoplasia await identification, although variants of several genes identified with syndromic FHPT have been found in some with this disorder.(eg MEN1, CDKN1B, CDC73, and GCM2).

Patients with hyperparathyroidism due to MEN1 have multiglandular disease and surgical resection of fewer than 3 glands lead to high rates of recurrence. Consequently, either subtotal parathyroidectomy with 3½ gland removal or total parathyroidectomy is recommended.


Multiple Endocrine Neoplasia, Type 2A (MEN2A)


MEN2A is an autosomal dominant familial syndrome characterized by medullary thyroid carcinoma (MTC), pheochromocytomas, and hyperparathyroidism (156,157). This syndrome results from activating germline mutations in the rearranged during transfection (RET) protooncogene which is a receptor tyrosine kinase (158). Two variants of this disorder are MEN2B (also called MEN3) which includes familial MTC, familial pheochromocytomas, mucosal and intestinal neuromas, and a Marfanoid habitus, but no hyperparathyroidism, and familial MTC alone (159). Two other variants of MEN2 include MEN2 with cutaneous lichen amyloidosis, and MEN2 with Hirschsprung's disease. Analyses of RET mutations in these syndromes have provided good genotype-phenotype correlations (160).


The dominant feature of the MEN2A syndrome is MTC, a calcitonin-secreting neoplasm of thyroid C cells (161). Genetic testing for mutations in the RET oncogene is of value in considering prophylactic thyroidectomy to prevent MTC. Another major feature is pheochromocytomas which are frequently bilateral but which generally have low malignant potential.


Hyperparathyroidism is milder and less frequent (5-20%) in MEN2A than in MEN1 but is also associated with multigland involvement in which gland enlargement may be asymmetric. The treatment of the hyperparathyroidism is as for MEN1.


Hyperparathyroidism-Jaw Tumor Syndrome 


Hyperparathyroidism - Jaw Tumor Syndrome (HPT-JT) is an autosomal-dominant syndrome with incomplete penetrance and variable expression, caused by germline inactivating pathogenic variants in the tumor suppressor gene, Cell Division Cycle 73 (CDC73) (formerly called HRPT2), which encodes a protein termed parafibromin. Patients may present with early onset of single or multiple cystic parathyroid adenomas which may develop asynchronously, and ossifying fibromas of the mandible and maxilla. These jaw tumors lack osteoclasts and therefore differ from "brown tumors" (162,163). Affected individuals also have an increased risk (15–38%) of developing parathyroid carcinoma. Surgical removal of the affected parathyroid tissue is clearly indicated in this disorder. A variety of renal tumors have been described in some kindreds and other e.g., uterine tumors have been described in others. Mutations in CDC73, have been implicated in this syndrome (123), in sporadic parathyroid cancer (124), and in a minority of families with isolated hyperparathyroidism (164). Genetic testing in relatives can result in identification of individuals at risk for parathyroid carcinoma, enabling preventative or curative parathyroidectomy.


FAMILIAR NON-SYNDROMIC PRIMARY HYPERPARATHYROIDISM  


Familial Isolated Hyperparathyroidism (FIH)


Familial Isolated Hyperparathyroidism (FIH) has been reported in which familial PHPT occurs in the absence of any other manifestation of the familial disorders described. The genetic etiology of FIHP is not fully understood but can arise due to pathogenic variants in genes associated with syndromic PHPT such as MEN1, CDKN1B and CDC73, which raises the possibility that FIHP is an incomplete manifestation of a syndromic form of PHPT. FIHP can also occur with activating pathogenic variants in GCM2. Such activating GCM2 variants may contribute to facilitating more aggressive parathyroid disease (165). Undoubtedly additional research will uncover new genetic mutations which contribute to the pathogenesis of these cases.


Familial Hypocalciuric Hypercalcemia (FHH) and Neonatal Severe Primary Hyperparathyroidism (NSHPT)


Familial hypocaliciuric hypercalcemia (FHH) (166), also called Familial Benign Hypercalcemia (FBH) (167) is an autosomal dominant inherited trait, causing a lifelong generally benign disorder of hypercalcemia. Inasmuch as the increased ECF calcium is inadequately sensed by altered CaSR function in the parathyroid gland, mild hyperplasia may also occur and "normal" levels or elevated levels of PTH are secreted despite the hypercalcemia. While most patients with FHH are asymptomatic, chondrocalcinosis and acute pancreatitis have occasionally been observed. Patients with FHH have often been misdiagnosed as having PHPT, since both disorders can have elevated or inappropriately normal PTH levels with elevated serum calcium. The hallmark feature of FHH is an inappropriately low urine calcium in relationship to the prevailing hypercalcemia i.e., a calcium/ creatinine clearance ratio (CCCR), which is typically < 0.01; nevertheless, 20% of FHH patients may have a CCCR > 0.01, and therefore be indistinguishablefrom individuals with PHPT.


The molecular basis, in most cases, is a loss-of-function mutation in the calcium-sensing receptor (CaSR) gene (168) in which case the syndrome is now called FHH1. The protein product, CaSR, is a G-protein coupled receptor that predominantly signals via the G-protein subunit alpha-11 (Gα11) to regulate calcium homeostasis. As a consequence, in heterozygotes, diminished ability of the CaSR in the parathyroid cell and in the CTAL of the kidney to detect ECF calcium occurs leading to increased PTH secretion and enhanced renal tubular reabsorption of calcium and magnesium respectively, leading to hypercalcemia, and often hypermagnesemia. Inactivating variants in the GNA11gene, encoding Gα11 have also been reported to cause the syndrome, now termed FHH2. Hypercalcemia may be milder in FHH2 than in FHH1 (159). Adaptor protein-2 δ-subunit (AP2 δ) plays a pivotal role in clathrin-mediated endocytosis of CaSR Missense variants of the AP2S1 gene, encoding AP2 δ may also occur. causing the syndrome, FHH3, which is associated with the highest serum calcium levels. All FHH forms are inherited in an autosomal dominant fashion.


Genetic testing may be of particular value when hypocalciuric hypercalcemia occurs in an isolated patient withoutaccess to additional family members or familial isolated hyperparathyroidism (FIH) occurs in the absence of classicalfeatures of FHH.


In view of the fact that the increased renal reabsorption of calcium related to loss of CaSR function, and therefore hypercalcemia, persist after parathyroidectomy, and that the patients are generally asymptomatic, it is important to identify these patients to ensure that they are not subjected to parathyroidectomy.


Individuals who are homozygous for the mutated genes, or who are compound heterozygotes and therefore have little functional CaSR, can develop Neonatal Severe Hyperparathyroidism (NSHPT) (169). This disorder generally presents within a week of birth and is characterized by severe life-threatening hypercalcemia, hypermagnesemia, increased circulating PTH concentrations, massive hyperplasia of the parathyroid glands and relative hypocalciuria. Skeletal abnormalities include demineralization, widening of the metaphyses, osteitis fibrosa and fractures. This disorder may be lethal without urgent total parathyroidectomy.

Heterozygous inactivating variants in CASR can also present in the neonatal period with a less severe, intermediate form of PHPT.


Autoimmune Hypocalciuric Hypercalcemia


A biochemical phenotype of PTH-dependent hypercalcemia resembling that caused by heterozygous inactivating mutations of the CaSR in FHH1 can be observed in patients with antibodies to the extracellular domain of CaSR, which appear to inhibit activation of the CaSR by ECF Ca, and thereby stimulate PTH release. Autoimmune hypocalciuric hypercalcemic is an acquired disorder of extracellular calcium sensing that should be differentiated from that caused by inactivating mutations of the CasR (170).


TERTIARY HYPERPARATHYROIDISM  


Tertiary hyperparathyroidism, is a clinical state due to the autonomous function of parathyroid tissue that develops in the face-of-long-standing secondary hyperparathyroidism (171).


Tertiary hyperparathyroidism may occur with monoclonal expansion of nodular areas of the parathyroid gland. These in turn can be associated with decreased VDR and decreased CaSR expression which may lead to an increased set point for PTH secretion. The most common circumstance in which this occurs is in chronic renal failure where 1,25(OH)2D deficiency, hyperphosphatemia and hypocalcemia produce chronic stimulation of the parathyroid glands. However, tertiary hyperparathyroidism may occur in malabsorption syndromes (e.g., active celiac disease, extensive bowel resection, gastric bypass surgery)., and has also been described in some cases of X-linked hypophosphatemic rickets, or other hypophosphatemic osteomalacias, after long-term treatment with supplemental phosphate which is believed to induce intermittent slight decreases in ECF calcium and stimulation of PTH secretion. Tertiary hyperparathyroidism should be readily identified by the clinical context in which the hypercalcemia presents. In symptomatic patients, the use of the calcimimetic agent, cinacalcet, which enhances the capacity of ECF calcium to stimulate the CaSR, may be tried or surgical treatment may be required, i.e., either sub-total removal of the parathyroid mass or total parathyroidectomy


Endocrine Disorders Without Excess PTH Production


HYPERTHYROIDISM


Hypercalcemia has been reported in as many as 50% of patients with thyrotoxicosis (172). Bone turnover and resorption are increased due to direct effects of increased triiodothyronine on bone (173,174). The liberated calcium appears to suppress PTH release so that 1,25(OH)2D levels are reduced and renal calcium reabsorption is diminished. Treatment with a beta-adrenergic antagonist may reduce the hypercalcemia and therapy of the hyperthyroidism reverses the hypercalcemia (175,176).


PHEOCHROMOCYTOMA  


Hypercalcemia has been reported with pheochromocytomas and may be due to excess PTHrP production (177).Serum PTHrP concentrations may be reduced by alpha-adrenergic blockers in these patients (178).


VIPOMA


Hypercalcemia has frequently been reported in association with the neuroendocrine tumor VIPoma but whether the hypercalcemia is due to the overproduction of vasoactive intestinal polypeptide (VIP) per se causing bone resorption or to other co-secreted peptides such as PTHrP is uncertain (179).  


HYPOADRENALISM


Although both primary and secondary hypoadrenalism have been associated with hypercalcemia (180,181), the underlying etiology is unclear. Ionized calcium appears to be elevated and PTH and 1,25(OH)2D are suppressed. The hypercalcemia is reversed by volume expansion and glucocorticoids.


JANSEN’S METAPHYSEAL CHONDRODYSPLASIA   


Jansen's Syndrome is a rare autosomal dominant form of short-limbed dwarfism in which neonates presents with metaphyseal chondrodysplasia, hypercalcemia, and hypophosphatemia which is lifelong (182). PTH and PTHrP levels in serum are undetectable but renal tubular reabsorption of phosphate is decreased and urinary cyclic AMP is increased. An activating mutation of the PTHR1 has been described in such patients. A variety of skeletal abnormalities have been noted which reflect the overactivity of PTH and PTHrP during development, growth and in the adult skeleton.


MALIGNANCY-ASSOCIATED HYPERCALCEMIA


It has been estimated that hypercalcemia can occur in up to 10% of malignancies. Malignancy-associated hypercalcemia (MAH) can occur in the presence or the absence of elevated PTHrP production. Using two-site immunoradiometric assays for PTHrP several groups have confirmed that 50-90% of patients with solid tumors and hypercalcemia and 20-60% of patients with hematologic malignancies and hypercalcemia have elevated circulating PTHrP. MAH both with and without elevated serum PTHrP concentrations will therefore be discussed.


MAH With Elevated PTHrP


HISTORICAL CONSIDERATIONS


The association between hypercalcemia and neoplastic disease was first reported in the 1920's and the suggestion was made that the direct osteolytic action of malignant cells was responsible for the release of calcium from bone, resulting in hypercalcemia (183). An association between neoplasia and hypercalcemia was later reported in the English medical literature (184). In 1941 Fuller Albright, while discussing a case of a patient with a renal cell carcinoma, who in fact had a bone metastasis, noted that hypophosphatemia should not have accompanied the hypercalcemia if the tumor was simply producing hypercalcemia by causing osteolysis (185). He suggested that the tumor might be secreting a hypercalcemic substance which was also phosphaturic. Consequently, the concept of "ectopic" PTH production by tumors arose and lead to the term “ectopic hyperparathyroidism” (186) or “pseudohyperparathyroidism”. Nevertheless, immunoreactive PTH could not be detected in the circulation of these patients (187) and PTH mRNA could not be detected in their tumors (188). To circumvent these issues, bioassays sensitive to PTH were employed to identify PTH-like bioactivity in blood and tumor extracts (189,190) and eventually to identify a novel protein (191), PTHrP. Despite the limited homology of PTH and PTHrP within the NH2-terminal 13 amino acids, PTH (1-34) and PTHrP (1-34) exhibit similar effects on raising blood calcium and lowering blood phosphorus, reducing renal calcium clearance, and inhibiting the renal tubular reabsorption of phosphate. The molecular basis of these effects was shown to be cross-reactivity at the PTHR1. In animal models of MAH associated with high PTHrP secretion, passive immunization with PTHrP antiserum reduced hypercalcemia (192,193). Initially after passive immunization, urine calcium increased reflecting reduction in PTHrP induced renal calcium reabsorption; only subsequently did urine calcium decline as bone resorption was neutralized and the filtered load of calcium fell (193). Consequently, the hypercalcemia induced by PTHrP involved a renal mechanism as well as an osseous one. Other similarities were noted between PTHrP and PTH including similar capacities to raise 1,25(OH)2D levels (194) and effects on bone characterized, for both PTHrP and PTH, by enhanced bone turnover and increased bone formation as well as resorption (195).


HUMORAL HYPERCALCEMIA OF MALIGNANCY


The classic neoplasms associated with hypercalcemia and excess PTHrP have few or no skeletal metastases, and are solid tumors (Fig. 6). This constellation has been termed humoral hypercalcemia of malignancy (HHM). The availability of assays to detect PTHrP demonstrated a broad spectrum of tumors that produce the peptide (196-200). Hypercalcemia is notably associated with squamous cell tumors arising in most sites including esophagus, cervix, vulva, skin, and head and neck, but especially in lung. Renal cell carcinomas are also commonly associated with the syndrome as are bladder and ovarian carcinomas. On the other hand, patients with colon, gastric, prostate, thyroid, and non-squamous cell lung cancers manifest hypercalcemia much less commonly.

Figure 6. Growth factor-regulated PTHrP production in tumor states. Tumor cells at a distance from bone may be stimulated by autocrine growth factors (GF) to increase production of PTHrP which can then travel to bone via the circulation and enhance bone resorption. Tumor cells metastatic to bone (inset) may secrete PTHrP which can resorb bone and release growth factors which in turn can act in a paracrine manner to further enhance PTHrP production. PTHrP may itself promote tumor growth and progression.

Inasmuch as PTHrP is broadly distributed in normal tissues, PTHrP secretion by tumors likely represents eutopic overproduction rather than ectopic PTHrP production. Although demethylation of the PTHrP promoter (201) and gene amplification (202) have been implicated as mechanisms responsible for PTHrP overproduction by malignancies, it seems likely that in most cases overproduction of PTHrP is driven by enhanced gene transcription of tumor growth factors and by oncogenes which are signaling molecules in the growth factor pathways, e.g., TGF-β which can increase the Gli2 signaling molecule and stimulate PTHrP (203).


Patients who manifest hypercalcemia usually present with advanced disease. These tumors are generally obvious clinically when hypercalcemia occurs, and carry a poor prognosis. Elevated PTHrP per se may be an independent prognostic factor signaling a poor prognosis (204). This appears to be because in addition to its role in hypercalcemia,(205) PTHrP produced by tumor cells acts in an intracrine manner, increasing cell survival, apoptosis resistance, and anoikis evasion, and in autocrine manner via the PTHR1 to increase tumor cell proliferation, survival, apoptosis resistance. PTHrP is also a potential candidate for premetastatic niche formation in bone marrow, causing expansion of myeloid cells required for forming a conducive niche for metastatic growth in bone. PTHrP can also upregulate tumor-surface expression of the GPCR,CXCR4(C-X-C chemokine receptor type 4) (206). PTHrP and TGFβ can also co-stimulate tumor cell production of IL-8, which can then further enhance CXCR4 expression. CXCL12, the natural ligand of CXCR4, is highly expressed in the bone microenvironment (as well as in other potential metastatic sites including lung and liver) and acts as a chemoattractant of circulating tumor cells, facilitating the homing of tumor cells to bone (207) and metastatic seeding.


Thus, PTHrP participates in all steps of the metastatic process, including tumor growth, progression, invasion, migration and survival in bone in order to skeletal support metastases (208).


Hypercalcemia in association with malignancy is generally more acute and severe than in association with primary hyperparathyroidism. (209). Nevertheless, as in primary hyperparathyroidism hypercalcemia is accompanied by hypophosphatemia, reduced tubular reabsorption of phosphorus, enhanced tubular reabsorption of calcium, and increased excretion of nephrogenous cyclic AMP, reflecting the PTH-like actions of PTHrP. Nevertheless, serum 1,25(OH)2D concentrations which are generally high or high normal in hyperparathyroidism are frequently low or low normal in HHM (210). This may reflect the higher levels of ambient calcium observed in HHM which may directly inhibit the renal 1a(OH)ase enzyme. In hyperparathyroidism, bone resorption is increased but osteoblastic bone formation is also accelerated reflecting a relatively balanced increase in turnover. However, in HHM, osteoclastic bone resorption is markedly increased and osteoblastic bone formation may be reduced (211). The reasons for this uncoupling are unclear and could reflect the action of osteoblast inhibitory factors co-released from the tumor or in the bone microenvironment or perhaps the effect of the very high levels of calcium per se.


SOLID TUMORS WITH ELEVATED PTHrP AND SKELETAL METASTASES


Several studies have indicated that elevated PTHrP correlates better with hypercalcemia than does the presence or absence of skeletal metastases (196,198,200). This appears particularly relevant to certain neoplasms such as breast cancer which is commonly associated with hypercalcemia but is even more commonly associated with osteolytic skeletal metastases. Elevated circulating PTHrP concentrations (198,199) may contribute to the development of hypercalcemia in these cases in part through augmented bone resorption and in part through increased renal calcium reabsorption. PTHrP may also contribute to the pathogenesis of local osteolytic lesions (212,213). PTHrP per se may be a supportive factor for the growth and progression of cancers by acting in paracrine, autocrine and intracrine modes to modulate tumor cell proliferation, apoptosis, survival, and anoikis, and can therefore influence cell processes which enhance the capacity for tumor dissemination and metastasis (205). In addition, tumors, such as breast tumors that are metastatic to bone, may release PTHrP in the bone microenvironment which will bind to cells of the osteoblastic lineage (including stromal cells, osteoblasts and likely osteocytes), release RANKL ligand (RANKL) and decrease osteoprotegerin (OPG), stimulate osteoclasts  to resorb bone and release, in addition to calcium, growth factors such as TGFb (214), IGF-1 FGF, PDGF and BMP; released growth factors can then stimulate further PTHrP release from the tumor, thus setting up a positive feedback loop (Fig. 6, see above). PTHrP released from cancers such as osteoblasts may also release the chemokine and angiogenic factor CCL2/MCP-1 from osteoblasts which may also increase osteoclastic activity and potentially angiogenesis, and further enhance tumor proliferation (215). Consequently, the presence of skeletal metastases in association with a malignancy is not mutually exclusive with high circulating PTHrP, which can contribute to the hypercalcemia, through both osseous and renal mechanisms; at the same time, locally released PTHrP may contribute to the focal osteolysis. It is in fact uncertain whether local osteolysis per se ever effectively raises ECF calcium in the absence of some cause of reduced renal calcium excretion.


HEMATOLOGIC MALIGNANCIES WITH ELEVATED PTHrP


Hematologic malignancies that may cause hypercalcemia (216,217) include non-Hodgkin's lymphoma, chronic myeloid and lymphoblastic leukemia, adult T cell leukemia/lymphoma (ATL) and multiple myeloma.


ATL is an aggressive malignancy that develops after 20-30 years of latency in about 5% of individuals infected with human T-cell lymphotrophic virus type I (HTLV-I). This tumor can be associated with hypercalcemia and increased PTHrP production (218). The mechanism of PTHrP production appears to be stimulation of the PTHrP promoter by the viral protein TAX in the infected lymphoid cells, causing increased PTHrP gene transcription.


Non-Hodgkin's lymphoma may also be associated with increased PTHrP secretion and hypercalcemia and this appears to occur predominantly in patients with late-stage disease and high-grade pathology (217). Multiple Myeloma, although frequently associated with hypercalcemia (about 30% of cases) is rarely associated with increased PTHrP production.


UTILITY OF PTHrP ASSAYS  


PTHrP assays that recognize NH2-terminal regions or mid-regions of the molecule, and two-site assays detecting two molecular epitopes have been developed. These assays have generally been quite sensitive and specific and successful in detecting PTHrP in MAH where PTHrP overproduction occurs. Circulating levels in normal individuals are generally low or undetectable. Studies have also shown that PTHrP levels do not fall after treatment of the hypercalcemia of MAH but do fall after reducing the tumor burden (198,219). Consequently, the assays may prove useful to track PTHrP as a tumor marker to monitor the course of therapy. Detection of elevated serum PTHrP concentrations in malignancy may, however, predict a poor prognosis (220). Nevertheless, further work is necessary to understand the identity of circulating PTHrP fragments in order to produce even more useful assays. In most reported NH2-terminal or mid-region assays, PTHrP levels may be elevated in some normocalcemic cancer patients. Whether this represents the detection of bioinert fragments which might be useful as tumor markers or the detection of bioactive PTHrP which presages the development of hypercalcemia and therefore also has predictive value needs to be clarified.


MAH with Elevation of Other Systemic Factors


Although PTHrP is the principal mediator of MAH, and elevated circulating PTHrP levels correlate strongly with hypercalcemia in patients with common tumors of widely diverse histological origin, other systemic factors have been described which may act with PTHrP or in the absence of PTHrP.


MAH WITH ELEVATED 1,25(OH)2D


Concentrations of 1,25(OH)2D are generally normal or low in most patients with MAH, however elevated serum concentrations have been reported in some cases of non-Hodgkin's and Hodgkin's lymphoma in association with hypercalcemia (149,150,221). In view of the fact that extra-renal production of 1,25(OH)2D has been shown in various cell types and that renal impairment accompanied several of the reported lymphoma cases it seems likely that synthesis was occurring in the tumor tissue. This would be analogous to expression of a 1a(OH)ase enzyme in granulomatous tissue. Although it is likely that elevated 1,25(OH)2D contributed to the hypercalcemia, co-production of PTHrP has also been reported in some cases (216). Consequently, production of 1,25(OH)2D, lymphoid cytokines and PTHrP individually or in concert might all contribute to disordered skeletal and calcium homeostasis in these tumor states.


MAH WITH ELEVATED CYTOKINES  


A variety of manifestations of malignancy including anorexia, cachexia, and dehydration may be due to tumor-produced circulating proinflammatory cytokines. Cytokines such as Il-1, IL-6, IL-8, IL-11, TNF, and RANKL which are produced in the bone microenvironment have been identified as regulators of bone turnover. PTHrP released from tumors may increase the local production of several of these cytokines however animal studies have reported that tumor activity can increase systemic levels of certain cytokines such as IL-6 and IL-1 which may contribute along with PTHrP to skeletal lysis and hypercalcemia. Some studies of tumor models have implicated a soluble form of RANKL as contributing to MAH (151). Overall, therefore it seems likely that other modulators of skeletal and calcium metabolism may be secreted by malignancies and, generally in the presence but occasionally in the absence of PTHrP, may contribute to the dysregulation of bone and mineral homeostasis occurring with MAH.


ECTOPIC HYPERPARATHYROIDISM  


Inasmuch as PTH per se is expressed mainly in the parathyroid gland, the secretion of PTH by non-parathyroid tumors constitutes true ectopic hyperparathyroidism. A number of such cases of MAH with true PTH production have now been well documented by immunological and molecular biological techniques (222,223). These tumors include ovarian, lung, thyroid, thymus and gastric malignancies (224). Consequently, true ectopic hyperparathyroidism may occur as a cause of MAH, but is rare.


MULTIPLE MYELOMA


Unlike other hematologic malignancies, multiple myeloma appears to have a special predilection to grow in bone (225). This may be related to production of growth factors, notably IL-6, by osteoblastic and osteoclastic cells, which facilitate its growth, and factors such as MIP-1a which may promote its adherence to bone. The annexin AXII axis also appears to play a critical role in supporting multiple myeloma cell growth and adhesion to stromal cells/osteoblasts in the bone marrow (226). In order to grow in bone, myeloma cells must secrete bone-resorbing factors. A number of such factors have been implicated including MIP-1a, IL-1, IL-6, TNF-b (lymphotoxin) and hepatocyte growth factor (HGF). Increased RANKL expression by stromal cells with decreased OPG expression also occurs in multiple myeloma and this correlates with the extent of the bone resorption (227). Although bone resorption is stimulated there is little active new bone formation. Consequently, the serum alkaline phosphatase, a marker of osteoblast function is usually normal and bone scans may be negative. Production by myeloma cells of Dickkopf-1 (DKK-1) protein, a soluble inhibitor of signaling via the Wnt pathway, an important growth factor pathway for osteoblasts, has been implicated in the suppression of osteoblast differentiation (228). Other Wnt signaling antagonists, such as soluble-frizzled-related protein (229) and sclerostin (230) have also been implicated in inhibition of osteoblast differentiation in myeloma. All patients with myeloma therefore have extensive bone destruction which may be discrete and focal or diffuse throughout the axial skeleton. Consequently, bone pain is a frequent complaint (80% of cases) and pathological fractures are a disabling consequence.


Although all patients develop osteolysis, hypercalcemia occurs in only about 30% of patients. It is likely that as long as renal function is intact and no circulating factor is produced which enhances renal calcium re-absorption (PTHrP is rarely produced by myeloma cells), increased renal excretion of calcium can accommodate the increased filtered load consequent to bone resorption. Impairment of renal function can occur however due to Bence Jones nephropathy or "myeloma kidney" (in which free light chain fragments of immunoglobulins are filtered and damage glomerular and tubular function), or due to amyloidosis, uric acid nephropathy, or recurrent infections. At this time hypercalcemia may become evident and be associated, because of the renal damage, with hyperphosphatemia rather than the hypophosphatemia occurring in other disorders causing MAH. Therapy aimed at inhibiting bone resorption (e.g., bisphosphonates) may therefore have a special effect in Myeloma, not only in reducing hypercalcemia but also in limiting tumor growth.


Therapeutic Considerations for MAH


Therapy of MAH should be directed primarily at treating the hypercalcemia, which may be of acute onset and considerable magnitude, and at treating the underlying tumor burden. Several approaches have been directed at reducing PTHrP production by those tumors in which PTHrP hypersecretion occurs. These include immunoneutralization (193), antisense inhibition, inhibition of growth factor stimulation through farnesyl transferase inhibition (77), inhibition of gene transcription with low calcemic vitamin D analogs (82), and convertase inhibition (84). To date these remain experimental but if PTHrP contributes to the local growth of the tumor, which some studies have reported, reduction of PTHrP levels may contribute not only to the long-term amelioration of skeletal and calcium homeostasis but also to a reduction in tumor burden.


INFLAMMATORY DISORDERS CAUSING HYPERCALCEMIA  


Granulomatous Disorders


Both infectious and non-infectious granuloma-forming disorders have been associated with 1,25(OH)2D-mediated hypercalcemia (231). Noninfectious disorders include sarcoidosis, silicone-induced granulomatosis, paraffin-induced granulomatosis, berylliosis, Wegener's granulomatosis, eosinophilic granuloma, NOD2 pediatric granulomatous arthritis, Crohn`s disease, Langerhan cell histiocytosis, and infantile fat necrosis. Infectious disorders include tuberculosis, candidiasis, cryptococcosis, leprosy, histoplasmosis, coccidiomycosis, and Bartonella Hensalae infection (cat-scratch disease). The disorder in which the hypercalcemia was first noted, is perhaps best documented, and has best been studied is sarcoidosis. Consequently, this will be discussed as a prototype of granulomatous diseases.


Up to 50% of patients with sarcoidosis will become hypercalciuric during the course of their disease and mild to severe hypercalcemia will be detected in 10% (232). Hypercalciuria and hypercalcemia generally occur in patients who have widespread disease and high serum angiotensin-converting enzyme activity. Normocalcemic patients with sarcoidosis are prone to the development of hypercalciuria and hypercalcemia after receiving small amounts of dietary vitamin D or after exposure to UV light (233). This is due to the fact the serum 1,25(OH)2D levels in active sarcoidosis are exquisitely sensitive to increases in the 25(OH)D substrate levels. This leads to inappropriately elevated serum 1,25(OH)2D concentrations and absorption of high fractions of dietary calcium (Fig. 7). PTH is suppressed and its calcium reabsorptive effect in the kidney is lost leading to hypercalciuria. However urinary calcium often exceeds dietary calcium intake suggesting a role for 1,25(OH)2D-mediated bone resorption as an alternate or additional source of filtered calcium and indeed accelerated trabecular bone loss and decreased bone mass has been documented in patients with active sarcoidosis (234,235). The source of the inappropriate 1,25(OH)2D is believed to be an extra-renal 1a(OH)ase (as in malignant lymphoproliferative disease) produced by macrophages which are prominent components of the sarcoid granuloma (236). This enzyme exhibits similar kinetics and substrate specificity as the renal 1a(OH)ase but is clearly not regulated as is the renal 1a(OH)ase by PTH, 1,25(OH)2D, calcium, or phosphorus. This extra-renal 1a(OH)ase does however appear to be suppressible by glucocorticoids (237), chloroquine (238) analogs, and cytochrome P-450 inhibitors such as ketoconazole (239).

Figure 7. Disordered calcium homeostasis in granulomatous disease. Production of an extra-renal 1α(OH)ase by macrophages in a granuloma can increase conversion of circulating 25(OH)D to 1,25(OH)2D. This secosteroid will increase Ca+2 absorption from the gut and Ca+2 resorption from bone resulting in an increased ECF Ca+2. The increased ECF Ca+2 and 1,25(OH)2D will inhibit PTH production by the parathyroid glands. The increased filtered load of Ca+2 through the kidney and suppressed PTH will contribute to hypercalciuria.

Therapy of hypercalcemia associated with granulomatous disease is therefore aimed at reducing dietary intake of calcium and vitamin D, limiting sunlight exposure, and treating the underlying disease. Glucocorticoid therapy, if not already indicated for treating the underlying disease, or chloroquine analogs or ketoconazole should be considered to specifically decrease 1,25(OH)2D concentrations.


Viral Syndromes: Autoimmune Deficiency Syndrome:  HIV and CMV Infections


A number of mechanisms may contribute to causing hypercalcemia in people living with AIDS however direct skeletal resorption has been described due to human immunodeficiency virus (HIV), HTLV-III, or cytomegalovirus (CMV) infections of the skeleton (240). Use of foscarnet as an antiviral agent has also been associated with hypercalcemia (241).


PEDIATRIC SYNDROMES  


Williams Syndrome


Williams Syndrome (William-Beuren Syndrome) is a sporadic disorder characterized by dysmorphic features including “elfin facies”, cardiac abnormalities, the most typical of which is supravalvular aortic stenosis, neurologic deficits, musculoskeletal abnormalities, and hypercalcemia (242). Hypercalcemia occurs in about 15% of cases and may be associated with increased sensitivity to vitamin D (243). Williams Syndrome has been associated with loss of genetic material at 7qll.23 which likely represents a continuous gene deletion that includes the elastin gene (ELN) and LIM-KINASE gene (244). The hypercalcemia typically occurs during infancy and resolves between 2 and 4 years of age. The pathophysiology is not well understood. but both abnormal 1,25(OH)2D metabolism and decreased calcitonin production have been suggested (245).


Idiopathic Infantile Hypercalcemia


Idiopathic Infantile Hypercalcemia is a disorder in which patients lack phenotypic features of Williams Syndrome and do not have a 7q11.13 deletion. However, they also manifest hypercalcemia in infancy which is associated with apparent vitamin D sensitivity and which resolves in the first few years of life (246). Loss-of-function mutations in CYP 24A1, the gene encoding the 24-hydroxylase may occur. Consequently, inactivation of the active form of vitamin D, 1,25(OH)2D is impaired. This results in increased 1,25(OH)2D levels and enhanced calcium absorption and hypercalcemia (247). Loss-of-function mutations of SLC34A1, encoding the renal proximal tubular sodium-phosphate cotransporter, Na/Pi-IIa result in phosphaturia, hypophosphatemia, increased FGF23, stimulation of CYP27B1 and inhibition of CYP24A1, causing increased 1,25(OH)2D and hypercalcemia hypercalciuria, and nephrocalcinosis which may also manifest as IIH


Hypophosphatasia


Hypophosphatasia (HPP) is characterized by loss of function mutations in the gene ALPL (chromosome 1) encoding the tissue nonspecific alkaline phosphatase (TNSALP) (248). Hypercalcemia is generally present mainly in the infantile form of the disease, where the hypercalcemia appears to result from reduced deposition of calcium in bone matrix. Hypercalcemia may resolve spontaneously within the first year of life or following targeted asfotase alfa enzyme replacement.  Hypercalcemia may also occur in adults with HPP who have been immobilized


Congenital Lactase Deficiency


Congenital lactase deficiency CLD, is an autosomal recessive disorder (73–76) caused by a mutation of the lactase-phlorizin hydrolase gene, Infants with CLD may develop increased calcium absorption in the ileum in the presence of nonhydrolyzed lactose, and hypercalcemia and medullary nephrocalcinosis may ensue. The hypercalcemia generally resolves quickly after a lactose-free diet is initiated but nephrocalcinosis may persist (249).

.

Congenital Sucrase-Isomaltase Deficiency


Hypercalcemia may possibly occur due to increased bone mobilization of calcium secondary to chronic metabolic acidosis. There may also be roles for dehydration, along with potential increase calcium absorption (250).


MEDICATION-INDUCED HYPERCALCEMIA


Thiazide Diuretics


Thiazides reduce renal calcium clearance, however in the presence of a normal calcium homeostatic system (e.g., in the absence of primary hyperparathyroidism) this should not produce sustained hypercalcemia (251). Thiazides have however been reported to produce hypercalcemia in anephric individuals. Overall, therefore the mechanism is unknown although "unmasking" of mild underlying primary hyperparathyroidism has been suggested as a possible mechanism. Hypercalcemia is however a rare event in thiazide use and is rapidly reversed by discontinuing the medication.


Lithium


Lithium carbonate, at 900 to 1500 mg/day, has occasionally (5% of cases) been reported to cause hypercalcemia. Lithium may reduce renal calcium clearance and may also alter the set-point for PTH secretion such that higher ECF calcium levels than normal are required to suppress PTH (252). The hypercalcemia is generally reversible with discontinuation of therapy.


Vitamin D and Analogues


Excessive intake of vitamin D per se, of dihydrotachysterol, of 25(OH)D3, or of 1,25(OH)2D3 can all cause hypercalciuria and hypercalcemia by increasing gut absorption of calcium and bone resorption (253). Only vitamin D, (vitamin D2 or vitamin D3) is available without prescription. Vitamin D per se, is more lipid soluble and has a much longer retention time in the body (weeks to months) than the hydroxylated analogues (hours to days). Therapy consists of hydration, calciuresis, and if needed glucocorticoids and an anti-resorptive agent (bisphosphonate or denosumab).


Vitamin A and Analogues


Vitamin A, in greater than 50,000 IU/day, and its analogues cis-retinoic acid and all-trans-retinoic acid (used for the treatment of dermatologic and neoplastic disorders) have been associated with hypercalcemia (254-256). This appears to be due to enhanced bone resorption. Discontinuation of the medication, hydration and administration of an anti-resorptive agent would appear to be the treatments of choice.


Antiestrogens (Tamoxifen)


Hypercalcemia may occur when antiestrogens (257) such as tamoxifen are used to treat breast cancer metastatic to the skeleton. Increased bone resorption associated with osteolytic lesions appears to be the major mechanism possibly induced by cytokines and growth factors released when the tumor undergoes lysis. The “flare” hypercalcemia may require acute treatment but is usually self-limiting (258,259).


Theophylline/Aminophylline


Hypercalcemia has been reported with theophylline usage for chronic obstructive pulmonary disease or asthma and appears reversible with cessation of therapy or amenable to treatment with beta – adrenergic antagonists (260).


Aluminum Intoxication


Aluminum intoxication was observed when large amounts of aluminum-containing phosphate-binding agents were prescribed to patients with chronic renal failure to control hyperphosphatemia. Alternatively, clustered outbreaks of aluminum intoxication occurred when inadequately purified water was employed for dialysis or for total parenteral nutrition (261). Aluminum intoxication can cause adynamic bone disease in patients with renal failure, and hypercalcemia possibly due to inadequate deposition of calcium in bone. In chronic kidney disease, removal of aluminum by treating with the chelating agent desferioxamine is effective in reducing serum calcium levels and improving mineralization. Less frequent use of aluminum-containing medications has considerably diminished the frequency of this disorder.


Milk-Alkali Syndrome


The classic milk-alkali syndrome causing hypercalcemia occurred in the past when large quantities of milk and bicarbonate were ingested together to treat peptic ulcers. The modern-day equivalent appears to be consumption of large quantities of milk or other dairy products with calcium carbonate (262). Quantities of calcium that must be ingested to cause the syndrome are at least 3 g per day or more. Classically hypercalcemia is accompanied by alkalosis, nephrocalcinosis, and ultimately by renal failure. The alkali may enhance precipitation of calcium in renal tissue. Discontinuation of the calcium and antacid, rehydration and rarely, hemodialysis, can be useful for treatment.


SGLT2 Inhibitors


Case reports have documented reversible hypercalcemia with sodium-glucose cotransporter protein 2 inhibitors, likely due to osmotic diuresis and volume contraction. Underlying risk factors

(dehydration, high calcium intake, thiazides, acidosis, undiagnosed PHPT) were typically present.


Immune Checkpoint Inhibitors


Hypercalcemia has been reported infrequently with immune checkpoint inhibitors (ICIs). Mechanisms may include ICI-induced endocrine disorders (hyperthyroidism, adrenal insufficiency), sarcoid-like granuloma formation, ICI-related PTHrP production, or transient ICI-related “hyperprogression” of disease.


Denosumab


Hypercalcemia may occur after denosumab discontinuation due to “rebound” osteoclastic bone resorption. Most cases involve children younger than 18 years and those using denosumab for bone tumors and fibrous dysplasia. A few cases have been reported in adults treated for osteoporosis.


Teriparatide, Abaloparatide


Transient hypercalcemia can occur during teriparatide [PTH (1-34)] treatment for osteoporosis, and usually resolves within about 16 h after administration. Abaloparatide, a synthetic analog of human PTHrP (1-34), also used as osteoporosis therapy, exhibits lesser hypercalcemic effects than PTH (1-34) because of faster dissociation of the PTHrP-PTHR1 agonist-receptor complex, than of the PTH-PTHR1 complex.


Foscarnet


Foscarnet is an antiviral medication, commonly used in the treatment and CMV infections. There have been rare reports of hypercalcemia in recipients.


Ketogenic Diet


A small number of children with epilepsy who were following a ketogenic diet have been reported to develop hypercalcemia. The mechanism, while not fully delineated, may be due to impaired osteoblast activity and deceased bone formation.


ALTERATIONS IN MUSCLE AND BONE


Immobilization


Immobilized patients, in association with reduced mechanical load on the skeleton, continue to resorb bone whereas bone formation is inhibited. Thus, high bone resorption with negative calcium balance leading to osteopenia, osteoporosis, and hypercalcemia may occur from prolonged immobilization after burns, spinal injury, major stroke, hip fracture, and bariatric surgery (263). More severe hypercalcemia and hypercalciuria may occur in immobilized individuals with already high bone turnover such as growing children, patients with Paget’s Disease, or patients with primary hyperparathyroidism or MAH (264).


Intense Exercise


Hypercalcemia has been described in some individuals after hours of intense exercise; bone resorption markers increased and correlated with elevations in serum calcium and vasopressin levels.


Rhabdomyolysis


In the oliguric early phase of rhabdomyolysis (the rapid breakdown of damaged skeletal muscle), calcium and phosphate complex deposition in muscle may occur; in the later polyuric phase, the calcium and phosphate complexes in muscle may be mobilized, and redistributed, causing hypercalcemia.


CLINICAL ASSESSMENT OF THE HYPERCALCEMIC PATIENT


This discussion of the clinical assessment of the hypercalcemic patient will focus primarily on adult patients. Although many of the approaches are relevant to childhood and even neonates, detailed discussion of the issues relevant exclusively to the pediatric age group is beyond the scope of this chapter.


History and Physical Examination


The approach to the history and physical examination of the hypercalcemic patient should focus on the signs and symptoms which are relevant to hypercalcemia, and the signs and symptoms which are relevant to the causal disorder. Both duration and severity of symptoms should be ascertained.


Hypercalcemic manifestations will vary depending on whether the hypercalcemia is of acute onset and severe (greater than 12 mg/dL or 3 mM) or whether it is chronic and relatively mild (Table 2). Patients may also tolerate higher serum calcium levels more readily if the onset is relatively gradual, but at concentrations above 14 mg/dL (3.5 mM) most patients are symptomatic. In both acute and chronic cases, the major manifestations affect gastrointestinal, renal, and neuromuscular function. Patients with acute hypercalcemia commonly present with anorexia, nausea, vomiting, polyuria, polydipsia, dehydration, weakness, and depression and confusion which may proceed to stupor and coma. As well the QT interval on EKG may be shortened by hypercalcemia due to the increased rate of cardiac repolarization. Arrhythmias such as bradycardia and first-degree atrioventricular block, as well as digitalis sensitivity may occur. Acute hypercalcemia, therefore, can represent a life-threatening medical emergency. Patients with chronic hypercalcemia may have a history of constipation, dyspepsia (generally not due to a true ulcer), pancreatitis, and nephrolithiasis but few other signs or symptoms.


Table 2. Manifestations of Hypercalcemia


Acute

Chronic

Gastrointestinal


Anorexia, nausea, vomiting


Dyspepsia, constipation, pancreatitis

Renal


Polyuria, polydipsia, dehydration,

renal insufficiency


Nephrolithiasis, nephrocalcinosis, renal insufficiency

Neuro-muscular


Depression, confusion, hyporeflexia, stupor, coma

Weakness, lethargy


Cardiac


Prolonged PR interval, short QT interval, widened QRS complex,

bradycardia, digitalis sensitivity

Hypertension


The most frequent underlying causes (over 90%) of hypercalcemia are primary sporadic hyperparathyroidism and malignancy-associated hypercalcemia (MAH). In the West, the most frequent presentation of primary sporadic hyperparathyroidism is that of relatively "asymptomatic" disease with only intermittently or mildly (<12 mg/dL or 3 mM) elevated serum calcium concentrations (140). Occasionally a history is obtained of having passed a kidney stone either recently or in the remote past. Neck masses are unusual in primary hyperparathyroidism unless the patient has a particularly large adenoma or a parathyroid carcinoma. In contrast, the most frequent presentation of MAH is of acute, severe hypercalcemia with some or all of the manifestations of this mineral ion abnormality that are noted above. In view of the fact that hypercalcemia is generally a manifestation of advanced disease, tumors causing hypercalcemia are rarely occult. Consequently, evidence for an underlying malignancy may be obtained or suspected on history or physical examination. Endocrine disorders such as hyperthyroidism or hypoadrenalism should be suspected from a careful history and physical examination, and a history of ingestion of medication and supplements (e.g., calcium, vitamin D, thiazide diuretics, and vitamin A) which have been reported to cause hypercalcemia should be obtained. The presence of chronic granulomatous disease could be suspected on the basis of an accurate history and physical examination targeted to the known granulomatous diseases that cause hypercalcemia. Finally, a careful family history should provide clues as to whether the patient manifests any of the variants of familial hyperparathyroidism.


Laboratory Examination


Laboratory testing should be guided by the results of a careful history and a detailed physical examination and should be geared toward assessing the extent of the alteration in calcium homeostasis and toward establishing the underlying diagnosis and determining its severity. Useful laboratory screening may include a complete blood count (CBC), serum total and ionized calcium, PTH, 25(OH)D, 1,25(OH)2D, phosphorus, serum creatinine and calculation of estimated glomerular filtration rate (GFR), urinalysis and 24-hour urine collection for calcium and creatinine.


To establish the diagnosis of PHPT the most common cause of hypercalcemia in the ambulatory setting, documentation of at least two elevated corrected (or ionized) serum calcium levels with concomitant elevated, or at least normal, serum PTH levels, at least 2 weeks apart, is required (levels of PTH within the normal range are “inappropriate” and consistent with PHPT, because serum PTH should be suppressed in the setting of hypercalcemia,) (Figure1). A serum PTH level is the most useful initial test to distinguish between PTH-dependent and PTH-independent hypercalcemia. Two site assays for PTH are currently the method of choice (265), and the sensitivity of second-generation intact and third-generation “whole” PTH 2-site immunometric assays is similar and is approximately 90%. PTH levels are elevated in approximately 80% of patients, although temporal trends suggest lower levels compared with past decades. Normocalcemic PHPT may be diagnosed if normal corrected total calcium and normal ionized calcium concentrations occur in association with an elevated intact serum PTH on at least two occasions over 3–6 months, and all causes of secondary hyperparathyroidism have been excluded.


FHH, should also be considered in the presence of hypercalcemia and normal or elevated PTH however FHH patients generally exhibit a urinary calcium /creatinine clearance ratio <0.01 if testing serum and urine calcium in three relatives discloses hypercalcemia and relative hypocalciuria, then this diagnosis is likely and parathyroid surgery is to be avoided. Lithium and thiazide diuretics may also be associated with hypercalcemia and elevated PTH, as may ectopic PTH secretion by tumors,


To evaluate renal involvement, estimated glomerular filtration rate (eGFR) or preferably, creatinine clearance, 24-hour urinary calcium and imaging for nephrolithiasis/nephrocalcinosis should be obtained. To evaluate skeletal involvement, bone mineral density (BMD) should be determined by dual-energy X-ray absorptiometry (DXA) scans of the lumbar spine, hip, and distal 1/3 radius, and imaging should be performed for vertebral fractures (vertebral fracture assessment [VFA] or vertebral X-rays); trabecular bone score (TBS) could be included if available. These studies should provide a baseline of disease extent before parathyroidectomy. Pre-operative localization of a parathyroid adenoma, generally by nuclear imaging (MIBI scans) or ultrasound has been helpful (266). Ultimately an experienced surgeon is the best guarantee for a successful neck exploration.


The presence of a family history of hypercalcemia or of kidney stones should raise suspicion of MEN1 or MEN2a or MEN4. If, in addition to HPT in the proband, one or more first-degree relatives are found have at least one of the three tumors characterizing MEN1 (parathyroid, pituitary, pancreas) or MEN2a (parathyroid, medullary thyroid carcinoma, pheochromocytoma) then it is highly likely that the disease is familial. Documentation of familial HPT should be transmitted to the surgeon so that multigland disease can be dealt with. The presence of ossifying fibromas of the mandible and maxilla, and renal lesions such as cysts and hamartomas in addition to HPT would suggest HPT-jaw tumor syndrome.


If hypercalcemia is associated with very low or suppressed serum PTH levels, then malignancy would be an important consideration, either in association with elevated serum PTHrP or in its absence, in which case it is generally as a result of the production of other cytokines. Hypercalcemia is however frequently a late manifestation of malignancy and the presentation of hypercalcemia is often acute and severe. When malignancy-associated hypercalcemia is suspected then an appropriate malignancy screen should be done including skeletal imaging to identify skeletal metastases. As well appropriate biochemical assessment such as a complete blood count, serum creatinine, and serum and urine protein electrophoresis to exclude multiple myeloma would be appropriate. Detection of elevated serum 1,25(OH)2D levels may point toward the need for a search for lymphoma or for infectious or non-infectious granulomatous disease. Other testing (e.g., a TSH level) could be done for specific clinical disorders based on the findings on the history and physical examination. Although increased PTHrP may be associated with pheochromocytoma, serum PTH levels are suppressed in hypercalcemia in association with thyrotoxicosis, pheochromocytoma, VIPoma, and hypoadrenalism. Although these disorders may be suspected from clinical examination, detailed biochemical evaluation is required for confirmation.


An approach to laboratory assessment of the hypercalcemic patient is shown in Figure 8.

Figure 8. Laboratory approach to the diagnosis of hypercalcemia. Abbreviations used are: BMD= bone mineral density, eGFR=estimated glomerular filtration rate,Li=lithium therapy MAH=malignancy-associated hypercalcemia, PHPT=primary hyperparathyroidism, SPEP=serum protein electrophoresis, UPEP=urine protein electrophoresis.

MANAGEMENT OF HYPERCALCEMIA


If the patient is asymptomatic and the patient's serum calcium concentration is less than 12 mg/dL (3 mM) then treatment of the hypercalcemia should be aimed solely at treatment of the underlying disorder. Nevertheless, calcium intake of greater than 1000 mg/d, and immobilization should be avoided. If feasible, thiazide diuretics should be discontinued.

If the patient has symptoms and signs of acute hypercalcemia as described above and serum calcium is greater than 12 mg/dL (3mM) then a series of urgent measures should be instituted (Table 3). These measures are almost always required with a serum calcium above 14 mg/dL (3.5 mM)


Table 3. Management of Acute Hypercalcemia

1. Hydration

2. Inhibition of Bone Resorption

3. Calciuresis

4. Reduction of GI calcium absorption

5. Calcimimetics

6. Dialysis

7. Mobilization


Hydration to Restore Euvolemia


Hydration with normal saline is necessary in every patient with acute, severe hypercalcemia to correct the ECF deficit due to nausea, vomiting, and polyuria (267). This may require a bolus infusion of 0.9% sodium chloride followed by an infusion of 3 to 4 L over 24 to 48 hours (e.g., an initial rate of 200-300 mL/h subsequently adjusted to maintain a urine output at 100-150 mL/h). Hydration can enhance urinary calcium excretion by increasing the glomerular filtration of calcium and decreasing tubular reabsorption of sodium and calcium. This form of therapy, although always required, should however be used cautiously in patients with compromised cardiovascular or renal function. Hydration alone might be sufficient when the cause is known and readily reversible (e.g., milk-alkali syndrome), but is typically insufficient with other etiologies such as MAH.


Inhibition of Bone Resorption


Accelerated bone resorption is an important factor in the pathogenesis of hypercalcemia in the majority of patients with acute, severe hypercalcemia and treatment with denosumab (Dmab) or an intravenous (IV) bisphosphonate (BP) is the treatment of choice for inhibition of bone resorption (268). Consequently, preferably after the patient is rehydrated, denosumab 120 mg can be given subcutaneously and, if needed, repeated 1, 2 and 4 weeks later and monthly thereafter, to maintain the desired calcium level. In contrast to bisphosphonates, denosumab is not cleared by the kidney, and therefore can be used in patients with severe or chronic kidney disease. Denosumab may, rarely, cause rash or infection, Transient hypocalcemia, may occur particularly in patients with vitamin D deficiency; consequently, low serum 25(OH)D, if present, should be corrected before administering denosumab. Alternatively, nitrogen-containing bisphosphonates may be administered intravenously (IV). Thus, zoledronic acid, 4 mg, can be given Ivin 5 ml of 0.9% saline or 5% dextrose in water over 15 min (269) and can be repeated in 7 days, if necessary and every 3 to 4 weeks thereafter; alternatively pamidronate, 60-90 mg, may be administered IV in 500 ml of 0.9% saline or 5% dextrose in water over 2-4 hours (270). Bisphosphonates may cause transient fevers, flu-like symptoms, or myalgias for a day or two and transient hypocalcemia and/or hypophosphatemia may result. After a single dose both agents may only reduce serum calcium to normal levels after 4 days but the duration of the effect may last from days to 8 weeks. Salmon calcitonin is a peptide hormone which is a safe therapeutic agent when acutely administered. Calcitonin can inhibit osteoclastic resorption and can also increase calcium excretion (271). It has a more rapid onset of action than either denosumab or the intravenous bisphosphonates, causing serum calcium to fall generally by 1-2 mg/dL (0.25 to 0.50 mM) within 2 to 6 hours of administration. Consequently, it may be used in concert with a bisphosphonate or denosumab to more rapidly reduce the hypercalcemia (within 2-6 hours) (272). It is usually given intramuscularly or subcutaneously at a dose of 4 to 8 IU/kg, and can be repeated every 6 to 12 hours for 48 to 72 hours. Unfortunately, this agent is not as potent as the most potent bisphosphonates or denosumab and tachyphylaxis may occur after 48-72 hours.


Calciuresis


If PTHrP or PTH is suspected to be a pathogenetic mediator of the presenting hypercalcemia then renal calcium retention may contribute to the maintenance of the hypercalcemia and inhibition of bone resorption alone may be insufficient to normalize serum calcium (273). In this case, a loop diuretic i.e., furosemide may be added, but, importantly, only after rehydration. Loop diuretics inhibit both sodium and calcium reabsorption at the CTAL of the kidney. Furosemide, 20 to 40 mg may be administered IV both to control clinical manifestations of volume excess and to promote calciuria, but the possibility of low potassium, or worsening kidney function should be monitored.


Glucocorticoids   


Glucocorticoids decrease gastrointestinal absorption of calcium and can also increase urine calcium excretion. Importantly, glucocorticoids can also inhibit ,25(OH)2D synthesis by mononuclear cells in patients with granulomatous diseases (237) and by proliferative cells in hematologic malignancies such as lymphoma or myeloma (274). Glucocorticoids (e.g., hydrocortisone 200 to 400 mg intravenously over 24 hours for 3 to 5 days) may therefore be an initial adjunctive therapy for treatment of severe hypercalcemia in those with known or highly suspected vitamin D–mediated hypercalcemia, but may also be used as an additional therapy in refractory life-threatening hypercalcemia of any cause. Once the acute hypercalcemia is controlled and the cause identified, treatment can be tailored to the pathophysiological mechanism, e.g., by the use of oral prednisone 20 mg/d to 40 mg/d or higher, if necessary, Chronic glucocorticoid use may however result in hyperglycemia, altered mental status, hypertension. myopathy, infection, bone loss and/or avascular necrosis of bone.


Ketoconazole   


Ketoconazole, is an imidazole antifungal agent, that inhibits 1,25(OH)2D production in sarcoidosis, tuberculosis, silicone-related granulomatous disease, and in individuals with inactivating CYP24A1 variants (79-82). Ketoconazole may be used instead of glucocorticoids or used in combination with lower doses of glucocorticoids in hypercalcemia associated with these disorders.


Patients with disorders causing increased calcium absorption should also decrease dietary calcium and vitamin D intake, maintain hydration and avoid exposure to sun, in view of the fact that seasonal increases in serum calcium have been described in patients with sarcoid and CYP24A1 variants.


CaSR Agonism (Calcimimetics)


The calcimimetic, cinacalcet, is a CaSR agonist which increases CaSR sensitivity to ECF calcium and reduces PTH secretion. It may be used in doses starting at 30 mg twice daily orally to as high as 90 mg 4 times daily for the treatment of severe, chronic hypercalcemia due to primary HPT, especially if caused by a parathyroid carcinoma, and if the patient is not a surgical candidate (275), Bisphosphonates or denosumab can be used in combination with cinacalcet, if necessary to lower the serum calcium and to increase BMD in these conditions.


Dialysis


Dialysis is usually reserved for severely hypercalcemic patient’s refractory to other therapies or who have renal insufficiency.  Both peritoneal dialysis (276) and hemodialysis (277) can be effective in removing ionized calcium from the extracellular fluid, over the course of hours.


Mobilization


Finally, the patient should be mobilized as rapidly as possible (278). If mobilization is not possible then continued treatment with antiresorptive agents may be necessary (279).

Once the acute episode of hypercalcemia has been managed, careful attention must be paid to addressing the underlying hypercalcemic disorder per se.


REFERENCES


  1. Walser M. Ion association: VI. Interactions between calcium, magnesium, inorganic phosphate, citrate, and protein in normal human plasma. J. Clin. Invest. 1961;40:723-730.
  2. Parfitt AM, Kleerekoper M. Clinical disorders of calcium, phosphorus and magnesium metabolism. in Maxwell MH, Kleeman CR. (eds): Clinical disorders of fluid and electrolyte metabolism, 3rd ed. New York, McGraw-Hill, 1980, pp 947-1153.
  3. Stewart AF, Broadus AE: Mineral metabolism. in Felig P, Baxter ID, Broadus AE, Frohman LA. (eds): Endocrinology and metabolism, 2nd ed. New York, McGraw-Hill, 1987, pp 1317-1453.
  4. Bringhurst FR, Demay MB, Kronenberg HM. Hormones and disorders of mineral metabolism., in Wilson JD, Foster DW, Kronenberg HM, Larsen PR. (eds): Williams textbook of endocrinology, 9th ed. Philadelphia, Saunders, 1998, pp 1155-1200.
  5. Brown EM: Physiology of calcium homeostasis., in Bilezikian JP, Marcus R, Levine MA. (eds): The parathyroids: basic and clinical concepts, 2nd ed. San Diego, Academic Press, 2001, pp 167-181.
  6. Brown EM, Gamba G, Riccardi D, Lombardi M, Butters R, Kifor O, Sun A, Hediger MA, Lytton J, Hebert SC. Cloning and characterization of an extracellular Ca(2+)-sensing receptor from bovine parathyroid. Nature 1993;366:575-580.
  7. Fraser DR, Kodicek E. Regulation of 25-hydroxycholecalciferol-1-hydroxylase activity in kidney by parathyroid hormone. Nat. New. Biol. 1973;241:163-166.
  8. Potts JT Jr, Jueppner H. Parathyroid hormone and parathyroid hormone-related peptide in calcium homeostasis, bone metabolism, and bone development: the proteins, their genes, and receptors., in Avioli LV, Krane SM. (eds): Metabolic bone disease, 3rd ed. New York, Academic Press, 1997, pp 51-84.
  9. Grant FD, Conlin PR, Brown EM. Rate and concentration dependence of parathyroid hormone dynamics during stepwise changes in serum ionized calcium in normal humans. J. Clin. Endocrinol. Metab. 1990;71:370-378.
  10. Mayer GP, Keaton JA, Hurst JG, Habener JF. Effects of plasma calcium concentration on the relative proportion of hormone and carboxyl fragments in parathyroid venous blood. Endocrinology 1979;104:1778-1784.
  11. Hanley DA, Ayer LM. Calcium-dependent release of carboxyl-terminal fragments of parathyroid hormone by hyperplastic human parathyroid tissue in vitro. J. Clin. Endocrinol. Metab. 1986;63:1075-1079.
  12. D'Amour P, Palardy J, Bahsali G, Mallette LE, DeLéan A, Lepage R. The modulation of circulating parathyroid hormone immunoheterogeneity in man by ionized calcium concentration. J. Clin. Endocrinol. Metab. 1992;74:525-532.
  13. Segre GV, D'Amour P, Hultman A, Potts JT Jr. Effects of hepatectomy, nephrectomy, and nephrectomy/uremia on the metabolism of parathyroid hormone in the rat. J. Clin. Invest. 1981;67:439-448.
  14. Yamamoto M, Igarishi T, Muramatsu M, Fukagawa M, Motokura T, Ogata E. Hypocalcemia increases and hypercalcemia decreases the steady state level of parathyroid hormone messenger RNA in the rat. J. Clin. Invest. 1989;83:1053-1056.
  15. Naveh-Many T, Silver J. Regulation of parathyroid hormone gene expression by hypocalcemia, hypercalcemia, and vitamin D in the rat. J. Clin. Invest. 1990;86:1313-1319.
  16. Kremer R, Bolivar I, Goltzman D, Hendy GN. Influence of calcium and 1,25-dihydroxycholecalciferol on proliferation and proto-oncogene expression in primary cultures of bovine parathyroid cells. Endocrinology 1989;125:935-941.
  17. Xu M, Choudhary S, Goltzman D, Ledgard F, Adams D, Gronowicz G, Koczon-Jaremko B, Raisz L, Pilbeam C. Do cycloxygenase-2 knockout mice have primary hyperparathyroidism? Endocrinology 2005;146:1843-1853.
  18. Dusso A, Cozzolino M, Lu Y, Sato T, Slatopolsky E. 1,25-Dihydroxyvitamin D downregulation of TGF alpha/EGFR expression and growth signaling: a mechanism for the antiproliferative actions of the sterol in parathyroid hyperplasia of renal failure. J. Steroid Biochem Mol. Biol. 2004;89-90;507-511.
  19. Ben-Dov IZ, Galitzer H, Lavi-Moshayoff V, Goetz R, Kuro-o M, Mohammadi M, Sirkis R, Naveh-Many T, Silver J. The parathyroid is a target organ for FGF23 in rats. J Clin Invest. 2007;117:4003-4008.
  20. Chan YL, McKay C, Dye E, Slatopolsky E. The effect of 1,25 dihydroxycholecalciferol on parathyroid hormone secretion by monolayer cultures of bovine parathyroid cells. Calcif. Tiss. Int. 1986;38:27-32.
  21. Goltzman D, Miao D, Panda DK, Hendy GN. Effects of calcium and of the vitamin D system on skeletal and calcium homeostasis: lessons from genetic models. J. Steroid Biochem. Mol. Biol. 2004;89-90:485-489.
  22. Friedman PA, Gesek FA. Cellular calcium transport in renal epithelia: Measurement, mechanisms, and regulation. Physiol. Rev. 1995;75:429-471.
  23. Nordin BE, Peacock M. Role of kidney in regulation of plasma-calcium. Lancet 1969;2:1280-1283.
  24. Rouse D, Suki WN. Renal control of extracellular calcium. Kidney Int. 1995;38:700-708.
  25. Rouleau MF, Warshawsky H, Goltzman D. Parathyroid hormone binding in vivo to renal, hepatic, and skeletal tissues of the rat using a radioautographic approach. Endocrinology 1986;118:919-931.
  26. Juppner H, Abou-Samra AB, Freeman MW, Kong SF, Schipani E, Richards J, Kolakowski LF Jr., Hock J, Potts JT Jr., Kronenberg HM, Segre GV. A G protein-linked receptor for parathyroid hormone and parathyroid hormone-related peptide. Science 1991;254:1024-1026.
  27. Abou-Samra AB, Jüppner H, Force T, Freeman MW, Kong XF, Schipani E, Urena P, Richards J, Bonventre JV, Potts JT Jr. Expression cloning of a common receptor for parathyroid hormone and parathyroid hormone-related peptide from rat osteoblast-like cells: a single receptor stimulates intracellular accumulation of both cAMP and inositol triphosphates and increases intracellular free calcium. Proc. Natl. Acad. Sci.USA 1992;89:2732-2736.
  28. Amizuka N, Lee HS, Kwan MY, Arazani A, Warshawsky H, Hendy GN, Ozawa H, White JH, Goltzman D. Cell-specific expression of the parathyroid hormone (PTH)/PTH-related peptide receptor gene in kidney from kidney-specific and ubiquitous promoters. Endocrinology 1997;138:469-481.
  29. Keusch I, Traebert M, Lotscher M, Kaissling B, Murer H, Biber J. Parathyroid hormone and dietary phosphate provoke a lysosomal routing of the proximal tubular Na/Pi-cotransporter type II. Kidney Int. 1998;54:1224-1232.
  30. Brenza HL, Kimmel-Jehan C, Jehan F, Shinki T, Wakino S, Anazawa H, Suda T, DeLuca HF. Parathyroid hormone activation of the 25-hydroxyvitamin D3-1a-hydroxylase gene promoter. Proc. Natl. Acad. Sci. USA 1998;95:1387-1391.
  31. Azarani A, Goltzman D, Orlowski J. Parathyroid hormone and parathyroid hormone-related peptide inhibit the apical Na+/H+ exchanger NHE-3 isoform in renal cells (OK) via a dual signaling cascade involving protein kinase A and C. J. Biol. Chem. 1995;270:20004-20010.
  32. Derrickson BH, Mandel LJ. Parathyroid hormone inhibits Na(+)-K(+)-ATPase through Gq/G11 and the calcium-independent phospholipase A2. Am. J. Physiol. 1997;272:F781-F788.
  33. Morel F, Chabardes D, Imbert-Teboul M, Le Bouffant F, Hus-Citharel A, Montégut M. Multiple hormonal control of adenylate cyclase in distal segments of the rat kidney. Kidney Int. 1982;11:555-562.
  34. De Rouffignac C, Quamme GA. Renal magnesium handling and its hormonal control. Physiol. Rev. 1994;74:305-322.
  35. Hebert SC. Extracellular calcium-sensing receptor: Implications for calcium and magnesium handling in the kidney. Kidney Int. 1996;50:2129-2139.
  36. Hoenderop JGJ, Nilius B, Bindels RJM. Calcium absorption across epithelia. Physiol Rev. 2005;85:373-422..
  37. Amizuka N, Karaplis AC, Henderson HE, Warshawsky H, Lipman ML, Matsuki Y, Ejiri S, Tanaka M, Izumi N, Ozawa H, Goltzman D. Haploinsufficiency of parathyroid hormone-related peptide (PTHrP) results in abnormal postnatal bone development. Dev. Biol. 1996;175:166-176.
  38. Rouleau MF, Mitchell J, Goltzman D. In vivo distribution of parathyroid hormone receptors in bone: Evidence that a predominant osseous target cell is not the mature osteoblast. Endocrinology 1988;123:187-191.
  39. Bellido T, Saini V, Pajevic PD. Effects of PTH on osteocyte function. Bone. 2013;54(2):250-7.
  40. Lee SK, Lorenzo JA. Parathyroid hormone stimulates TRANCE and inhibits osteoprotegerin messenger ribonucleic acid expression in murine bone marrow cultures: Correlation with osteoclast-like cell formation. Endocrinology 1999;140:3552-3561.
  41. Takahashi N, Udagawa N, Takami M, Suda T. Cells of bone: osteoclast generation., in Bilezikian JP, Raisz LG, Rodan GA. (eds): Principles of bone biology, 2nd ed. San Diego, Academic Press, 2002, pp109-126.
  42. Miao D, He B, Karaplis AC, Goltzman D. Parathyroid hormone is essential for normal fetal bone formation. J. Clin. Invest. 2002;109:1173-1182.
  43. Goltzman D. Studies on the mechanisms of the skeletal anabolic action of endogenous and exogenous parathyroid hormone. Arch. Biochem. Biophys. 2008;473:218-224.
  44. Monzem S, Valkani D, Evans LAE, Chang YM, Pitsillides AA. Regional modular responses in different bone compartments to the anabolic effect of PTH (1-34) and axial loading in mice. Bone. 2023;170:116720
  45. McCarthy TL, Centrella M, Canalis E. Parathyroid hormone enhances the transcript and polypeptide levels of insulin-like growth factor I in osteoblast-enriched cultures from fetal rat bone. Endocrinology 1989;124:1247-1253.
  46. Jilka R, Weinstein R, Bellido T, Roberson P, Parfitt AM, Manolagas SC. Increased bone formation by prevention of osteoblast apoptosis with parathyroid hormone. J. Clin. Invest. 1999;104:439-446.
  47. Tam C, Heersche J, Murray T, Parsons JA. Parathyroid hormone stimulates the bone apposition rate independently of its resorptive action: differential effects of intermittent and continuous administration. Endocrinology 1982;110:506-512.
  48. Holick MF. Vitamin D: Photobiology, metabolism and clinical applications., in DeGroot L, et al (eds): Endocrinology. Philadelphia, Saunders, 1995, pp 990
  49. Bouillon R, Okamura WH, Norman AW. Structure-function relationships in the vitamin D endocrine system. Endo. Revs. 1995;16:200-257.
  50. Panda DK, Miao D, Tremblay ML, Sirois J, Farookhi R, Hendy GN, Goltzman D. Targeted ablation of the 25- hydroxyvitamin D 1a-hydroxylase enzyme: Evidence for skeletal, reproductive, and immune dysfunction. Proc. Natl. Acad. Sci. USA 2001;98:7498-7503.
  51. Nguyen-Yamamoto L, Karaplis AC, St-Arnaud R, Goltzman D. Fibroblast growth factor 23 regulation by systemic and local osteoblast-synthesized 1,25-dihydroxyvitamin D. J Am Soc Nephrol. 2017;8(2): 586-597.
  52. Hewison M, Zehnder D, Bland R, Stewart PM. 1alpha-hydroxylase and the action of vitamin D. J. Mol. Endocrinol. 2000;25(2):141-148.
  53. St-Arnaud R, Arabian A, Travers R, Barletta F, Raval-Pandya M, Chapin K, Depovere J, Mathieu C, Christakos S, Demay MB, Glorieux FH. Deficient mineralization of intramembranous bone in vitamin D-24-hydroxylase-ablated mice is due to elevated 1,25-dihydroxyvitamin D and not to the absence of 24, 25-dihydroxyvitamin D. Endocrinology 2000;141:2658- 2666.
  54. Jurutka PW, Whitfield GK, Hsieh JC, Thompson PD, Haussler CA, Haussler MR. olecular nature of the vitamin D receptor and its role in regulation of gene expression. Rev. Endocr. Metab. Disord. 2001;2(2):203-216.
  55. Favus MF. Intestinal absorption of calcium, magnesium and phosphorus., in Coe FL, Favus MJ. (eds): Disorders of bone and mineral metabolism. New York, Raven, 1992, pp 57
  56. Van de Graaf SFJ, Boullart I, Hoenderop JGJ, Bindels RJM. Regulation of the epithelial Ca2+ channels TRPV5 and TRPV6 by 1α,25-dihydroxy Vitamin D3 and dietary Ca2+. J. Steroid Biochem. Molec. Biol. 2004;89-90: 303-308.
  57. Panda DK, Miao D, Bolivar I, Li J, Huo R, Hendy GN, Goltzman D. Inactivation of the 25-dihydroxyvitamin D-1alpha-hydroxylase and vitamin D receptor demonstrates independent effects of calcium and vitamin D on skeletal and mineral homeostasis. J. Biol Chem. 2004;279:16754- 16766.
  58. Christakos S. Recent advances in our understanding of 1,25-dihydroxyvitamin D(3) regulation of intestinal calcium absorption. Arch. Biochem. Biophys. 2012;523(1):73-76.
  59. Christakos S, Li S, De La Cruz J, Shroyer NF, Criss ZK, Verzi MP, Fleet JC. Vitamin D and the intestine: Review and update. J Steroid Biochem Mol Biol. 2020;196:105501
  60. Li YC, Pirro, AE, Amling M, Delling G, Baron R, Bronson R, Demay MB. Targeted ablation of the vitamin D receptor: An animal model of vitamin D-dependent rickets type II with alopecia. Proc. Natl. Acad. Sci. USA. 1997;94:9831-9835.
  61. Carmeliet G, Dermauw V, Bouillon R. Vitamin D signaling in calcium and bone homeostasis: a delicate balance. Best Pract. Res. Clin. Endocrinol. Metab. 2015;29(4):621-631
  62. Xue Y, Karaplis AC, Hendy GN, Goltzman D, Miao D. Genetic models show that parathyroid hormone and 1,25-dihydroxyvitamin D3 play distinct and synergistic roles in postnatal mineral ion homeostasis and skeletal development. Hum. Mol. Genet. 2005;14:1515-1528.
  63. Stewart AF, Horst R, Deftos LJ, Cadman EC, Lang R, Broadus AE. Biochemical evaluation of patients with cancer-associated hypercalcemia: Evidence for humoral and non-humoral groups. N. Engl. J. Med. 1980;303:1377-1383.
  64. Yasuda T, Banville D, Hendy GN, Goltzman D.: Characterization of the human parathyroid hormone-like peptide gene. J. Biol. Chem. 1989;264:7720-7725.
  65. Mangin M, Ikeda K, Dreyer BE, Broadus AE. Isolation and characterization of the human parathyroid hormone-like peptide gene. Proc. Natl. Acad. Sci. USA. 1989;86:2408-2412.
  66. Rabbani SA, Mitchell J, Roy DR, Hendy GN, Goltzman D. Influence of the amino-terminus on in vitro and in vivo biological activity of synthetic parathyroid hormone and parathyroid hormone-like peptides of malignancy. Endocrinology 1988;123:2709-2716.
  67. Usdin TB, Hoare SR, Wang T, Mezey E, Kowalak JA. TIP39: a new neuropeptide and PTH2-receptor agonist from hypothalamus. Nat. Neurosci. 1999;2(11):941-943.
  68. Usdin TB, Gruber C, Bonner TI. Identification and functional expression of a receptor selectively recognizing parathyroid hormone, the PTH2 receptor. J. Biol. Chem. 1995;270:15455-15458.
  69. Keller D, Tsuda MC, Usdin TB, Dobolyi A. Behavioural actions of tuberoinfundibular peptide 39 (parathyroid hormone 2).J Neuroendocrinol. 2022;34(9):e13130
  70. Goltzman D, Hendy GN, Banville D. Parathyroid hormone-like peptide: Molecular characterization and biological properties. Trends Endocrinol. Metab. 1989;1:39-44.
  71. Rabbani SA, Haq M, Goltzman D. Biosynthesis and processing of endogenous parathyroid hormone-related peptide (PTHrP) by the rat Leydig cell tumor H-500. Biochemistry 1993;32:4931-4937.
  72. Plawner LL, Philbrick WM, Burtis WJ, Broadus AE, Stewart AF. Cell type-specific secretion of parathyroid hormone-related protein via the regulated versus the constitutive secretory pathway. J. Biol. Chem. 1995;270:14078-14084.
  73. Eto M, Akishita M, Ishikawa M, Kozaki K, Yoshizumi M, Hashimoto M, Ako J, Sugimoto N, Nagano K, Sudoh N, Toba K, Ouchi Y. Cytokine-induced expression of parathyroid hormone-related peptide in cultured human vascular endothelial cells. Biochem. Biophys. Res. Commun. 1998;249:339-343.
  74. Kremer R, Karaplis AC, Henderson JE, Gulliver W, Banville D, Hendy GN, Goltzman D. Regulation of parathyroid hormone-like peptide in cultured normal human keratinocytes. J. Clin. Invest. 1991;87:884-893.
  75. Sebag M, Henderson JE, Goltzman D, Kremer R. Regulation of parathyroid hormone-related peptide production in normal human mammary epithelial cells in vitro. Am. J. Physiol. 1994;267:723-730.
  76. Casey ML, Mike M, Erk A, MacDonald PC. Transforming growth factor-B1 stimulation of parathyroid hormone-related protein expression in human uterine cells in culture: mRNA levels and protein secretion. J. Clin. Endocrinol. Metab. 1992;74:950952.
  77. Aklilu F, Park M, Goltzman D, Rabbani SA: Induction of parathyroid hormone related peptide by the Ras oncogene: Role of Ras farnesylation inhibitors as potential therapeutic agents for hypercalcemia of malignancy. Cancer Res. 1997;57:4517-4522.
  78. Kremer R, Sebag M, Champigny C, Meerovitch K, Hendy GN, White J, Goltzman D. Identification and characterization of 1,25-dihydroxyvitamin D3-responsive repressor sequences in the rat parathyroid hormone-related peptide gene. J. Biol. Chem. 1996;271:16310-16316.
  79. Lu C, Ikeda K, Deftos LJ, Gazdar AF, Mangin M, Broadus AE. Glucocorticoid regulation of parathyroid hormone-related peptide gene transcription in a human neuroendocrine cell line. Mol. Endocrinol. 1989;3:2034-2040.
  80. Liu B, Goltzman D, Rabbani SA: Regulation of parathyroid hormone-related peptide production in vitro by the rat hypercalcemic Leydig cell tumor H-500. Endocrinology 1993;132:1658-1664.
  81. Haq M, Kremer R, Goltzman D, Rabbani SA. A vitamin D analogue (EB1089) inhibits parathyroid hormone-related peptide production and prevents the development of malignancy-associated hypercalcemia in vivo. J. Clin. Invest. 1993;91:2416-2422.
  82. El Abdaimi K, Papavasiliou V, Rabbani SA, Rhim JS, Goltzman D, Kremer R. Reversal of hypercalcemia with the vitamin D analog EB1089 in a human model of squamous cancer. Cancer Res. 1999;59:3325-3328.
  83. Liu B, Goltzman D, Rabbani SA. Processing of pro-PTHrP by the prohormone convertase, furin: Effect on biological activity. Am. J. Physiol. 1995;268:E832-E838.
  84. Liu B, Amizuka N, Goltzman D, Rabbani SA. Inhibition of processing of parathyroid hormone-related peptide by antisense furin: Effect in vitro and in vivo on rat Leydig (H-500) tumor cells. Int. J. Cancer 1995;63:276-281.
  85. Care AD, Abbas SL, Pickard DW, Barri M, Drinkhill M, Findlay JB, White IR, Caple IW. Stimulation of ovine placental transport of calcium and magnesium by mid-molecule fragments of human parathyroid hormone-related protein. Exp. Physiol. 71990;5:605-608.
  86. Fenton AJ, Kemp BE, Hammonds RG, Mitchelhill K, Moseley JM, Martin TJ, Nicholson GC. A potent inhibitor of osteoclastic bone resorption within a highly conserved pentapeptide region of PTHrP (107-111). Endocrinology 1991;129:3424-3426.
  87. Philbrick WM, Dreyer BE, Nakchbandi IA, Karaplis AC. Parathyroid hormone-related protein is required for tooth eruption. Proc. Natl. Acad. Sci. USA. 1998;95:11846-11851.
  88. Henderson JE, Amizuka H, Warshawsky H, Biasotto D, Lanske BM, Goltzman D, Karaplis AC. Nucleolar localization of parathyroid hormone-related peptide enhances survival of chondrocytes under conditions that promote apoptotic cell death. Mol. Cell. Biol. 1995;15:4064-4075.
  89. Lam MHC, House CM, Tiganis T, Mitchelhill KI, Sarcevic B, Cures A, Ramsay R, Kemp BE, Martin TJ, Gillespie MT. Phosphorylation of the cyclin-dependent kinases site (Thr85) of parathyroid hormone-related protein negatively regulates its nuclear localization. J. Biol. Chem. 1999;274:18559-18566.
  90. Aarts MM, Rix A, Guo J, Bringhurst R, Henderson JE. The nucleolar targeting signal (NTS) of parathyroid hormone-related protein mediates endocytosis and nuclear translocation. J. Bone Miner. Res. 1999;14:1493-1503.
  91. Meerovitch K, Wing W, Goltzman D. Proparathyroid hormone related protein is associated with the chaperone protein BiP and undergoes proteasome mediated degradation. J. Biol. Chem. 1998;273:21024-21030.
  92. Nguyen M, He B, Karaplis A. Nuclear forms of parathyroid hormone-related peptide are translated from non-AUG start sites downstream from the initiator methionine. Endocrinology 2001;142:694-703.
  93. Miao D, Su H, He B, Gao J, Xia Q, Zhu M, Gu Z, Goltzman D, Karaplis AC. Severe growth retardation and early lethality in mice lacking the nuclear localization sequence and C-terminus of PTH-related protein. Proc. Natl. Acad. Sci. U S A. 2008;105(51):20309-20314.
  94. Toribio RE, Brown HA, Novince CM, Marlow B, Hernon K, Lanigan LG, Hildreth BE 3rd, Werbeck JL, Shu ST, Lorch G, Carlton M, Foley J, Boyaka P, McCauley LK, Rosol TJ. The midregion, nuclear localization sequence, and C terminus of PTHrP regulate skeletal development, hematopoiesis, and survival in mice. FASEB J. 201024(6):1947-1957.
  95. Kovacs CS, Lanske B, Hunzelman JL, Guo J, Karaplis AC, Kronenberg HM. Parathyroid hormone-related peptide (PTHrP) regulates fetal-placental calcium transport through a receptor distinct from the PTH/PTHrP receptor. Proc. Natl. Acad. Sci. USA 1996;93:15233-15238.
  96. Takahashi K, Inoue D, Ando K, Matsumoto T, Ikeda K, Fujita T. Parathyroid hormone-related peptide as a locally produced vasorelaxant regulation of its mRNA by hypertension in rats. Biochem. Biophys. Res. Commun. 1995;208:447-455.
  97. Morimoto T, Devora GA, Mibe M, Casey ML, MacDonald PC. Parathyroid hormone-related protein and human myometrial cells: Action and regulation. Mol. Cell. Endocrinol. 1997;129:91-99.
  98. Yamamoto M, Harm SC, Grasser WA, Thiede MA. Parathyroid hormone-related protein in the rat urinary bladder: A smooth muscle relaxant produced locally in response to mechanical stretch. Proc. Natl. Acad. Sci. USA 1992;89:5326-5330.
  99. Wysolmerski JJ, Mccaugherncarucci JF, Daifotis AG, Broadus AE, Philbrick WM. Overexpression of parathyroid hormone-related protein or parathyroid hormone in transgenic mice impairs branching morphogenesis during mammary gland development. Development 1995;121:3539-3547.
  100. Holick MF, Ray S, Chen TC, Tian X, Persons KS. A parathyroid hormone antagonist stimulates epidermal proliferation and hair growth in mice. Proc. Natl. Acad. Sci. USA 1994;91:8014-8016.
  101. Fukayama S, Tashjian AH Jr, Davis JN, Chisholm JC. Signaling by N- and C-terminal sequences of parathyroid hormone-related protein in hippocampal neurons. Proc. Natl. Acad. Sci. USA 1995;92:10182-10186.
  102. Vasavada R, Cavaliere C, D'Ercole AJ, Dann P, Burtis WJ, Madlener AL, Zawalich K, Zawalich W, Philbrick W, Stewart AF. Overexpression of PTHrP in the pancreatic islets of transgenic mice causes hypoglycemia, hyperinsulinemia and islet hyperplasia. J. Biol. Chem 1996;271:1200-1208.
  103. Karaplis AC, Luz A, Glowacki J, Bronson RT, Tybulewicz VL, Kronenberg HM, Mulligan RC. Lethal skeletal dysplasia from targeted disruption of the parathyroid hormone-related peptide gene. Genes Dev. 1994;8:277-289.
  104. Amizuka N, Karaplis AC, Henderson JE, Warshawsky H, Lipman ML, Matsuki Y, Ejiri S, Tanaka M, Izumi N, Ozawa H, Goltzman D. Haploinsufficiency of parathyroid hormone-related peptide (PTHrP) results in abnormal postnatal bone development. Dev. Biol. 1996;175:166-176.
  105. Lanske B, Amling M, Neff L, Guiducci J, Baron R, Kronenberg HM. Ablation of the PTHrP gene or the PTH/PTHrP receptor gene leads to distinct abnormalities in bone development. J. Clin. Invest. 1999;104:399-407.
  106. Zhang P, Jobert AS, Couvineau A, Silve C. A homozygous inactivating mutation in the parathyroid hormone/parathyroid hormone-related peptide receptor causing Blomstrand chondrodysplasia. J. Clin. Endocrinol. Metab. 1998;83:3365-3368.
  107. Karaplis AC, He B, Nguyen MT, Young ID, Semeraro D, Ozawa H, Amizuka N. Inactivating mutation in the human parathyroid hormone receptor type I gene in Blomstrand chondrodysplasia. Endocrinology 1998;139:5255-5258.
  108. Miao D, He B, Jiang Y, Kobayashi T, Sorocéanu MA, Zhao J, Su H, Tong X, Amizuka N, Gupta A, Genant HK, Kronenberg HM, Goltzman D, Karaplis AC. Osteoblast-derived PTHrP is a potent endogenous bone anabolic agent that modifies the therapeutic efficacy of administered PTH 1-34. Clin. Invest. 2005;115:2402-2411.
  109. Miao D, Li J, Xue Y, Su H, Karaplis AC, Goltzman D. Parathyroid hormone-related peptide is required for increased trabecular bone mass in parathyroid hormone-null mice. Endocrinology 2004;145:3554-3562.
  110. Miao D, Su H, He B, Gao J, Xia Q, Zhu M, Gu Z, Goltzman D, Karaplis AC. Severe growth retardation and early lethality in mice lacking the nuclear localization sequence and C-terminus of PTH-related protein. Proc. Natl. Acad. Sci. U S A. 2008;105(51):20309-20314.
  111. Mundy GR. Bone remodeling. in Favus MJ. (ed): Primer on the metabolic bone diseases and disorders of mineral metabolism, fourth edition. Philadelphia, Lippincott, Williams and Wilkens, 1999, pp 30-38.
  112. Xie H, Cui Z, Wang L, Xia Z, Hu Y, Xian L, Li C, Xie L, Crane J, Wan M, Zhen G, Bian Q, Yu B, Chang W, Qiu T, Pickarski M, Duong LT, Windle JJ, Luo X, Liao E, Cao X. PDGF-BB secreted by preosteoclasts induces angiogenesis during coupling with osteogenesis. Nat.Med. 2014;20:1270–7822.
  113. Sims NA, Martin TJ. Osteoclasts Provide Coupling Signals to Osteoblast Lineage Cells Through Multiple Mechanisms.Annu Rev Physiol. 2020;82:507-529.
  114. Tian E, Zhan F, Walker R, Rasmussen E, Ma Y, Barlogie B, Shaughnessy JD Jr. The role of the Wnt-signaling antagonist DKK1 in the development of osteolytic lesions in multiple myeloma. N. Engl. J. Med. 2003;349:2483–2494.
  115. Milne M, Kang MI, Cardona G, Quail JM, Braverman LE, Chin WW, Baran DT. Expression of multiple thyroid hormone receptor isoforms in rat femoral and vertebral bone and in bone marrow osteogenic cultures. J. Cell Biochem. 1999;74:684-693.
  116. Fell HB, Mellanby E. The effect of hypervitaminosis A on embryonic limb bones cultured in vitro. J. Physiol. 1952;116:320-349.
  117. Horowitz MC Lorenzo JA: Local regulators of bone. in Bilezikian JP, Raisz LG, Rodan GA.(eds): Principles of Bone Biology, second edition. San Diego, Academic Press, 2002, pp 961-978.
  118. Pilbeam CC, Harrison JR, Raisz LG. Principles of Bone Biology, second edition. San Diego, Academic Press, 2002, pp 979-994.
  119. Goltzman D. Nonparathyroid Hypercalcemia. Front Horm Res. 2019;51:77-90.
  120. Marx SJ, Goltzman D. Evolution of Our Understanding of the Hyperparathyroid Syndromes: A Historical Perspective. J Bone Miner Res. 2019;34(1):22-37
  121. 114Krebs LJ, Arnold A. Molecular basis of hyperparathyroidism and potential targets for drug development. Curr. Drug Targets Immune Endocr Metabol Disord. 2002;2:167-179.
  122. Brewer K, Costa-Guda J, Arnold A. Molecular genetic insights into sporadic primary hyperparathyroidism. Endocr Relat Cancer. 2019;26(2):R53–R72 3
  123. Carpten JD, Robbins CM, Villablanca A, Forsberg L, Presciuttini S, Bailey-Wilson J, Simonds WF, Gillanders EM, Kennedy AM, Chen JD, Agarwal SK, Sood R, Jones MP, Moses TY, Haven C, Petillo D, Leotlela PD, Harding B, Cameron D, Pannett AA, Höög A, Heath H 3rd, James-Newton LA, Robinson B, Zarbo RJ, Cavaco BM, Wassif W, Perrier ND, Rosen IB, Kristoffersson U, Turnpenny PD, Farnebo LO, Besser GM, Jackson CE, Morreau H, Trent JM, Thakker RV, Marx SJ, Teh BT, Larsson C, Hobbs MR. HRPT2 encoding parafibromin, is mutated in hyperparathyroidism-jaw tumor syndrome. Nature Genet. 2002;32:676-680..
  124. Shattuck TM, Välimäki S, Obara T, Gaz RD, Clark OH, Shoback D, Wierman ME, Tojo K, Robbins CM, Carpten JD, Farnebo L-O, Larsson C, Arnold A. Somatic and germline mutations of the HRPT2 gene in sporadic parathyroid carcinoma. N. Engl. J. Med. 2003;349:1722-1729.
  125. Costa-Guda J, Soong CP, Parekh VI, Agarwal SK, Arnold A. Germline and somatic mutations in cyclin-dependent kinase inhibitor genes CDKN1A, CDKN2B, and CDKN2C in sporadic parathyroid adenomas. Horm Cancer. 2013;4(5):301–307.
  126. D’Agruma L, Coco M, Guarnieri V, Battista C, Canaff L, Salcuni AS, Corbetta S, Cetani F, Minisola S, Chiodini I, Eller-Vainicher C, Spada A, Marcocci C, Guglielmi G, Zini M, Clemente R, Wong BY, de Martino D, Scillitani A, Hendy GN, Cole DE. Increased prevalence of the GCM2 polymorphism, Y282D, in primary hyperparathyroidism analysis of three Italian cohorts. J Clin Endocrinol Metab. 2014;99(12):E2794–E2798.
  127. Guan B, Welch JM, Sapp JC, Ling H, Li Y, Johnston JJ, Kebebew E, Biesecker LG, Simonds WF, Marx SJ, Agarwal SK. GCM2-activating mutations in familial isolated hyperparathyroidism. Am J Hum Genet. 2016;99(5):1034–1044 7.
  128. Simonds WF, Marx SJ, Agarwal SK. Ethnicity of patients with germline GCM2-activating variants and primary hyperparathyroidism. J Endocr Soc. 2017;1(5):488–499.
  129. Canaff L, Guarnieri V, Kim Y, Wong BYL, Nolin-Lapalme A, Cole DEC, Minisola S, Eller-Vainicher C, Cetani F, Repaci A, Turchetti D, Corbetta S, Scillitani A, Goltzman D. Novel Glial Cells Missing-2 (GCM2) variants in parathyroid disorders. Eur J Endocrinol. 2022;186(3):351-366.)
  130. Kifor O, Moore, FD, Delaney M, Garber J, Hendy GN, Butters R, Gao P, Cantor TL, Kifor I, Brown EM, Wysolmerski J. A syndrome of hypocalciuric hypercalcemia caused by antibodies directed against the calcium-sensing receptor. J. Clin. Endocrinol. Metab. 2003;88:60-72.
  131. Walker MD, Shane E. Hypercalcemia: A Review. JAMA. 2022;328(16):1624-1636
  132. Eastell R, Arnold A, Brandi ML, Brown EM, D'Amour P, Hanley DA, Rao DS, Rubin MR, Goltzman D, Silverberg SJ, Marx SJ, Peacock M, Mosekilde L, Bouillon R, Lewiecki EM. Diagnosis of asymptomatic primary hyperparathyroidism: proceedings of the third international workshop. J. Clin. Endocrinol. Metab. 2009;94(2):340-350.
  133. Agarwal A, Mishra SK, Gujral RB: Advanced skeletal manifestations in primary hyperparathyroidism. Can. J. Surg. 1998;41:342-343.
  134. Bandeira F, Griz L, Caldas G, Macedo G, Bandeira C. Characteristics of primary hyperparathyroidism in one institution in northeast Brazil. Bone. 1998;5:S380.
  135. Biyabani SR, Talati J. Bone and renal stone disease in patients operated for primary hyperparathyroidism in Pakistan: Is the pattern of disease different from the west? J. Pakistan Med. Assoc. 1999;49:194-198.
  136. Chan TB, Lee KO, Rauff A, Tan L, Gwee HM. Primary hyperparathyroidism at the Singapore general hospital. Singapore Med. J. 27:154-157.
  137. Harinarayan CV, Gupta N, Kochupillai N. Vitamin D status in primary hyperparathyroidism in India. Clin. Endocrinol. 1995;43:351-358.
  138. Silverberg SJ, Shane E, De LaCruz L, Dempster DW, Feldman F, Seldin D, Jacobs TP, Siris ES, Cafferty M, Parisien MV, et al. Skeletal disease in primary hyperparathyroidism. J. Bone Miner. Res. 1989;4:283-291.
  139. Silverberg, SJ, Shane E, Jacobs TP, Siris ES, Gartenberg F, Seldin D, Clemens TL, Bilezikian JP. Nephrolithiasis and bone involvement in primary hyperparathyroidism. Am. J. Med. 1990;89:327-334.
  140. Silverberg SJ, Shane E, Jacobs TP, Siris E, Bilezikian JP. A 10-year prospective study of primary hyperparathyroidism with or without parathyroid surgery. N. Engl. J. Med. 1999;341:1249-1255.
  141. Zhao L, Liu JM, He XY, Zhao H-Y, Sun L-H, Tao B, Zhang M-J, Chen X, Wang W-Q, Ning G. The changing clinical patterns of primary hyperparathyroidism in Chinese patients: data from 2000 to 2010 in a single clinical center. J Clin Endocrinol Metab. 2013;98(2):721-728; .
  142. Bilezikian JP, Khan AA, Silverberg SJ, Fuleihan GE, Marcocci C, Minisola S, Perrier N, Sitges-Serra A, Thakker RV, Guyatt G, Mannstadt M, Potts JT, Clarke BL, Brandi ML; International Workshop on Primary Hyperparathyroidism.Evaluation and Management of Primary Hyperparathyroidism: Summary Statement and Guidelines from the Fifth International Workshop. J Bone Miner Res. 2022;37(11):2293-2314
  143. Fitzpatrick LA, Bilezikian JP. Acute primary hyperparathyroidism. Am. J. Med. 1987;82:275-282.
  144. Bilezikian JP, Silverberg SJ, Bandeira F, Cetani F, Chandran M, Cusano NE, Ebeling PR, Formenti AM, Frost M, Gosnell J, Lewiecki EM, Singer FR, Gittoes N, Khan AA, Marcocci C, Rejnmark L, Ye Z, Guyatt G, Potts JT. Management of primary hyperparathyroidism. J Bone Miner Res. 2022;37(11):2391-2403.
  145. Bilezikian JP, Khan AA, Potts JT Jr. Guidelines for the management of asymptomatic primary hyperparathyroidism: summary statement from the third international workshop. J Clin Endocrinol Metab. 2009;94(2):335-339.
  146. Silverberg SJ, Bone HG III, Marriott TB, Locker FG, Thys-Jacobs S, Dziem G, Kaatz S, Sanguinetti EL, Bilezikian JP. Short-term inhibition of parathyroid hormone secretion by a calcium-receptor agonist in patients with primary hyperparathyroidism. N. Eng. J. Med. 1997;337:1506-1510.
  147. Adami S, Mian M, Bertoldo F, Rossini M, Jayawerra P, O'Riordan JL, Lo Cascio V. Regulation of calcium-parathyroid hormone feedback in primary hyperparathyroidism: Effects of bisphosphonate treatment. Clin. Endocrinol. 1990;33:391-397.
  148. Gallagher JC, Nordin BEC. Treatment with oestrogens of primary hyperparathyroidism in postmenopausal women. Lancet 1972;1:503-507.
  149. Rosenthal NR, Insogna KL, Godsall JW, Smaldone L, Waldron JA, Stewart AF. Elevations in circulating 1,25(OH)2D in three patients with lymphoma-associated hypercalcemia. Clin. Endocrinol. Metab. 1985;60:29-33.
  150. Seymour JF, Gagel RF, Hagemeister FB, Dimopoulos MA, Cabanillas F. Calcitriol production in hypercalcemia and normocalcemia patients with non-Hodgkin lymphoma. Ann. Intern. Med. 1994;121:633-640.
  151. Nagai M, Kyakumoto S, Sato N. Cancer cells responsible for humoral hypercalcemia express mRNA encoding a secreted form of ODF/TRANCE that induces osteoclast formation. Biochem. Biophys. Res. Commun. 2000;269:532-536..
  152. Mariathasan S, Andrews KA, Thompson E, Challis BG, Wilcox S, Pierce H, Hale J, Spiden S, Fuller G, Simpson HL, Fish B, Jani P, Seetho I, Armstrong R, Izatt L, Joshi M, Velusamy A, Park SM, Casey RT. Genetic testing for hereditary hyperparathyroidism and familial hypocalciuric hypercalcemia in a large UK cohort. Clin Endocrinol (Oxf). 2020;93(4):409-418.
  153. Li Y, Simonds WF. Endocrine neoplasms in familial syndromes of hyperparathyroidism. Endocr. Relat. Cancer 2016;23(6):R229-47.
  154. Chandrasekharappa SC, Guru SC, Manickam P, Olufemi SE, Collins FS, Emmert-Buck MR, Debelenko LV, Zhuang Z, Lubensky IA, Liotta LA, Crabtree JS, Wang Y, Roe BA, Weisemann J, Boguski MS, Agarwal SK, Kester MB, Kim YS, Heppner C, Dong Q, Spiegel AM, Burns AL, Marx SJ. Positional cloning of the gene for multiple endocrine neoplasia type 1. Science 1997;276:404-407.
  155. Marx SJ: Multiple endocrine neoplasia type I., in Bilezikian JP, Marcus R, Levine MA. (eds): The parathyroids: basic and clinical concepts, second edition. San Diego, Academic Press, 2001, pp 535-584.
  156. Sipple JH: The association of pheochromocytoma with carcinoma of the thyroid gland. Am. J. Med. 1961;31:163-166.
  157. Gagel RF: Multiple endocrine neoplasia., in Wilson JD, Foster DW, Larsen PR, et al. (eds): Williams textbook of endocrinology, 9th edition. Philadelphia, Saunders, 1997, pp 1627-1649.
  158. Mulligan LM, Kwok JB, Healey CS, Elsdon MJ, Eng C, Gardner E, Love DR, Mole SE, Moore JK, Papi L, Ponder MA, Telenius H, Tunnacliffe A, Ponder BAJ. Germ-line mutations of the RET proto-oncogene in multiple endocrine neoplasia type 2A. Nature 1993;363:458-460.
  159. Carney JA, Go VL, Sizemore GW, Hayles AB. Alimentary-tract ganglioneuromatosis. A major component of the syndrome of multiple endocrine neoplasia, type 2b. N. Engl. J. Med. 1976;295:1287-1291.
  160. Mulligan LM, Eng C, Attie T, Lyonnet S, Marsh DJ, Hyland VJ, Robinson BG, Frilling A, Verellen-Dumoulln C, Safar A, Venter DJ, Munnich A, Ponder BAJ. Diverse phenotypes associated with exon 10 mutations of the RET proto-oncogene. Hum. Mol. Genet. 1994;3:2163-2168.
  161. Goltzman D, Potts JT Jr, Ridgway RC, Maloof F. Calcitonin as a tumor marker. Use of the radioimmunoassay for calcitonin in the postoperative evaluation of patients with medullary thyroid carcinoma. N. Engl. J. Med. 1974;290:1035-1039.
  162. Mallette LE, Malini S, Rappaport MP, Kirkland JL. Familial cystic parathyroid adenomatosis. Ann. Intern. Med. 1987;107:54-60.
  163. Jackson CE, Norman RA, Boyd SB, Talpos GB, Wilson SD, Taggart RT, Mallette LE. Hereditary hyperparathyroidism and multiple ossifying jaw fibromas: A clinically and genetically distinct syndrome. Surgery 1990;108:1006-1012.
  164. Simonds WF, Robbins CM, Agarwal SK, Hendy GN, Carpten JD, Marx SJ. Familial isolated hyperparathyroidism is rarely caused by germline mutation in HRPT2, the gene for the hyperparathyroidism-jaw tumor syndrome. J Clin Endocrinol Metab. 2004;89:96-102.
  165. Canaff L, Guarnieri V, Kim Y, Wong BYL, Nolin-Lapalme A, Cole DEC, Minisola S, Eller-Vainicher C, Cetani F, Repaci A, Turchetti D, Corbetta S, Scillitani A, Goltzman D. Novel Glial Cells Missing-2 (GCM2) variants in parathyroid disorders. Eur J Endocrinol. 2022;186(3):351-366
  166. Marx SJ, Attie MF, Levine MA, Spiegel AM, Downs RW Jr, Lasker RD. The hypocalciuric or benign variant of familial hypercalcemia: Clinical and biochemical features in fifteen kindreds. Medicine 1981;60:397-412.
  167. Heath H III: Familial benign (Hypocalciuric) hypercalcemia. A troublesome mimic of mild primary hyperparathyroidism. Endocrinol. Metab. Clin. North Am. 1989;18:723-740.
  168. Pollak MR, Brown EM, Chou YH, Hebert SC, Marx SJ, Steinmann B, Levi T, Seidman CE, Seidman JG. Mutations in the human Ca2+-sensing receptor gene cause familial hypocalciuric hypercalcemia and neonatal severe hyperparathyroidism. Cell 1993;75:1297-1303.
  169. Marx SJ, Attie MF, Spiegel AM, Levine MA, Lasker RD, Fox M. An association between neonatal severe primary hyperparathyroidism and familial hypocalciuric hypercalcemia in three kindreds. N. Eng. J. Med. 1982;306:257-64.
  170. Kifor O, Moore FD Jr, Delaney M, Garber J, Hendy GN, Butters R, Gao P, Cantor TL, Kifor I, Brown EM, Wysolmerski J. A syndrome of hypocalciuric hypercalcemia caused by autoantibodies directed at the calcium-sensing receptor. J Clin Endocrinol Metab. 2003;88(1):60-72
  171. Parfitt AM. Parathyroid growth: normal and abnormal. in Bilezikian JP, Marcus R, Levine MA. (eds): The parathyroids: basic and clinical concepts, second edition. San Diego, Academic press, 2001, pp 293-329.
  172. Burman KD, Monchick JM, Earl JM, Wartofsky L. Ionized and total serum calcium and parathyroid hormone in hyperthyroidism. Ann. Intern. Med. 1976;84:668-671.
  173. Britto JM, Fenton AJ, Holloway WR, Nicholson GC. Osteoblasts mediate thyroid hormone stimulation of osteoclastic bone resorption. Endocrinology 123:169-176.
  174. Rosen HN, Moses AC Gundberg C, Kung VT, Seyedin SM, Chen T, Holick M, Greenspan SL. Therapy with parenteral pamidronate prevents thyroid hormone-induced bone turnover in humans. J. Clin. Endocrinol. Metab. 1993;77:664-669.
  175. Rude RK, Oldham SB, Singer FR, Nicoloff JT. Treatment of thyrotoxic hypercalcemia with propranolol. N. Eng. J. Med. 1976;294:431-433.
  176. Ross DS, Nussbaum SR: Reciprocal changes in parathyroid hormone and thyroid function after radioiodine treatment of hyperthyroidism. J. Clin. Endocrinol. Metab. 1989;68:1216-1219.
  177. Kimura S, Nishimura Y, Yamaguchi K, Nagasaki K, Shimada K, Uchida H. A case of pheochromocytoma producing parathyroid hormone-related protein and presenting with hypercalcemia. J. Clin. Endocrinol. Metab.1990;70: 1559–1563.
  178. Mune T, Katakami H, Kato Y, Yasuda K, Matsukura S, Miura K. Production and secretion of parathyroid hormone-related protein in pheochromocytoma: participation of an alpha-adrenergic mechanism. J Clin Endocrinol Metab. 1993;76(3):757-762.
  179. Ghaferi AA, Chojnacki KA, Long WD, Cameron JL, Yeo CJ. Pancreatic VIPomas: subject review and one institutional experience. J. Gastrointest. Surg. 2008;12(2):382-393.
  180. Vasikaran SD, Tallis GA, Braund WJ: Secondary hypoadrenalism presenting with hypercalcemia. Clin. Endocrinol. 1994;41:261-264.
  181. Diamond T, Thornley S: Addisonian crisis and hypercalcemia. Aust. N.Z. J. Med. 1994;24:316.
  182. Schipiani E, Kruse K, Jhppner H. A constitutively active mutant PTH-PTHrp receptor in Jansen-type metaphyseal chondrodysplasia. Science 1995;268:98-100.
  183. Zondek H, Petrow H, Siebert W. Die Bedeutung der Calciumbestimmung im Blute fhr die Diagnose der Niereninsuffizienz. Z. Klin. Med. 1924;9:129-138.
  184. Gutman Ab, Tyson TL, Gutman EB. Serum calcium, inorganic phosphorus, and phosphatase activity in hyperparathyroidism, Paget's disease, multiple myeloma and neoplastic disease of bones. Arch. Int. Med. 1936;7:379-413.
  185. Albright R. Case records of the Massachusetts General Hospital (Case 27401). N. Engl. J. Med. 1941;225:789-791
  186. Lafferty FW. Pseudohyperparathyroidism. Medicine 1966;45:247-260.
  187. Powell D, Singer FR, Murray TM, Minkin C, Potts JR Jr. Non-parathyroid humoral hypercalcemia in patients with neoplastic disease. N. Engl. J. Med. 1973;89:176-181.
  188. Simpson EL, Mundy GR, D'Souza SM, Ibbotson KJ, Bockman R, Jacobs JW. Absence of parathyroid hormone messenger RNA in non-parathyroid tumors associated with hypercalcemia. N. Engl. J. Med. 1983;309:325-330.
  189. Goltzman D, Stewart AF, Broadus AE. Malignancy-associated hypercalcemia evaluation with a cytochemical bioassay for parathyroid hormone. J. Clin. Endocrinol. Metab. 1981;53:899-904.
  190. Stewart AF, Insogna KL, Goltzman D, Broadus AE. Identification of adenylate cyclase-stimulating activity and cytochemical glucose-6-phosphatedehydrogenase-stimulating activity in extracts of tumors from patients with hypercalcemia of malignancy. Proc. Natl. Acad. Sci. USA. 1983;80:1454-1458.
  191. Suva LJ, Winslow GA, Wettenhall REH, Hammonds RG, Moseley JM, Diefenbach-Jagger H, Rodda CP, Kemp BE, Rodriguez H, Chen EY, et al. A parathyroid hormone-related protein implicated in malignant hypercalcemia: cloning and expression. Science 1987;237:893-896.
  192. Kukreja SC, Schavin DH, Winbuscus S, Ebeling PR, Danks JA, Rodda CP, Wood WI, Martin TJ. Antibodies to parathyroid hormone-related protein lower serum calcium in athymic mouse models of malignancy associated hypercalcemia due to human tumors. J. Clin. Invest.1988;82:1798-1802.
  193. Henderson JE, Bernier S, D'Amour P, Goltzan D. Effects of passive immunization against parathyroid hormone (PTH)-like peptide and PTH in hypercalcemic tumor-bearing rats and normocalcemic controls. Endocrinology 1990;127:1310-1318.
  194. Fraher LJ, Hodsman AB, Jonas K, Saunders D, Rose CI, Henderson JE, Hendy GN, Goltzman D. A comparison of the in vivo biochemical responses to exogenous parathyroid hormone (1-34) [PTH 1-34] and PTH-related peptide (1-34) in man. J. Clin. Endocrinol. Metab. 1992;75:417-423.
  195. Yamato H, Nagai Y, Inoue D, Ohnishi Y, Ueyama Y, Ohno H, Matsumoto T, Ogata E, Ikeda K. In vivo evidence for progressive activation of parathyroid hormone-related peptide gene transcription with tumor growth and stimulation of osteoblastic bone formation at an early stage of humoral hypercalcemia of malignancy. J. Bone Miner. Res. 1995;10:36-44.
  196. Budayr AA, Nissenson RA, Klein RF, Pun KK, Clark OH, Diep D, Arnaud CD, Strewler GJ. Increased serum levels of parathyroid hormone-like protein in malignancy-associated hypercalcemia. Ann. Intern. Med. 1989;111:807-812.
  197. Burtis WJ, Brady TG, Orloff JJ, Ersbak JB, Warrell RP Jr., Olson BR, Wu TL, Mitnick ME, Broadus AE, Stewart AF. Immunochemical characterization of circulating parathyroid hormone-related protein in patients with humoral hypercalcemia of cancer. N. Eng. J. Med. 1990;322:1106-1112.
  198. Henderson JE, Shustik C, Kremer R, Rabbani SA, Hendy GN, Goltzman D. Circulating concentrations of parathyroid hormone-like peptide in malignancy and hyperparathyroidism. J. Bone Miner. Res. 1990;5:105-113.
  199. Ratcliffe WA, Norbury C, Stott RA, Heath DA, Ratcliffe JG. Immunoreactivity of plasma parathyrin-related peptide: Three region specific radioimmunoassays and a two-site immunoradiometric assay compared. Clin. Chem. 1991;37:1781-1787.
  200. Grill V, Ho P, Body JJ, Lee SC, Kukreja SC, Moseley JM, Martin TJ. Parathyroid hormone-related protein: elevated levels in both humoral hypercalcemia of malignancy and hypercalcemia complicating metastatic breast cancer. J. Clin. Endocrinol. Metab. 1991;73:1309-1315.
  201. Holt EH, Vasavada R, Bander NH, Broadus AE, Philbrick WM. Region-specific methylation of the PTH-related peptide gene determines its expression in human renal carcinoma lines. J. Biol. Chem. 1993;268:20639-20645.
  202. Sidler B, Alpert L, Henderson JE, Deckelbaum R, Amizuka N, Silva JE, Goltzman D, Karaplis AC. Overexpression of parathyroid hormone-related peptide (PTHrP) by gene amplification in colonic carcinoma. J. Clin. Endocrinol. Metab. 1996;81:2841-2847.
  203. Grunbaum A, Kremer R. Parathyroid hormone-related protein (PTHrP) and malignancy. Vitam Horm. 2022;120:133-177
  204. Truong NU, deB Edwardes MD, Papavasiliou V, Goltzman D, Kremer R. Parathyroid hormone-related peptide and survival of patients with cancer and hypercalcemia. Am. J. Med. 2003;115:115-121.
  205. Soki FN, Park SI, McCauley LK. The multifaceted actions of PTHrP in skeletal metastasis. Future Oncol. 2012;8(7):803-817.
  206. Li J, Karaplis AC, Huang DC, Siegel PM, Camirand A, Yang XF, Muller WJ, Kremer R. A parathyroid hormone-related protein implicated in malignant hypercalcemia: cloning and expression. J Clin Invest 12011;21(12): 4655–4669.
  207. Hirbe AC, Morgan EA, Weilbaecher KN. The CXCR4/SDF-1 chemokine axis: A potential therapeutic target for bone metastases? Current Pharmaceutical Design. 2010;16(11):1284–1290.
  208. Goltzman D. Non-parathryoid hypercalcemia. In: Frontiers of Hormone Research: Parathyroid Disorders:Focusing on Unmet Needs. ML Brandi(ed) Karger Basel, Switzerland 2019;vol 51 pp77-90.
  209. Goltzman D. Pathophysiology of hypercalcemia. Endocrinol Metab Clin North Am. 2021;50(4):591-607.
  210. Nakayama K, Fukumoto S, Takeda S, Takeuchi Y, Ishikawa T, Miura M, Hata K, Hane M, Tamura Y, Tanaka Y, Kitaoka M, Obara T, Ogata E, Matsumoto T. Differences in bone and vitamin D metabolism between primary hyperparathyroidism and malignancy-associated hypercalcemia. J. Clin. Endocrinol. Metab. 1996;81:607-611.
  211. Stewart AF, Vignery A, Silvergate A, Ravin ND, LiVolsi V, Broadus AE, Baron R. Quantitative bone histomorphometry in humoral hypercalcemia of malignancy. J. Clin. Endocrinol. Metab. 1982;55:219-227.
  212. Guise TA, Yin JJ, Taylor SD, Kumagai Y, Dallas M, Boyce BF, Yoneda T, Mundy GR. Evidence for a causal role of parathyroid hormone related protein in the pathogenesis of human breast cancer-mediated osteolysis. J. Clin. Invest. 1996;98:1544-1549.
  213. Rabbani SA, Gladu J, Harakidas P, Jamison B, Goltzman D. Overproduction of parathyroid hormone related peptide results in increased osteolytic skeletal metastasis by prostate cancer cells in vivo. Int. J. Cancer 1999;80:257-264.
  214. Yin JJ, Selander K, Chirgwin JM, Dallas M, Grubbs BG, Wieser R, Massagué J, Mundy GR, Guise TA. TGF-b signaling blockade inhibits PTHrP secretion by breast cancer cells and bone metastases development. J. Clin. Invest. 1999;103:197-206.
  215. Li X, Loberg R, Liao J, Ying C, Snyder LA, Pienta KJ, McCauley LK. A destructive cascade mediated by CCL2 facilitates prostate cancer growth in bone. Cancer Res. 2009;69(4):1685–1692.
  216. Kremer R, Shustik C, Tabak T, Papavasiliou V, Goltzman D. Parathyroid hormone related peptide in hematologic malignancies. Am. J. Med. 1996;100:406-411.
  217. Firkin F, Seymour JF, Watson AM, Grill V, Martin TJ. Parathyroid hormone related protein in hypercalcemia associated with haematological malignancy. Br. J. Haematol. 1996;94:486-492.
  218. Watanabe T, Yamaguchi K, Takatsuki K, Osame M, Yoshida M. Constitutive expression of parathyroid hormone-related protein gene in human T cell leukemic virus type I (HTLV1) carriers and adult T cell leukemic patients that can be transactivated by HTLV-1 tax gene. J. Exp. Med. 1990;172:759-765.
  219. Grill V, Murray RML, Ho PWM, Santamaria JD, Pitt P, Potts C, Jerums G, Martin TJ. Circulating PTH and PTHrP levels before and after treatment of tumor induced hypercalcemia with pamidronate disodium (APD). J. Clin. Endocrinol. Metab. 1992;74:1468-1470.
  220. Truong NU, de B Edwardes MD, Papavasiliou V, Goltzman D, Kremer R. Parathyroid hormone-related peptide and survival of patients with cancer and hypercalcemia. Am. J Med. 2003;115:115-121.
  221. Breslau NA, McGuire JL, Zerwekh JE, Frenkel EP, Pak CY. Hypercalcemia associated with increased serum calcitriol levels in three patients with lymphoma. Ann. Intern. Med. 1984;100:1-6.
  222. Nussbaum SR, Gaz RD, Arnold A: Hypercalcemia and ectopic secretion of parathyroid hormone by an ovarian carcinoma with rearrangement of the gene for PTH. N. Engl. J. Med. 1990;323:1324-1328.
  223. Iguchi H, Miyagi C, Tomita K, Kawauchi S, Nozuka Y, Tsuneyoshi M, Wakasugi H. Hypercalcemia caused by ectopic production of parathyroid hormone in a patient with papillary adenocarcinoma of the thyroid gland. J. Clin. Endocrinol. Metab. 1998;83:2653-2657.
  224. Nakajima K, Tamai M, Okaniwa S, Nakamura Y, Kobayashi M, Niwa T, Horigome N, Ito N, Suzuki S, Nishio S, Komatsu M. Humoral hypercalcemia associated with gastric carcinoma secreting parathyroid hormone: a case report and review of the literature. Endocr J. 2013;60(5):557-562.
  225. Mundy GR, Yoneda T, Guise TA, et al: Local factors in skeletal malignancy., in Bilezikian JP, Raisz LJ, Rodan GA. (eds): Principles of Bone Biology, second edition. San Diego, Academic Press, 2002, pp 1093-1104.
  226. Roodman GD. Genes associate with abnormal bone cell activity in bone metastasis. Cancer Metastasis Rev. 2012;31(3-4):569-578.
  227. Pearse RN, Sordillo EM, Yaccoby S Wong BR, Liau DF, Colman N, Michaeli J, Epstein J, Choi Y. Multiple myeloma disrupts the TRANCE/osteoprotegerin cytokine axis to trigger bone destruction and promote tumor progression. Proc. Natl. Acad. Sci USA 2001;98:11581-11586.
  228. Tian E, Zhan F, Walker R, Rasmussen E, Ma Y, Barlogie B, Shaughnessy JD Jr. The role of the Wnt-signaling antagonist DKK1 in the development of osteolytic lesions in multiple myeloma. N. Engl. J. Med. 2003;349: 2483-2494.
  229. Oshima T, Abe M, Asano J, Hara T, Kitazoe K, Sekimoto E, Tanaka Y, Shibata H, Hashimoto T, Ozaki S, Kido S, Inoue D, Matsumoto T. Myeloma cells suppress bone formation by secreting a soluble Wnt inhibitor, sFRP-2. Blood, 2005;106(9):3160–3165.
  230. Terpos E, Christoulas D, Katodritou E, Bratengeier C, Gkotzamanidou M, Michalis E, Delimpasi S, Pouli A, Meletis J, Kastritis E, Zervas K, Dimopoulos MA. Elevated circulating sclerostin correlates with advanced disease features and abnormal bone remodeling in symptomatic myeloma: reduction post-bortezomib monotherapy. Int J Cancer. 2012;131(6):1466-71.
  231. Adams JS: Hypercalcemia due to granuloma-forming disorders., in Favus MJ. (ed): Primer on the metabolic bone diseases and disorders of mineral metabolism, fourth edition. Philadelphia, Lippincott, Williams and Wilkins, 1999, pp 212-214.
  232. Studdy PR, Bird R, Neville E, James DG. Biochemical findings in sarcoidosis. J. Clin. Pathol. 1980;33:528-533.
  233. Bell NH, Gill JR Jr, Bartter FC: On the abnormal calcium absorption in sarcoidosis: evidence for increased sensitivity to vitamin D. Am. J. Med. 1964;36:500-513.
  234. Fallon MD, Perry HM III, Teitelbaum SL: Skeletal sarcoidosis with osteopenia. Metab. Bone Dis. Res.1981; 3:171-174.
  235. Rizzato G, Montemurro L, Fraioli P: Bone mineral content in sarcoidosis. Semin. Resp. Med. 1992;13:411-423.
  236. Adams JS, Singer FR, Gacad MA, Sharma OP, Hayes MJ, Vouros P, Holick MF. Isolation and structural identification of 1,25-dihydroxyvitamin D3 produced by cultured alveolar macrophages in sarcoidosis. J. Clin. Endocrinol. Metab. 1985;60:960-966.
  237. Sandler LM, Wineals CG, Fraher LJ, Clemens TL, Smith R, O'Riordan JL. Studies of the hypercalcemia of sarcoidosis: effects of steroids and exogenous vitamin D3 on the circulating concentration of 1,25-dihydroxyvitamin D3. Q. J. Med. 1984;53:165-180.
  238. Adams JS, Diz MM, Sharma OP: Effective reduction in the serum 1,25-dihydroxyvitamin D and calcium concentration in sarcoidosis-associated hypercalcemia with short-course chloroquine therapy. Ann. Intern. Med. 1989;111:437-438.
  239. Adams JS, Sharma OP, Diz MM, Endres DB. Ketoconazole decreases the serum 1,25-dihydroxyvitamin D and calcium concentration in sarcoidosis-associated hypercalcemia. J. Clin. Endocrinol. Metab. 1990;70:1090-1095.
  240. Zaloga GP, Chernow B, Eil C. Hypercalcemia and disseminated cyto-megalovirus infection in the acquired immunodeficiency syndrome. Ann. Int. Med. 1985;102:331-333.
  241. Gayet S, Ville E, Durand JM, Mars ME, Morange S, Kaplanski G, Gallais H, Soubeyrand J. Foscarnet-induced hypercalcemia in AIDS. AIDS 1997;11:1068-1070.
  242. Preus M. The Williams syndrome: objective definition and diagnosis. Clin. Genet. 1984;25:422-428.
  243. Taylor AB, Stern PH, Bell NH. Abnormal regulation of circulating 25OHD in the Williams syndrome. N. Engl. J. Med. 1982;306:972-975.
  244. Curran ME, Atkinson DL, Ewart AK, Morris CA, Leppert MF, Keating MT. The elastin gene is disrupted by a translocation associated with supravalvular aortic stenosis. Cell 1993;73:159-168.
  245. Stokes VJ, Nielsen MF, Hannan FM, Thakker RV. Hypercalcemic Disorders in Children. J Bone Miner Res. 2017;32(11):2157-2170
  246. Martin NDT, Snodgrass GJAI, Cohen RD. Idiopathic infantile hypercalcemia: a continuing enigma. Arch. Dis. Child. 1984;59:605-613.
  247. Schlingmann KP, Kaufmann M, Weber S, Irwin A, Goos C, John U, Misselwitz J, Klaus G, Kuwertz-Bröking E, Fehrenbach H, Wingen AM, Güran T, Hoenderop JG, Bindels RJ, Prosser DE, Jones G, Konrad M. Mutations in CYP24A1 and idiopathic infantile hypercalcemia. N. Engl. J. Med. 2011;365(5):410-421.
  248. Saponaro F. Rare Causes of Hypercalcemia. Endocrinol Metab Clin North Am. 2021;50(4):769-779
  249. Saarela T, Similä S, Koivisto M. Hypercalcemia and nephrocalcinosis in patients with congenital lactase deficiency. J. Pediatr. 1995;127:920-923.
  250. Belmont JW, Reid B, Taylor W, Baker SS, Moore WH, Morriss MC, Podrebarac SM, Glass N, Schwartz ID. Congenital sucrase-isomaltase deficiency presenting with failure to thrive, hypercalcemia, and nephrocalcinosis. BMC Pediatr 2002;2:4.
  251. Porter RH, Cox BG, Heaney D, Hostetter TH, Stinebaugh BJ, Wadi N. Suki WN. Treatment of hypoparathyroid patients with chlorthalidone. N. Engl. J. Med. 1978;298:577-581.
  252. Haden ST, Stoll AL, McCormick S, Scott J, Fuleihan G el-H. Alterations in parathyroid dynamics in lithium-treated subjects. J. Clin. Endocrinol. Metab. 1979;82:2844-2848.
  253. Pettifor JM, Bikle DD, Cavalerso M, Zachen D, Kamdar MC, Ross FP. Serum levels of free 1,25-dihydroxyvitamin D in vitamin D toxicity. Ann. Intern. Med. 1995;122:511-513.
  254. Valente JD, Elias AN, Weinstein GD. Hypercalcemia associated with oral isotretinoin in the treatment of severe acne. JAMA 1983;290:1899-1900.
  255. Suzumiya J, Asahara F, Katakami H, Kimuran N, Hisano S, Okumura M, Ohno R. Hypercalcemia caused by all trans-retinoic acid treatment of acute promyelocytic leukaemia: case report. Eur. J. Haematol. 1994;53:126-127.
  256. Villablanca J, Khan AA, Avramis VI, Seeger RC, Matthay KK, Ramsay NK, Reynolds CP. Phase I trial of 13-cis-retinoic acid in children with neuroblastoma following bone marrow transplantation. J. Clin. Oncol. 1995;13:894-901.
  257. Nikolic-Temasevic Z, Jelic S, Popov I, Radosavljevic D, Mitrovic L. Tumor “flare” hypercalcemia – an additional indication for bisphosphonates? Oncology 2001;60:123–126.
  258. Arumugam GP, Sundravel S, Shanthi P, Sachdanandam P. Tamoxifen flare hypercalcemia: an additional support for gallium nitrate usage. J Bone Miner Metab. 2006;24(3):243-7
  259. Legha SS, Powell K, Buzdar AU, Blumenschein GR. Tamoxifen-induced hypercalcemia in breast cancer. Cancer 1981;47:2803-2806.
  260. McPherson ML, Prince SR, Atamer ER, Maxwell DB, Ross-Clunis H, Estep HL. Theophylline-induced hypercalcemia. Ann Intern Med. 1986;105(1):52-54.
  261. Ott SM, Maloney NA, Klein GL, Alfrey AC, Ament ME, Coburn JW, Sherrard DJ. Aluminum is associated with low bone formation in patients receiving chronic parenteral nutrition. Ann. Intern. Med. 1983;96:910-914.
  262. Beall DP, Scofield RH: Milk-alkali syndrome associated with calcium carbonate consumption. Medicine 1995;74: 89-96.
  263. Tsai WC, Wang WJ, Chen WL, Tsao YT, Tsao YT. Surviving a crisis of immobilization hypercalcemia. J. Am. Geriatr. Soc. 2012;60(9):1778-1780.
  264. Stewart AF, Adler M, Byers CM, Segre GV, Broadus AE. Calcium homeostasis in immobilization: An example of resorptive hypercalciuria. N. Engl. J. Med. 1982;306:1136–1140.
  265. Nussbaum Sr, Zahradnik RK, Lavigne JR, Brennan GL, Nozawa-Ung K, Kim LY, Keutmann HT, Wang CA, Potts JT Jr, Segre GV. Highly sensitive two-site immunoradiometric: assay of parathyrin and its clinical utility in evaluating patients with hypercalcemia. Clin. Chem. 1987;33:1364-1367.
  266. Wei JP, Burke GJ: Cost utility of routine imaging with Tc-99m-sestamibi in primary hyperthyroidism before initial surgery. Amer. Surg. 1997;63(12):1097-1100.
  267. Hosking DJ, Cowley A, Bucknall CA. Rehydration in the treatment of severe hypercalcemia. Q.J. Med. 1981;200:473-481.
  268. El-Hajj Fuleihan G, Clines GA, Hu MI, Marcocci C, Murad MH, Piggott T, Van Poznak C, Wu JY, Drake MT. Treatment of Hypercalcemia of Malignancy in Adults: An Endocrine Society Clinical Practice Guideline. J Clin Endocrinol Metab. 2023;108(3):507-528.
  269. Body JJ, Lortholary A, Romieu G, Vigneron AM, Ford J. A dose-finding study of zoledronate in hypercalcemic cancer patients. J. Bone Miner. Res. 1999;14:1557-1561.
  270. Nussbaum SR, Younger J, VandePol CJ, Gagel RF, Zubler MA, Chapman R, Henderson IC, Mallette LE. Single dose intravenous therapy with pamidronate for the treatment of hypercalcemia of malignancy: Comparison of 30-60-, and 90 mg dosages. Am. J. Med. 1993;95:297-304.
  271. Silva O, Becker KL. Salmon calcitonin in the treatment of hypercalcemia. Arch. Intern. Med. 1973;132:337-339.
  272. Ralston SH, Alzaid AA, Gardner MD, Boyle IT. Treatment of cancer associated hypercalcemia with combined aminohydroxypropylidine diphosphonate and calcitonin. Br. Med. J. 1986;292:1549-1550.
  273. Gurney H, Grill V, Martin TJ. Parathyroid hormone-related protein and response to pamidronate in tumour-induced hypercalcemia. Lancet 341:1611-1613.
  274. Percival RC, Yates AJP, Gray RES, Neal FE, Forrest AR, Kanis JA. The role of glucocorticoids in the management of malignant hypercalcemia. Br. Med. J. 1984;289:287.
  275. Bilezikian JP, Khan AA, Clarke BL, Mannstadt M, Potts JT, Brandi ML. The Fifth International Workshop on the Evaluation and Management of Primary Hyperparathyroidism. J Bone Miner Res. 2022;37(11):2290-2292
  276. Heyburn PJ, Selby PL, Peacock M, Sandler LR, Parsons FM. Peritoneal dialysis in the management of severe hypercalcemia. Br. Med. J. 1980;280:525-526.
  277. Cardella CJ, Birkin BL, Rapoport A. Role of dialysis in the treatment of severe hypercalcemia: Report of two cases successfully treated with hemodialysis and review of the literature. Clin. Nephrol. 1979;12:285-290.
  278. Bergstrom WH. Hypercalciuria and hypercalcemia complicating immobilization. Am. J. Dis. Child. 1978;132:553-554.
  279. McIntyre HD, Cameron DP, Urquhart SM, Davies WE. Immobilization hypercalcemia responding to intravenous pamidronate sodium therapy. Postgrad. Med. J. 1989;65:244-246.


CCKoma

ABSTRACT


Cholecystokinin (CCK)-secreting neuroendocrine tumors (CCKomas) are very rare neuroendocrine tumors of the pancreas. CCKomas can present with persistent non-watery diarrhea, weight loss combined with more specific symptoms of gallbladder disease and duodenal ulcer disease. The diagnosis is based on elevated circulating CCK levels in the absence of elevated circulating gastrin concentrations.


INTRODUCTION


In 1928, the famous US physiologist Andrew Conway Ivy and the neurosurgeon Eric Oldberg isolated the hormone cholecystokinin (CCK) from jejunal extracts. CCK belongs to a large peptide family, but in humans CCK and gastrin are the only family members. Both peptides are ligands for the CCK1 and CCK2 receptors (1).


PHYSIOLOGY OF CHOLECYSTOKININ


CCK peptides have local acute digestive effects including stimulation of gallbladder contraction and gut motility, stimulation of pancreatic enzyme secretion, and stimulation of acid secretion from the stomach (1). CCK also is a growth factor and neurotransmitter in the brain and peripheral neurons (1). CCK stimulates calcitonin, insulin, and glucagon secretion, and may act as a natriuretic peptide in the kidneys, sperm fertility factor, cytokine, and marker of heart failure. CCK is derived from proCCK and its plasma forms are CCK-58, -33, -22, and -8, whereas CCK-8 and -5 are neurotransmitters (1). CCK expression has also been encountered at variable amounts in different neuroendocrine tumors, like corticotroph pituitary tumors, medullary thyroid carcinomas, and pheochromocytomas and other neoplasms such as Ewing’s sarcomas, cerebral gliomas, astrocytomas, and acoustic neuromas. However, its expression in these tumors has never been associated with increased concentrations of CCK in plasma or the presence or symptoms thereof (1).


CCKoma


A few case reports of patients with metastatic neuroendocrine pancreatic tumors presenting with a specific CCKoma syndrome were recently published; the first case being described by the Danish biochemist Jens Rehfeld and his clinical colleagues (2). These case reports further suggest that circulating CCK may be a useful tumor marker in neuroendocrine tumor patients (2,3). For proper CCKoma diagnosis, assays that distinguish sulfated CCK from nonsulfated CCK and gastrin are required (1).


Symptoms that should raise CCKoma suspicion are: 1. persistent non-watery diarrhea; 2. weight loss, 3. combined with more specific symptoms of gallbladder disease and duodenal ulcer disease (1-3). Since the clinical presentation of CCKoma could mimic gastrinomas, because CCK peptides are full agonists of the gastrin/CCK-B receptor, circulating gastrin concentrations should not be elevated in the presence of elevated circulating CCK levels in CCKoma patients (1-3). The CCKoma syndrome is very rare. It has been suggested that some gastrinoma patients with nondetectable serum gastrin levels might represent misdiagnosed CCKoma patients awaiting correct diagnosis. However, in a series of 284 patients with neuroendocrine tumors of the gastrointestinal tract and pancreas, and/or with metastases in the liver, only one CCKoma patient could be identified who also presented with typical symptomatology (3).


REFERENCES

  1. Rehfeld JF. Cholecystokinin—From Local Gut Hormone to Ubiquitous Messenger. Front Endocrinol (Lausanne). 2017 Apr 13;8:47/1-8.
  2. Rehfeld JF, Federspiel B, Bardram L. A neuroendocrine tumor syndrome from cholecystokinin secretion. N Engl J Med, 368 (2013), pp. 1165-1166.
  3. Rehfeld JF, Federspiel B, Agersnap M, Knigge U, Bardram L. The uncovering and characterization of a CCKoma syndrome in enteropancreatic neuroendocrine tumor patients. Scand J Gastroenterol. 2016 Oct;51(10):1172-8.

Ghrelinoma

ABSTRACT


Ghrelin is a 28 amino acid, acylated peptide mainly produced in the P/D1 neuroendocrine cells of the stomach wall. The peptide stimulates growth hormone release by acting on both the pituitary and hypothalamus, but also stimulates ACTH and prolactin as well as gastric acid secretion and intestinal motility. Ghrelin also increases appetite and food intake. Expression of ghrelin protein and mRNA has been identified in high percentages of gastric neuroendocrine tumors (NETs) but also intestinal and pancreatic NETs. Theoretically, a ghrelinoma could cause acromegaly, diabetes mellitus, diarrhea and gastric acid hypersecretion. Small numbers of cases with elevated plasma ghrelin have been reported. However, patients often have non-specific symptoms, that do not resemble the theoretical syndrome of a ghrelinoma. This suggests a low biological activity of these elevated ghrelin levels, which could by related to the ratio of acylated ghrelin and unacylated ghrelin. At this time the clinical relevance of hyperghrelinemia for NETs remains limited.


GHRELIN


Ghrelin is a 28 amino acid, acylated peptide mainly produced in the P/D1 neuroendocrine cells of the stomach wall (1,2). It was discovered in 1999 by Kojima and colleagues as a ligand for the growth-hormone secretagogues receptor 1a (GHS-R1a), purified from rat stomach extract (1). Ghrelin expression has been found in multiple organs including the bowel, adrenal gland, thyroid, ovary, testis, prostate, liver kidneys and myocardium (2-5). On top of this, ghrelin is produced in the central nervous system, particularly in the hypothalamus (6). Two isoforms of ghrelin can be found in equal amounts in the circulation: acylated ghrelin (AG) and unacylated ghrelin (UAG) (7). AG is formed when a hydroxyl group on one of UAGs serine residues is acylated by Ghrelin O-Acyltransferase (GOAT). The acylation allows AG to cross the blood-brain barrier and bind to the GHS-R1a and thereby stimulate growth hormone (GH) release in the pituitary and GHRH in the hypothalamus (8). Vice versa, GH infusion has been shown to decreases ghrelin levels (9). Other effects of ghrelin on the pituitary include stimulation of CRH dependent ACTH release, prolactin secretion and suppression of gonadotrophins (9). UAG does not bind to the GHS-R1a and was previously considered to be inactive, but currently both AG and UAG have been shown to influence glycemic regulation. When AG is administered to healthy individuals, insulin levels decline and plasma glucose levels increase. Coadministration of AG and UAG blunts the AG-induced alteration in insulin and  glucose levels, suggesting UAG is an antagonist for AG (10). Ghrelin also has an important role in fasting. Plasma ghrelin levels rise preprandially and stimulates appetite, increases intestinal motility and gastric acid secretion (11). Acutely increased ghrelin levels stimulate lipolysis, however chronic administration of AG results in lipogenesis (12,13). Lastly, cardiovascular effects of ghrelin have been reported including vasodilation and an increased cardiac index and stroke volume (14). In Table 1 an overview of the effects of AG is provided.


Table 1. Effects of Ghrelin

Site of action

Acylated ghrelin action.

Potential ghrelinoma symptoms

Pituitary

↑ GH secretion

↑ ACTH secretion

↑ PRL secretion

↓ LH in men/↓FSH and LH in women

Acromegaly

Cushing syndrome

Hypogonadism

Hypothalamus

↑ GHRH secretion

↑ CRH secretion

↓ GnRH pulse generator

↑ Food intake (via NPY) and appetite

See pituitary

Pancreas

↓ Insulin secretion (spontaneous and glucose stimulated)

↑ Glucose levels

↑ Glycogenolysis

↑ Glucagon secretion

Diabetes mellitus

Adipose tissue

↑ Lipogenesis (chronic)

↑ Lipolysis (acute)

Absence of cancer cachexia

Cardiovascular system

↑ Cardiac output

↑ Cardiac contractility

↓ Systemic vascular resistances

↑ Vasodilation


Gastrointestinal system

↑ Gastric emptying

↑ Gastric acid secretion

↑ Gastric and intestinal motility

Gastric acid hypersecretion

Diarrhea

Liver

↑ IGF-1


Table modified from Motta G. et al; Natural and Synthetic Growth Hormone Secretagogues. Encyclopedia of Endocrine Diseases (27)


GHRELIN AND NEUROENDOCRINE TUMORS


Based upon the physiologic effects of ghrelin one would expect that the clinical features of a ghrelinoma would include hyperglycemia (decreased insulin secretion) and GH excess with elevated IGF-1 and potentially features of acromegaly. Gastrointestinal symptoms could include hyperphagia and gastric acid hypersecretion (Table 1). The severity of these symptoms would probably also depend on the AG/UAG ratio. This complete syndrome has not been described in a patient to date, while tumor ghrelin immunoreactivity occurs frequently in neuroendocrine tumors (NETs) and in a small number of patients elevated plasma ghrelin levels have been found.


Expression of ghrelin protein and/or mRNA has been detected in a high percentage of gastric, intestinal and pancreatic NETs. Gastric NETs are regarded to derive from Enterochromaffin-Like (ECL) cells. They are classified as type 1 if they are associated with atrophic gastritis. Type 2 gastric NETs are associated with a gastrin-producing neuroendocrine tumors (Zollinger-Ellison syndrome) and type 3 gastric NETs are sporadic (15). Ghrelin expression is lacking in ECL cells in physiological conditions (2), but in gastric NETs ghrelin is frequently expressed. Rindi and colleagues used immunohistochemistry to identify the ghrelin peptide in 86% of type 1, 67% of type 2, and 50% of type 3 gastric NETs (16). Also, high ghrelin expression can be observed within neuroendocrine hyperplasia of the stomach (associated with type 1 and 2 NETs). Despite the expression of ghrelin, these hyperplastic neuroendocrine cells are currently still regarded to derive from ECL cells as they display VMAT2 immunoreactivity, which is a specific marker for ECL cells (17). It is hypothesized that ECL cells secrete ghrelin in proliferative states, potentially under the influence of gastrin.


In the same study, eight intestinal NETs didn’t express ghrelin immunohistochemically. Similar findings were reported by Papotti and colleagues, but they additionally detected ghrelin mRNA in 72% of intestinal carcinoids through in situhybridization (18). These intestinal NETs were mostly negative for IHC suggesting that lower concentrations of ghrelin might be present, although below the detection limit of IHC or translation is absent. In pancreatic NETs, around 40% of tumors showed ghrelin immunoreactivity, whilst in situ hybridization revealed ghrelin mRNA in 68% of pNET, including non-functioning pNET, insulinoma, glucagonoma, and VIPoma (19,20). Normal pancreatic islet cells have also been demonstrated to express ghrelin peptide. The co-expression of ghrelin in a variety of NETs may also represent the common stem cell origin of the different enteroendocrine cell types (5).


Actual elevated plasma ghrelin levels in patients with a NET have only sporadically been measured (Table 2). In a study screening 26 patients with pNETs, mean plasma total ghrelin levels were similar between patients and healthy controls (20). However, plasma total ghrelin levels were elevated in a subset of 5 patients. These patients did not display features of acromegaly and mean body mass index of patients with hyperghrelinemia was similar to patients with normal ghrelin levels. Three other studies reported hyperghrelinemia in NET patients at a lower incidence of around 3% (total or acylated ghrelin; Table 2) (21-23). All patients with hyperghrelinemia had non-specific symptoms without evidence of GH excess or hyperglycemia. Again, mean plasma total ghrelin levels were similar in NET patients compared to controls and therefore ghrelin was found to be a poor screening tool for NETs (21,22).


Table 2. Plasma Ghrelin Levels in Patients with Neuroendocrine Tumors


Patients screened

Mean total plasma ghrelin NET

Mean total plasma ghrelin controls

pvalue

Elevated ghrelin (number of patients, %)

Hyperghrelinemia: tumor type

Ekeblad (20)

pNET (n=26)

908 ng/L

952 ng/L

N.S.

5 (19.2%)

- pNET (n=2)

- glucagonoma (n=1)

- gastrinoma (n=2)

Corbetta

(21)

pNET (n=24)

siNET (n=10)

gastric NET (n=6)

182 pmol/L

329 pmol/L

N.S.

1 (2.5%)

- pNET

Van Adrichem (22)

pNET (n=3)

siNET (n=19)

other (n=6)

62.9 pg/ml*

57.2 pg/ml*

p=0.66

1 (3.6%)

- siNET

Walter (23)

pNET (n=27)

siNET (n=33)

other (n=12)

NA

NA

NA

3 (4.2%)

- pNET

- rectal NET

- gallbladder NET

*median acylated ghrelin. Abbreviations: N.S: Not significant; pNET: pancreatic neuroendocrine tumor; siNET: small intestinal neuroendocrine tumor.

Lastly, elevated ghrelin levels have been reported in three case reports. The first patient was a 60-year-old male, presenting with abdominal pain, weight loss, flushing and fatigue. There were no signs of diabetes mellitus or acromegaly. After being treated with a somatostatin analogue for four years and three cycles of temozolomide/capecitabine an elevated plasma total ghrelin level was measured. Four months later the patient developed symptomatic endogenous hyperinsulinism and passed away another four months later (24). A second patient with a presacral NET was also diagnosed with a ghrelinoma based on elevated plasma total ghrelin levels (25). Symptoms included back pain and intermittent attacks of weakness, shivering, tachycardia, numbness and profuse perspiration. While AG levels were stable through the course of the disease total ghrelin levels increased tenfold when the NET progressed. A third case report described a patient with a gastric NET with elevated total and acylated ghrelin. This patient reported frequent diarrhea and night sweats. During follow-up patient developed new-onset diabetes in the presence of normal IGF-1 levels (26).


In conclusion, while co-expression of ghrelin is a relative frequent finding in NETs, actual elevated plasma ghrelin levels has been described in small numbers of patients. The non-specific symptoms of a majority patients suggest limited biological activity of these elevated ghrelin levels, possibly related to the UAG/AG ratio. At this time the clinical relevance of hyperghrelinemenia for NETs remains limited.


REFERENCES


  1. Kojima M, Hosoda H, Date Y, Nakazato M, Matsuo H, Kangawa K. Ghrelin is a growth-hormone-releasing acylated peptide from stomach. Nature. 1999;402(6762):656-660.
  2. Date Y, Kojima M, Hosoda H, Sawaguchi A, Mondal MS, Suganuma T, Matsukura S, Kangawa K, Nakazato M. Ghrelin, a novel growth hormone-releasing acylated peptide, is synthesized in a distinct endocrine cell type in the gastrointestinal tracts of rats and humans. Endocrinology. 2000;141(11):4255-4261.
  3. Gnanapavan S, Kola B, Bustin SA, Morris DG, McGee P, Fairclough P, Bhattacharya S, Carpenter R, Grossman AB, Korbonits M. The tissue distribution of the mRNA of ghrelin and subtypes of its receptor, GHS-R, in humans. J Clin Endocrinol Metab. 2002;87(6):2988.
  4. Kojima M, Hosoda H, Kangawa K. Purification and distribution of ghrelin: the natural endogenous ligand for the growth hormone secretagogue receptor. Horm Res. 2001;56 Suppl 1:93-97.
  5. Beumer J, Gehart H, Clevers H. Enteroendocrine Dynamics - New Tools Reveal Hormonal Plasticity in the Gut. Endocr Rev. 2020;41(5).
  6. Cowley MA, Smith RG, Diano S, Tschop M, Pronchuk N, Grove KL, Strasburger CJ, Bidlingmaier M, Esterman M, Heiman ML, Garcia-Segura LM, Nillni EA, Mendez P, Low MJ, Sotonyi P, Friedman JM, Liu H, Pinto S, Colmers WF, Cone RD, Horvath TL. The distribution and mechanism of action of ghrelin in the CNS demonstrates a novel hypothalamic circuit regulating energy homeostasis. Neuron. 2003;37(4):649-661.
  7. Tong J, Dave N, Mugundu GM, Davis HW, Gaylinn BD, Thorner MO, Tschop MH, D'Alessio D, Desai PB. The pharmacokinetics of acyl, des-acyl, and total ghrelin in healthy human subjects. Eur J Endocrinol. 2013;168(6):821-828.
  8. Banks WA, Tschop M, Robinson SM, Heiman ML. Extent and direction of ghrelin transport across the blood-brain barrier is determined by its unique primary structure. J Pharmacol Exp Ther. 2002;302(2):822-827.
  9. Takaya K, Ariyasu H, Kanamoto N, Iwakura H, Yoshimoto A, Harada M, Mori K, Komatsu Y, Usui T, Shimatsu A, Ogawa Y, Hosoda K, Akamizu T, Kojima M, Kangawa K, Nakao K. Ghrelin strongly stimulates growth hormone release in humans. J Clin Endocrinol Metab. 2000;85(12):4908-4911.
  10. Delhanty PJ, Neggers SJ, van der Lely AJ. Des-acyl ghrelin: a metabolically active peptide. Endocr Dev. 2013;25:112-121.
  11. Masuda Y, Tanaka T, Inomata N, Ohnuma N, Tanaka S, Itoh Z, Hosoda H, Kojima M, Kangawa K. Ghrelin stimulates gastric acid secretion and motility in rats. Biochem Biophys Res Commun. 2000;276(3):905-908.
  12. Nakazato M, Murakami N, Date Y, Kojima M, Matsuo H, Kangawa K, Matsukura S. A role for ghrelin in the central regulation of feeding. Nature. 2001;409(6817):194-198.
  13. Tschop M, Smiley DL, Heiman ML. Ghrelin induces adiposity in rodents. Nature. 2000;407(6806):908-913.
  14. Nagaya N, Kojima M, Uematsu M, Yamagishi M, Hosoda H, Oya H, Hayashi Y, Kangawa K. Hemodynamic and hormonal effects of human ghrelin in healthy volunteers. Am J Physiol Regul Integr Comp Physiol. 2001;280(5):R1483-1487.
  15. Delle Fave G, O'Toole D, Sundin A, Taal B, Ferolla P, Ramage JK, Ferone D, Ito T, Weber W, Zheng-Pei Z, De Herder WW, Pascher A, Ruszniewski P, all other Vienna Consensus Conference p. ENETS Consensus Guidelines Update for Gastroduodenal Neuroendocrine Neoplasms. Neuroendocrinology. 2016;103(2):119-124.
  16. Rindi G, Savio A, Torsello A, Zoli M, Locatelli V, Cocchi D, Paolotti D, Solcia E. Ghrelin expression in gut endocrine growths. Histochem Cell Biol. 2002;117(6):521-525.
  17. Srivastava A, Kamath A, Barry SA, Dayal Y. Ghrelin expression in hyperplastic and neoplastic proliferations of the enterochromaffin-like (ECL) cells. Endocr Pathol. 2004;15(1):47-54.
  18. Papotti M, Cassoni P, Volante M, Deghenghi R, Muccioli G, Ghigo E. Ghrelin-producing endocrine tumors of the stomach and intestine. J Clin Endocrinol Metab. 2001;86(10):5052-5059.
  19. Volante M, Allia E, Gugliotta P, Funaro A, Broglio F, Deghenghi R, Muccioli G, Ghigo E, Papotti M. Expression of ghrelin and of the GH secretagogue receptor by pancreatic islet cells and related endocrine tumors. J Clin Endocrinol Metab. 2002;87(3):1300-1308.
  20. Ekeblad S, Lejonklou MH, Grimfjard P, Johansson T, Eriksson B, Grimelius L, Stridsberg M, Stalberg P, Skogseid B. Co-expression of ghrelin and its receptor in pancreatic endocrine tumours. Clin Endocrinol (Oxf). 2007;66(1):115-122.
  21. Corbetta S, Peracchi M, Cappiello V, Lania A, Lauri E, Vago L, Beck-Peccoz P, Spada A. Circulating ghrelin levels in patients with pancreatic and gastrointestinal neuroendocrine tumors: identification of one pancreatic ghrelinoma. J Clin Endocrinol Metab. 2003;88(7):3117-3120.
  22. van Adrichem RC, van der Lely AJ, Huisman M, Kramer P, Feelders RA, Delhanty PJ, de Herder WW. Plasma acylated and plasma unacylated ghrelin: useful new biomarkers in patients with neuroendocrine tumors? Endocr Connect. 2016;5(4):143-151.
  23. Walter T, Chardon L, Hervieu V, Cohen R, Chayvialle JA, Scoazec JY, Lombard-Bohas C. Major hyperghrelinemia in advanced well-differentiated neuroendocrine carcinomas: report of three cases. Eur J Endocrinol. 2009;161(4):639-645.
  24. Chauhan A, Ramirez RA, Stevens MA, Burns LA, Woltering EA. Transition of a pancreatic neuroendocrine tumor from ghrelinoma to insulinoma: a case report. J Gastrointest Oncol. 2015;6(2):E34-36.
  25. Falkmer UG, Gustafsson T, Wenzel R, Wierup N, Sundler F, Kulkarni H, Baum RP, Falkmer SE. Malignant presacral ghrelinoma with long-standing hyperghrelinaemia. Ups J Med Sci. 2015;120(4):299-304.
  26. Tsolakis AV, Portela-Gomes GM, Stridsberg M, Grimelius L, Sundin A, Eriksson BK, Oberg KE, Janson ET. Malignant gastric ghrelinoma with hyperghrelinemia. J Clin Endocrinol Metab. 2004;89(8):3739-3744.
  27. Motta G, Allasia S, Zavattaro M, Ghigo E, Lanfranco F. Natural and Synthetic Growth Hormone Secretagogues☆. In: Huhtaniemi I, Martini L, eds. Encyclopedia of Endocrine Diseases (Second Edition). Oxford: Academic Press; 2018:127-141.