Archives

Disorders in The Action of Vitamin D

ABSTRACT


Vitamin D is produced in the skin under the influence of UVB portion of the light spectrum in sunlight. This form of vitamin D is cholecalciferol or vitamin D3. Vitamin D may also be part of the diet either in certain foods such as fatty fish or as supplements either ingested separately or in supplemented food such as milk. Such supplements can be either vitamin D3 or vitamin D2, the form produced in plants from UVB radiation of ergosterol. For the purposes of this chapter, we will make no distinction between these forms of vitamin D, although the differences in the side chain (double bond at C22-23 and methyl group at C24 of vitamin D2) do alter both the binding of vitamin D2 to vitamin D binding protein (DBP) and the metabolism of vitamin D2. Vitamin D then must be metabolized to its most active form, 1,25 dihydroxyvitamin D (1,25(OH)2D), by a series of steps involving first the conversion to 25 hydroxyvitamin D (25OHD), the principal circulating form of vitamin D, principally by the enzyme CYP2R1 in the liver, then to 1,25(OH)2D principally in the kidney by the enzyme CYP27B1. That said there are a number of enzymes with 25-hydroxylase activity found in a number of tissues, and although CYP27B1 is essentially the only 1-hydroxylase, this enzyme is found in numerous tissues where it is thought to play primarily a paracrine/autocrine role. Putting a check to the production of 25OHD and 1,25(OH)2D is the 24-hydroxylase CYP24A1, that metabolizes both 25OHD and 1,25(OH)2D to inactive products. Like CYP27B1, CYP24A1 is widely distributed. Vitamin D and its metabolites are carried in blood tightly bound to DBP, such that only a small fraction (<1%) is free to enter most cells unless those cells express the megalin/cubilin complex which facilitates the transport of the DBP bound metabolites into the cell. DBP is produced in the liver, and its levels can vary in patients with limited hepatic synthetic capacity. Moreover, DBP is an acute phase reactant so a variety of conditions can alter DBP levels and thus the measurement of vitamin D and its metabolites.  1,25(OH)2D is the major ligand for the vitamin D receptor (VDR), a nuclear transcription factor found in most if not all cells of the body and known to regulate thousands of genes in a cell specific manner.  Although numerous physiologic functions have been attributed to vitamin D and its metabolites, clinically its major action is to control the availability of calcium and phosphate from the diet for the proper mineralization of the skeleton. Thus, disorders in vitamin D availability, metabolism, and action manifest first and foremost in the skeleton that when severe result in rickets in growing children and osteomalacia in adults in whom the growth plates have closed. After a brief review of vitamin D metabolism and molecular mechanisms of action this chapter will describe the pathologic changes in bone when the supply of mineral to bone is inadequate due to disorders in vitamin D action whether from dietary deficiency, metabolism, or mechanism of action. We will then look in depth at the causes of vitamin D deficiency including mutations resulting in altered metabolism, then discuss the range of effects different mutations in the VDR have on its function including the example of alopecia, which is best known function of VDR that is independent of its ligand 1,25(OH)2D.


INTRODUCTION


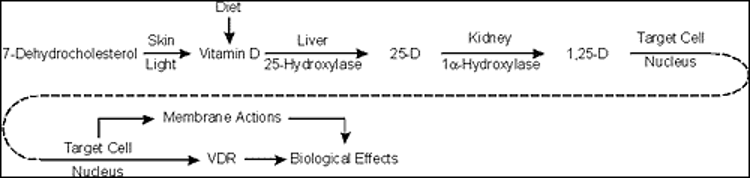
Vitamin D derived from endogenous production in the skin or absorbed from the gut is transformed into its active form by two successive steps: hydroxylation in the liver to 25-hydroxyvitamin D [25(OH)D] primarily by the enzyme CYP2R1 followed by 1a-hydroxylation in the renal proximal tubule to 1,25-dihydroxyvitamin D (1,25(OH)2D-calcitriol) by the enzyme CYP27B. Other cells exhibit 1α-hydroxylase activity including placental decidual cells, epithelial cells including keratinocytes, macrophages, dendritic cells, parathyroid cells, and some tumor cells. The role of the extrarenal production of 1,25(OH)2D is thought to play a paracrine and/or autocrine function and under normal conditions does not significantly contribute to the circulating levels of the hormone. Hydroxylation at carbon 24 to produce 24,25-dihydroxyvitamin D [24,25(OH)2D] or 1,24,25-trihydroxyvitamin D by the enzyme CYP24A1 is performed in a wide range of normal tissues and is believed to be important in the removal of vitamin D metabolites. CYP27B1 and CYP24A1 are mitochondrial mixed function oxidase containing cytochrome P450 with ferredoxin and heme-binding domains whereas CYP2R1 is likewise a P450 mixed function oxidase in the microsomes. The sequences of these genes are known contributing to an understanding of the mutations that affect their function (1-9).


The 25-hydroxylation of vitamin D has been thought to be primarily substrate dependent but recently studies found that it is under metabolic control (10). Obesity induced by a high fat diet reduces the levels of hepatic CYP2R1 leading to reduced levels of 25OHD (11). CYP27B1 is stringently regulated by parathyroid hormone (PTH) through a cAMP mediated pathway; calcitonin in a different region of the proximal tubule, apparently not via a rise in cAMP; 1,25(OH)2D through its receptor; calcium in part via its regulation of PTH and by phosphorus mainly via Fibroblast Growth Factor 23 (FGF-23) production in osteocytes and osteoblasts. Of these the stimulation by PTH and inhibition by FGF23 and 1,25(OH)2D are best studied and likely the dominant regulators. CYP24A1is likewise regulated by PTH and FGF23 but opposite to that of CYP27B1 and is markedly induced by 1,25(OH)2D. All vitamin D metabolites are fat soluble and circulate principally bound to vitamin D binding protein (DBP), an a-globulin produced primarily in the liver. Most of the body pool of vitamin D is in the body fat while only a small fraction of the pools of 25(OH)D or 1,25(OH)2D are in fat. Normal daily turnover of vitamin D and 25(OH)D are approximately 30 and 15 mg per day respectively with 1,25(OH)2D daily production about 1 mg. The fractional conversion of vitamin D to 1,25(OH)2D is much higher in vitamin D deficient states. It is difficult to measure vitamin D in blood. Circulating vitamin D metabolites measured in clinical practice are 25(OH)D and 1,25(OH)2D. As 25(OH)D synthesis is primarily substrate dependent, serum levels of this metabolite are taken as a measure of vitamin D status.  


1,25(OH)2D biologic actions are mediated via a high-affinity intracellular vitamin D receptor (VDR). VDR acts as a ligand-modulated transcription factor that belongs to the steroid, thyroid, and retinoic acid receptors gene family (12-15). VDR is found in most if not all tissues, leading to the increased recognition of multiple target organs and actions of the hormone. However, the degree to which vitamin D impacts physiologic processes outside the musculoskeletal system remains a subject of substantial investigation and controversy.


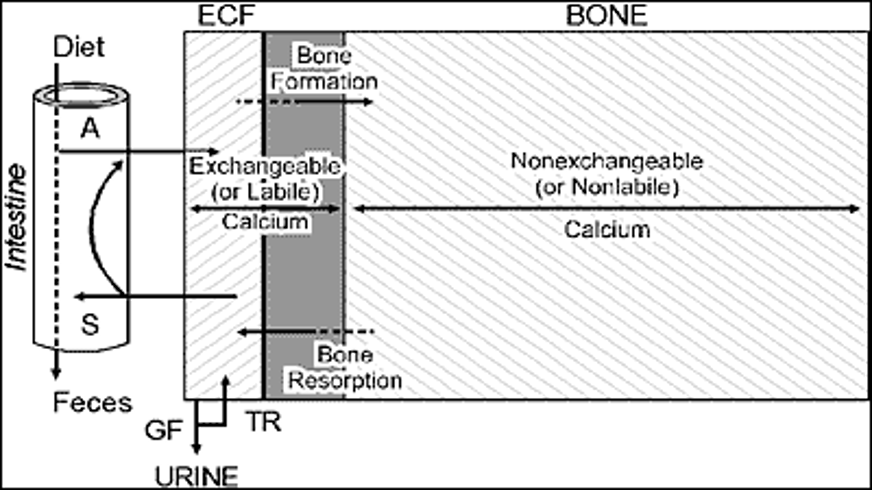
1,25(OH)2D is the most powerful physiological agent that stimulates active transport of calcium, and to a lesser degree phosphorus and magnesium, across the small intestine (16,17). Thus, disorders in vitamin D action will lead to a decrease in the net flux of mineral to the extracellular compartment causing hypocalcemia and secondary hyperparathyroidism. Hypophosphatemia will also ensue, as a result of both increased renal phosphate clearance due to secondary hyperparathyroidism and reduced absorption of phosphorus due to deficient 1,25(OH)2D action on the gut. Low concentrations of calcium and phosphorus in the extracellular fluid will lead to defective mineralization of organic bone matrix. Defective bone matrix mineralization of the newly formed bone and growth plate cartilage will produce the characteristic morphological and clinical signs of rickets, while at sites of bone remodeling, it will cause osteomalacia. Disorders in vitamin D action may impair the differentiation of osteoblasts and thus their functional capacity to mineralize bone matrix; this may be an additional mechanism of minor importance that contributes to rickets and osteomalacia (18,19). Continuous bone remodeling takes place in the growing skeleton, thus children with rickets will have osteomalacia as well. The clinical term used in this chapter to describe defective bone matrix mineralization in general will be rickets and/or osteomalacia.


Mineralization of the newly formed organic matrix of bone is a complex and highly ordered process. The essential components for normal mineralization include appropriate extracellular concentrations of calcium, phosphorous and normal functions of the bone forming cells. Disturbances in any of these components will lead to a stereotypic response of disturbed mineralization. The histological, radiological and most of the clinical features characteristic of rickets and/or osteomalacia will be the same regardless of the primary disorder. Thus, defective bone matrix mineralization can be caused by: a) calcium deficiency (20) (e.g. a rare nutritional deficiency of the element seen primarily in children or the more common form of calcium deficiency secondary to disorders of vitamin D metabolism); b) phosphorous deficiency (e.g. increased renal phosphate clearance as in X-linked hypophosphatemia (for detailed discussion see Endotext chapter entitled Primary Disorders of Phosphate Metabolism); c) primary defects in local bone processes (e.g. hypophosphatasia).


Serum concentrations of calcium, phosphorous, PTH, 25(OH)D, biochemical markers of bone turnover and 24 hour urinary calcium excretion will differentiate among the different primary disturbances leading to defective bone matrix mineralization (Table 1).


Table 1. Biochemical Parameters of Mineral and Bone Metabolism in Patients with Rickets and/or Osteomalacia, by Etiology


Serum levels

24h urinary calcium excretion

Etiology

Calcium

Phosphorous

iPTH

Bone specific alk.phos*


Hypocalcemic e.g., vitamin D deficiency

Low to low normal

Low

Elevated

Elevated

Low

Hypophosphatemic e.g., X-linked hypophosphatemia

Normal

Low

Normal to
low normal

Elevated

Low to elevated

Primary defects in bone e.g., hypophosphatasia

Normal

Normal

Normal

Low

Normal

* Alk. phos. alkaline phosphatase activity


This chapter will deal with hypocalcemic rickets and/or osteomalacia. A primary calcium deficiency state due to extremely low calcium intake was reported in growing children (20) but is very uncommon. Thus, the discussion will concentrate on calcium deficiency secondary to disorders in vitamin D action. Such disorders can be due to disturbances along the cascade of 1,25(OH)2D synthesis leading to a deficiency of the hormonal form of the vitamin (vitamin D deficiency states) or defects in the interaction of 1,25(OH)2D and its target tissues (resistance to 1,25(OH)2D).


As all disorders in vitamin D action will lead to the same clinical, radiological, histological, and most of the biochemical aberrations, those common features will be discussed first.


CLINICAL AND RADIOLOGICAL FEATURES OF RICKETS AND OSTEOMALACIA


The clinical features of rickets due to disorders in vitamin D action are weakness, bone pain, bone deformity, and fracture. The most rapidly growing bones show the most striking abnormalities. Thus, the localization and severity of the clinical features will depend on the age of onset. In children with acquired disorders in vitamin D action, signs and symptoms of rickets will vary with the age in which the deficiency is being manifested. Children with hereditary disorders of vitamin D action will appear normal at birth as calcium and phosphorous levels in fetal plasma are sustained by placental transport from maternal plasma that is not regulated by the fetal vitamin D system. These children usually develop the characteristic features of rickets within the first 2 years of life. Defects in bone mineralization are particularly evident in regions of rapid bone growth, including, during the first year of life, the cranium, wrist, and ribs. Rickets at this time will lead to widened cranial sutures, frontal bossing, posterior flattening of the skull (craniotabes), widening of the wrists, bulging of costochondral junction (rachitic rosary), and indentation of the ribs at the diaphragmatic insertion (Harrison’s groove). The rib cage may be so deformed that it contributes to respiratory failure. Dental eruption is delayed, and teeth show enamel hypoplasia. Muscle weakness and hypotonia are severe and result in a protuberant abdomen, that may contribute to respiratory failure, and may result in the inability to walk without support. After the first year of life with the acquisition of erect posture and rapid linear growth, the deformities are most severe in the legs. Bow legs (genu varum) or knock-knee (genu valgum) deformities of various severity develop as well as widening of the end of long bones. If not treated, rickets may cause severe lasting deformities, compromise adult height, and increase susceptibility to pathological fractures (Figure 1).


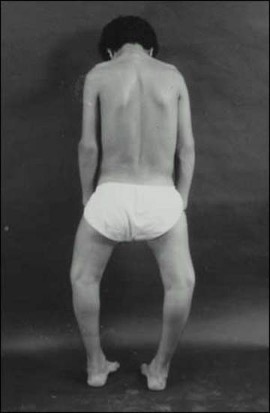
Figure 1. Teenage male with rickets. Note deformities of legs (bow legs) and compromised height.


The specific radiographic features of rickets reflect the failure of cartilage calcification and endochondral ossification and therefore are best seen in the metaphysis of rapidly growing bones (Figures 2 and 3). The metaphyses are widened, uneven, concave, or cupped and because of the delay in or absence of calcification, the metaphyses could become partially or totally invisible on x-ray. In more severe forms or in patients untreated for prolonged periods, rarefaction and thinning of the cortex of the entire shaft, sparse bone trabecularization, and bone deformities will become evident. Greenstick fractures may appear as well.


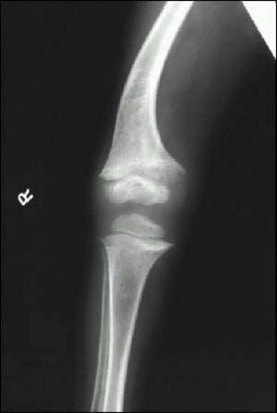
Figure 2. Radiograph of distal femur and proximal tibia and fibula of a patient with rickets. Note widening of epiphysis, resorption of provisional zone of calcification, flaring of metaphysis and bone deformity.

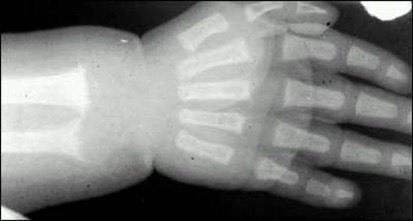
Figure 3. Radiograph of the wrist and hand of a patient with rickets. Note scalloping, widening and irregularity of metaphyseal end of the ulna; apparent widening of the joint space as a result of absence of epiphyseal provisional calcification.


The clinical features of osteomalacia in adults are subtle and could be manifested as bone pain or low back pain of varying severity in some cases. Severe muscle weakness and hypotonia may be a prominent feature in adults with vitamin D deficiency. Improvement of myopathy occurs after low doses of vitamin D.  


The first clinical presentation could be an acute fracture of the long bones, pubic ramii, ribs, or spine. The radiographic manifestations could be mild, e.g., generalized, nonspecific osteopenia or more specific, such as pseudofractures, commonly seen at the medial edges of the shafts of long bones (Figure 4).


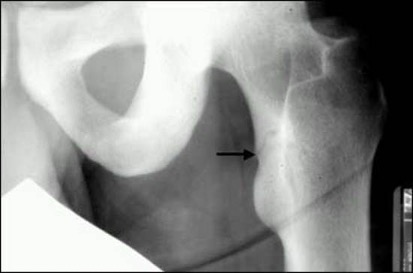
Figure 4. Young male with osteomalacia. Note a pseudofracture in the medial edge of the upper femoral shaft (arrow).


In hypocalcemic rickets and/or osteomalacia, as is the case in disorders in vitamin D action, there may exist radiographic features of secondary hyperparathyroidism such as subperiosteal resorption and cysts of the long bones.


HISTOLOGICAL FEATURES OF RICKETS AND OSTEOMALACIA


The characteristic histological feature of rickets and osteomalacia is deficiency or lack of mineralization of the organic matrix of bone. Osteomalacia is defined as excess osteoid (hyperosteoidosis) and a quantitative dynamic proof of defective bone matrix mineralization obtained by analysis of time-spaced tetracycline labeling (21,22).


Bone Biopsy and Bone Histomorphometry


GENERAL


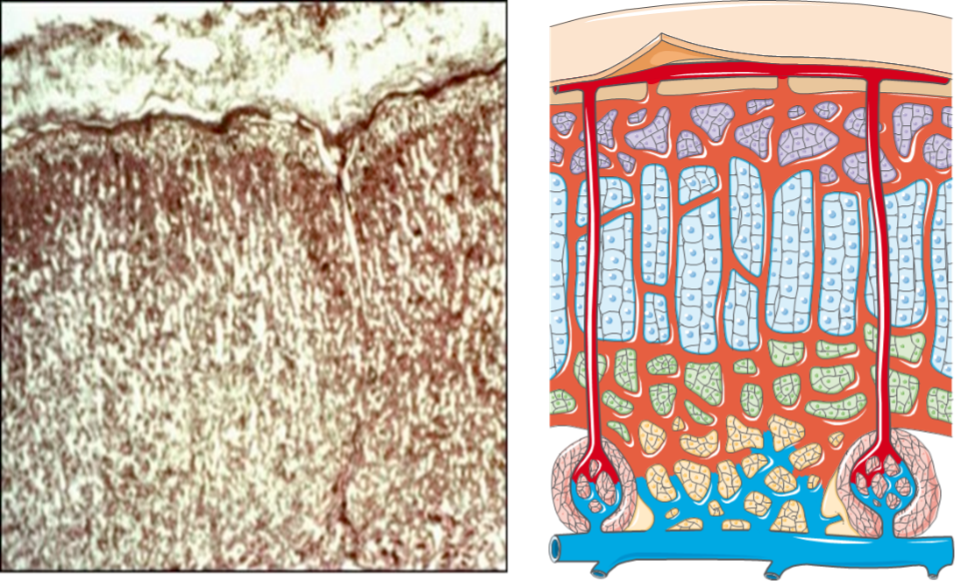
Transiliac bone biopsy is taken at a standard location: 2cm behind the antero-superior iliac spine and just below the crest, with a terpine 7.5mm inner diameter or 5mm for children. The biopsy should contain the inner and outer cortex and intact trabecular bone in between. Double tetracycline labeling is performed by giving the drug: e.g., dimethyl-chlortetracycline 1g/day in two divided doses, for 2 days, followed by a second administration typically of a different tetracycline with different fluorescent color after 10 to 14 days of drug free interval. The bone biopsy is performed 5 to 7 days following the last dose of tetracycline. The biopsy is sectioned undecalcified and is evaluated unstained or with different stains and techniques to obtain qualitative and quantitative histomorphometric parameters (Figure 5). The following are the commonly used quantitative histomorphometric parameters (22): trabecular bone volume (BV/TV), osteoid volume (OV/BV), osteoid surface (OS/BS), osteoid thickness (O. Th), osteoblast surface (Ob.s/BS), osteoclast surface (Oc.S/BS), osteoclast number (N.Oc/TA), double labeled surface (dLS/BS), single labeled surface (sLS/BS), mineral appositional rate (MAR), bone formation rate (BFR/BS), and mineralization lag time (MLT).


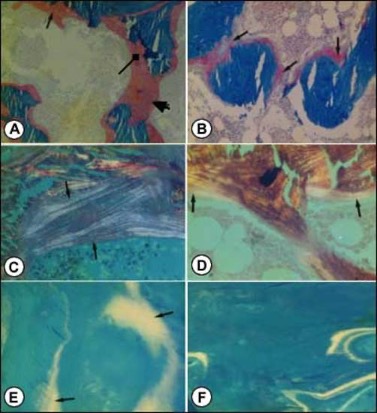
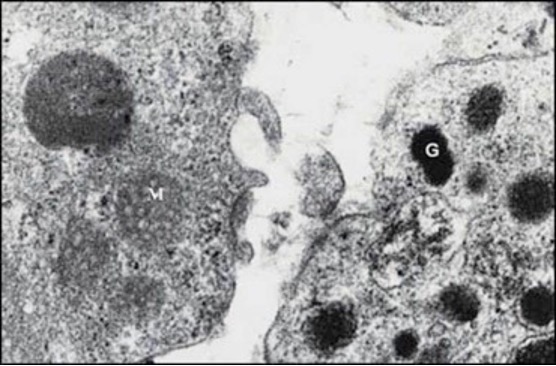
Figure 5. Photomicrographs of transilial bone biopsies of patients with rickets and osteomalacia (A, C and E) and siblings without bone disease (B, D and F) (Courtesy of Drs. D. Gazit and I.A. Bab). A and B: Modified Mason stain; magnification x130. Note in A: broad osteoid seams (arrow), osteoid trabeculae (heavy arrow) and irregular mineralization front (rectangular arrow).C and D: Polarized light; Von Kossa toluidine blue stain; magnification x360. Note in C: increased number of osteoid lamellae (arrows). E and F: Fluorescent photomicrograph, unstained; magnification x200. Note in E wide fluorescent bands (arrows), no double or single tetracycline labels and ground glass appearance.


OSTEOMALACIA


Histologically patients with osteomalacia with or without rickets will represent an abundance of unmineralized matrix, sometimes to the extent that whole trabeculae appear to be composed of only osteoid (Figure 5A). This will be depicted by quantitative histomorphometry as increases in osteoid volume, surface and thickness (OV/BV, OS/BS and O.TH). However, hyperosteoidosis could be observed in a number of bone diseases with a high turnover. The osteomalacic nature of the hyperosteoidosis is being demonstrated by defective mineralization; irregularity of mineralization fronts (Figure 5A); high number of osteoid lamellae (Figure 5C); broad single tetracycline fluorescent labels (Figure 5E) or no label at all, in contrast to the normal double tetracycline fluorescent labels (Figure5F). These qualitative observations have to be supported by the unequivocal changes in quantitative histomorphometry, i.e., decreases in a double and single tetracycline labeled surface (dLS/BS and sLS/BS) and in mineral apposition rate (MAR) as well as prolongation of mineralization lag time (MLT).


BIOCHEMICAL FEATURES OF RICKETS AND OSTEOMALACIA


The biochemical parameters characterizing disorders in vitamin D action can be divided into those associated with vitamin D status, the primary disturbance in mineral homeostasis and the respective compensatory mechanisms, and changes in bone metabolism. Changes in mineral and bone metabolism will be similar in all states of disorders in vitamin D action, while serum levels of vitamin D metabolites will characterize each of the classes delineated in the introduction (Table 2).


Table 2. Serum Levels of Vitamin D Metabolites in Patients with Disorders in Vitamin D Action, by Etiology


Serum levels

*Etiology

25(OH)D

1,25(OH)2D

Vitamin D deficiency

Low

Low to normal

1,25(OH)2D deficiency

Normal to elevated

Very low

Resistance to 1,25(OH)2D

Normal to elevated

Markedly elevated

* See section on Definitions and Terminology


As previously discussed, disorders in vitamin D action will lead to hypocalcemia and secondary hyperparathyroidism. Thus, the characteristic biochemical features are low to low-normal concentrations of serum calcium (depending on compensatory parathyroid activity), low urinary calcium excretion, hypophosphatemia, increased serum immunoreactive parathyroid hormone (iPTH) levels, increased urinary cyclic AMP excretion, and decreased tubular reabsorption of phosphate (the last two measures reflecting the biological activity of elevated iPTH). Biochemical markers associated with increased osteoid production as bone specific alkaline phosphatase and osteocalcin will be elevated in states of rickets and osteomalacia (23).


DEFINITIONS AND TERMINOLOGY


Terminology applied to disorders in vitamin D action has led to much confusion. This is principally because the terms were coined prior to our detailed understanding of vitamin D metabolism and mechanism of action. The following will define and clarify the terms deficiency and resistant and point to the limitations and ambiguity of these terms as being currently used as well as additional widely used terms such as pseudodeficiency and dependency.


Deficiency States


It is important to specify the localization of a defect as precisely as possible. The description of a deficiency state should indicate the most proximal metabolite in the vitamin D biosynthetic pathway that is deficient, emphasizing, if possible, that the concentrations of the immediate precursor of the metabolite specified are normal. For example, low serum levels of 1,25(OH)2D could be the end result of vitamin D deficiency or defects in the activity of the renal tubular enzyme 25 (OH)D1α-hydroxylase. Only in the latter case will it be appropriate to define it as calcitriol deficiency. Based on our current understanding of vitamin D biosynthesis, three states of deficiency could be envisioned involving the major metabolites: vitamin D, 25 (OH) D, and 1,25(OH)2D. As mentioned, before it is difficult to measure vitamin D in blood. Thus, in clinical practice the diagnosis of vitamin D deficiency states is usually established by measurements of serum 25(OH)D levels. 25(OH)D measurements as a marker of vitamin D status is due to relatively long half-life of 25(OH)D and levels in the blood relative to vitamin D plus a conversion of vitamin D to 25(OH)D that has been regarded as not tightly regulated. That said, recent findings indicate that CYP2R1, the major hepatic 25-hydroxylase, is influenced by disorders in metabolism (10) such as the negative impact of obesity induced by a diet high in fat on CYP2R1 expression. (24). Moreover, mutations in CYP2R1 have also been described leading to osteomalacia accompanied by low 25(OH)D but generally normal 1,25(OH)2D (25).


Based on the commonly available measurement of only two vitamin D metabolites, two deficiency states could be defined in clinical practice: low serum 25(OH) levels implying vitamin D and/or 25(OH)D deficiency, but referred mainly to define a vitamin D deficiency with the limitations mentioned above; and calcitriol deficiency, based on low 1,25(OH)2D and normal or high 25(OH)D serum levels (Table 2).


In theory, the pathogenic mechanism leading to deficiency of any of these metabolites could be categorized to either defective synthesis or increased clearance, with the exception of the parent vitamin D in which the additional possibility of deficient intake has to be taken into account. Each category: deficient synthesis or increased clearance could have a hereditary or acquired etiology and each subcategory could be further divided into simple (implying that the defect is localized only to vitamin D metabolism) or complex (implying that the defect is a part of a more generalized disturbance affecting other metabolic pathways).


To demonstrate the practical use and usefulness of the terminology, the following are some examples. Calcitriol deficiency could be caused by hereditary or acquired defects of the renal tubular enzyme 25(OH)D 1α-hydroxylase. If a hereditary defect involves only the vitamin D metabolic pathway it will be termed simple hereditary calcitriol deficiency. If the defect is a part of a more generalized hereditary disturbance, involving other metabolic pathways as well, e.g., Fanconi syndrome, renal tubular acidosis, X-linked hypophosphatemic rickets, or all states of increased FGF-23 secretion, the disorder will be defined as a complex hereditary 1,25(OH)2D deficiency. Decreased calcitriol synthesis could be caused by acquired diseases that usually affect additional metabolic pathways, e.g., chronic renal failure, hypoparathyroidism, tumor induced osteomalacia, thus the appropriate term will be complex acquired 1,25(OH)2D deficiency due to defective synthesis. Some drugs as barbiturates and the antiepileptic-hydantoin may affect the liver cytochrome P450 enzyme system and increase vitamin D catabolism. It may accelerate vitamin D deficiency usually in patients that have vitamin D insufficiency. Such disturbances will be termed complex acquired vitamin D deficiency due to increased clearance. Intestinal malabsorption either hereditary or acquired interferes with the absorption and enterohepatic recirculation of vitamin D and its metabolites and thus may lead to complex hereditary or acquired vitamin D deficiency due to decreased input. In the skin the substrate for vitamin D, 7-dehydrocholesterol, (7-DHC), is on the Kandutsch-Russell pathway of cholesterol synthesis with the last step of conversion of 7-DHC to cholesterol being performed by 7-DHC reductase (DHCR7). Mutations of this enzyme including polymorphisms as well a number metabolites including vitamin D and cholesterol regulate this enzyme thus also providing for complex hereditary of acquired alterations in vitamin D availability due to changes in its precursor 7-DHC (25).


Resistant States


Resistance to a factor may be defined as a state where normal levels of the factor are associated with subnormal bioeffects. This definition has two important determinants, the factor and the bioeffect. In the case of the vitamin D system, the factor can be the parent vitamin D, the 25-hydroxylated metabolite, or calcitriol. Based on vitamin D metabolism and mechanism of action, the term resistance should only be used with the most distal metabolite or the active hormonal form of vitamin D, i.e., 1,25(OH)2D. For example, patients with a renal defect in calcitriol synthesis are resistant to vitamin D or 25(OH)D caused by defective calcitriol production, but have a completely normal response to physiological replacement doses of 1a-hydroxylated vitamin D metabolites.


Several bioeffects in vivo have potential relevance in evaluating states of resistance to 1,25(OH)2D. These include the effects on bone matrix mineralization and the effect on calcium transport through the small intestine. However, as discussed before, rickets and/or osteomalacia are stereotypic responses of the mineralizing bone matrix to a variety of perturbations not all of which are correlated to disturbances in 1,25(OH)2D action. Two clinical examples are presented to clarify this point: a. X-linked hypophosphatemic rickets (XLH) was and still is termed vitamin D resistant rickets. However, the unresponsiveness to vitamin D of the bone disease in XLH is due to the fact that the defective mineralization is caused mainly by phosphorus deficiency though there is some suppression of calcitriol synthesis caused by increased FGF-23 secretion; b. Hereditary hypophosphatemic rickets with hypercalciuria is a disease characterized by defective bone matrix mineralization, low serum phosphorus and elevated serum 1,25(OH)2D levels, taken together, it may look as a resistance to the hormone. However, these patients have increased intestinal absorption of calcium and hypercalciuria. The primary defect in this disease is an isolated defect in a renal phosphate transporter leading to increased renal phosphate clearance, hypophosphatemia, increased 1,25(OH)2D production and the appropriate physiological response i.e., increased intestinal calcium absorption. The rickets and/or osteomalacia are the result of phosphorus deficiency rather than unresponsiveness to calcitriol (for details see Endotext chapter Primary Disorders of Phosphate Metabolism).


There is no doubt about the pivotal role of calcitriol on net calcium transport across the intestinal epithelium. Thus, intestinal calcium absorption measured directly or assessed by secondary changes in serum and urine calcium and iPTH levels can be utilized as a bioeffect in evaluating states of resistance to 1,25(OH)2D. When the defect in bone matrix mineralization is caused by calcium deficiency, rickets and/or osteomalacia could be used as an additional bioeffect to define calcitriol resistance.


Resistance to 1,25(OH)2D is defined here as a state in which normal or high levels of the hormone are associated with hypo-or normocalcemia, secondary hyperparathyroidism, rickets and/or osteomalacia caused by calcium deficiency.


Pseudovitamin D Deficiency and Vitamin D Dependency


The term pseudovitamin D deficiency refers to a state with biochemical and tissue features of vitamin D deficiency (calcium deficiency, secondary hyperparathyroidism, impaired bone matrix mineralization) with no history of vitamin D or calcium deficiency or low serum levels of 25(OH)D. This is an ambiguous term as it includes two different diseases:1,25(OH)2D deficiency and resistance to 1,25(OH)2D, the so-called pseudovitamin D deficiency type I and II respectively, and does not include the known etiology and pathogenesis of these disturbances.


The term vitamin D dependency has been used interchangeably with pseudovitamin D deficiency. It meant to describe patients capable or responding to, and thus dependent on, supraphysiological doses of vitamin D. This is the situation in patients with simple hereditary 1,25(OH)2D deficiency due to defects in the renal enzyme 25(OH)vitamin D 1α-hydroxylase. Patients with this disease have a complete clinical remission on physiological replacement doses of calcitriol. The term vitamin D dependency type II was applied to describe patients with simple hereditary resistance to 1,25(OH)2D due to mutations in the vitamin D receptor (VDR), the majority of whom are unresponsive to any dose of vitamin D or its active metabolites, and therefore are not dependent on vitamin D.


DISORDERS IN VITAMIN D ACTION


Three disorders in vitamin D action will be discussed in this chapter: vitamin D deficiency, mainly simple acquired vitamin D deficiency (i.e., involving only the vitamin D metabolic pathway); simple hereditary 1,25(OH)2D deficiency resulting from defects in calcitriol biosynthesis; simple hereditary resistance to 1,25(OH)2D caused by defects in calcitriol receptor-effector system. While acquired vitamin D deficiency is the most common disorder, the other two rare inborn errors in vitamin D metabolism will be discussed because of its immense contribution to the understanding of vitamin D metabolism and mode of action in human beings.


Vitamin D Deficiency


PATHOGENESIS


Vitamin D deficiency can be caused by decreased input or increased clearance. Decreased input of vitamin D may be the end result of: a) defective intake due to dietary (nutritional) deficiency or intestinal malabsorption; b) deficient photosynthesis of vitamin D in the skin. Increased vitamin D clearance could result from increased catabolism, mainly in the liver, or increased loss via the kidneys or intestine. As discussed, each of these disturbances could be, at least in theory, hereditary or acquired, and further subcategorized as simple (involving only the vitamin D metabolic pathway) or complex (implying a more generalized disturbance). Thus, whenever the diagnosis of vitamin D deficiency is established, there is a need to define the etiology and pathophysiology of the disorder and categorize it accordingly.


Vitamin D deficiency due to increased clearance is relatively uncommon in clinical practice and usually is part of more general diseases (i.e., complex disturbances) e.g., protein losing nephropathy, intestinal malabsorption, and increased liver catabolism sometimes caused by certain drugs (e.g., barbiturates, antiepileptics). The rest of this section will deal with vitamin D deficiency caused by decreased input.


Vitamin D content of various unfortified food substances is very low with the exception of fatty fish such as herring, mackerel, or cod liver oil. It is estimated that under normal unfortified food consumption, less than 20% of the total circulating 25(OH)D is contributed by nutritional vitamin D. In some countries the dietary content of vitamin D is higher due to vitamin D supplementation of some food products. In the United States, milk is being fortified by 400IU per quart. Increased vitamin D intake could result from habitual use of multivitamins that usually contain 400IU of vitamin D per tablet, or some calcium salt preparations that contain vitamin D as well. These supplements will of course increase the relative contribution of dietary vitamin D intake to the total body vitamin D pool in general, and when cutaneous production of vitamin D is limited, in particular.


Gastrointestinal malabsorption will interfere with vitamin D input from the gut and it may affect the enterohepatic recirculation of vitamin D metabolites as well. Thus, intestinal malabsorption may contribute to vitamin D deficiency by decreasing the input and increasing the clearance of the vitamin and its metabolites. Vitamin D deficiency and its clinical and biochemical consequences may be the first sign of occult-malabsorption due, for example, to non-tropical sprue.


Vitamin D synthesis in the skin is produced from 7-DHC under the influence of UV light with a maximal effective wave length between 290-310 nm. Thus, levels of 7-DHC regulated by DHCR7 influences the amount of vitamin D that can be produced.  Cutaneous vitamin D production is also affected by the intensity of the UV light that reaches the body, the surface area of the skin exposed and intrinsic properties of the epidermis. In northern latitudes, during the winter, almost no UV reaches the ground. In the northern parts of the United States, Canada and Northwestern Europe, between October to March, very little or practically no vitamin D is produced in exposed skin. Clothing affected by religious or cultural habits, glass, plastic and sunscreens that are widely used due to concerns of skin cancer effectively block UV radiation and prevent cutaneous vitamin D synthesis. Vitamin D production is much less effective in dark skin, melanin absorbs UV radiation, and in elderly relative to young people. However, even in the elderly, dermal vitamin D production remains very effective. It has been estimated that in summer, a 10-minute exposure, three times a week of the unprotected skin of the head and arms is adequate to prevent vitamin D deficiency in the elderly (for detailed discussion see Endotext chapter Vitamin D: Production, Metabolism, and Mechanisms of Actionand references (26-28).


DIAGNOSIS


The diagnosis of vitamin D deficiency is established by low serum concentrations of 25(OH)D. As discussed, circulating levels of 25(OH)D are a good and reliable measure of vitamin D status in most clinically relevant situations although as mentioned obesity and diabetes mellitus can alter the conversion from vitamin D to 25(OH)D. All additional biochemical parameters as well as clinical signs and symptoms reflect the primary and secondary perturbations in mineral and bone metabolism caused by vitamin D deficiency and are common to all disorders in vitamin D action and calcium deficiency (Tables 1,2). Those parameters include low to low normal serum calcium levels, hypocalciuria, secondary hyperparathyroidism, hypophosphatemia, increased levels of biochemical markers of bone turnover, rickets and/or osteomalacia. Therefore, all these measures can be used to support but not to establish the diagnosis, and mainly to assess the relative severity of the vitamin D deficiency and the response to treatment. It is important to note that in vitamin D deficiency, circulating levels of 1,25(OH)2D could vary from low to elevated (Table 2) and thus are useless for the diagnosis.


25(OH)D serum levels are currently being determined in clinical practice by methods that have become more accurate and reproducible, though still with some variability. Reference values of serum 25(OH)D that were population based introduce uncertainty. These reference values differed according to geography, season, dress habits, bed or housebound situations, and age, all of which may affect sunshine exposure and thus vitamin D synthesis, as well as eating habits, local regulation on food fortification, and customs of vitamin supplementation, all of which will affect vitamin D intake. An alternative approach to obtain clinically meaningful reference values was to define health-based parameters, i.e., values of serum 25(OH)D levels below which adverse health outcome may occur. In actuality it is an intervention threshold reference value, below which therapy may prevent adverse effects on the musculoskeletal system (29). This approach is based on the current notion that though severe vitamin D deficiency will lead to rickets and/or osteomalacia, milder vitamin D deficiency states will not affect bone matrix mineralization, but via its effect on mineral homeostasis will cause secondary hyperparathyroidism, increased bone turnover and bone loss. These aberrations in mineral and bone metabolism will contribute to the development and acceleration of osteoporosis and together with the non-skeletal effects of vitamin D on physical function, will increase the risk of low impact skeletal fractures (28,30). The relationship between serum concentrations of 25(OH) D and iPTH in various vitamin D states was analyzed in multiple studies (28,31-33). The aim was to define serum 25(OH)D concentrations below which serum iPTH levels started to increase, or base line 25(OH)D levels above which vitamin D supplementation caused a significant decrease of iPTH serum concentrations. Both approaches yielded similar functional thresholds of serum 25(OH)D levels that affect circulating iPTH concentrations, although the relationship between 25(OH)D and PTH levels is substantially affected by calcium intake.


Based on these studies, a diagnostic staging of vitamin D deficiency states, based on serum 25(OH)D levels and secondary perturbation in mineral and bone metabolism has been proposed (28). Mild vitamin D deficiency (or vitamin D insufficiency) is diagnosed when serum 25(OH)D levels are below 50 nmol/liter (20 ng/ml). This is associated with mild elevations of serum iPTH and biochemical markers of bone turnover. Moderate vitamin D deficiency is defined when serum 25(OH)D levels are below 25 nmol/liter (10 ng/ml). Serum iPTH concentration is moderately increased with high bone turnover. Severe vitamin D deficiency occurs when serum 25(OH)D levels are lower than 12.5 nmol/liter (5 ng/ml), iPTH circulating concentration may be markedly increased and rickets and/or osteomalacia may occur. It is obvious that according to this scheme, vitamin D sufficiency is defined as serum 25(OH)D levels above 50 nmol/liter (20 ng/ml). That said these cut off values remain controversial.


A somewhat similar definition was suggested recently by an expert panel for the Institute of Medicine (IOM) (current name National Academy of Medicine (NAM)) recommending that a level of 50 nmol/liter (20 ng/ml) of 25(OH)D was sufficient for 97.5% of the adult USA population, although up to 125 nmol/liter (50 ng/ml) was considered safe (34). At the same time, another group of experts, from the Endocrine Society, suggested that the most advantageous value of 25(OH)D for musculoskeletal health is 75 nmol/liter (30 ng/ml) (35).


PREVALENCE


Serum 25(OH)D levels vary widely among different populations. On average serum 25(OH)D concentration are lower in European countries than in the USA and even lower in some countries in the Middle East and the Asia-Pacific region. A multinational study (with the exception of North America), in post-menopausal women treated for osteoporosis, revealed that 30-90% (depending on location and season), had serum levels of 25(OH)D below 75 nmol/liter (30 ng/ml), (the highest frequency of women below this level was observed in the Middle East and Asia (two countries in each region)). If the threshold is taken as 50 nmol/liter (20 ng/ml), 31% of the women fell below that threshold. Based on more than 40 studies from Europe, North America, the Middle East and the Asian-Pacific regions (28), it seems that a gradual decline in mean serum 25(OH)D levels is apparent starting from healthy adults to independent elderly, institutionalized elderly, and the lowest value in patients with hip fracture. Several studies of patients hospitalized for non-traumatic fractures, revealed that few (about 5%) of these subjects had serum 25(OH)D levels above 50 nmol/liter (20 ng/ml); the majority of them had vitamin D deficiency of various severity.


As discussed, vitamin D status will be determined by cutaneous photosynthesis and intake. The populations at risk to develop vitamin D deficiency are those who have limited sunshine exposure and no vitamin D supplementation. Thus, vitamin D insufficiency and deficiency will be more prevalent in populations that are not exposed to sunshine due to geography-latitude, cultural, religious, and life-style habits, or are less efficient in cutaneous vitamin D synthesis due to age or pigmentation. The most vulnerable populations are those who are unable to move freely, bedridden or their mobility is severely diminished. This is more common at the beginning or the end of the life cycle, i.e., infants and the elderly, but of course it can happen at any age when free movement is limited due to physical or mental handicap.


The prevalence of osteomalacia is much lower and will depend on the criteria used for diagnosis, i.e., clinical, biochemical, bone histology or quantitative bone histomorphometry. In a review by Lips (28) of 19 publications describing bone histomorphometry of the femoral head or iliac crest biopsy in a total of about 1400 patients with hip fracture, the frequency of osteomalacia ranged from none to more than 30%. This difference may reflect different populations but also the histological criteria used to define osteomalacia. The very high incidence of vitamin D deficiency recorded in patients with hip fractures supports the notion that increased fracture risk is not just the outcome of frank osteomalacia but may result from secondary hyperparathyroidism, increased bone turnover, bone loss, and increased risk of low impact fractures caused by vitamin D deficiency. This is further supported by the positive relationship observed between serum 25(OH)D levels (below a certain threshold) and hip BMD (28,36,37), and the negative relationship observed between hip BMD and serum iPTH (28,36-38). Moreover, a daily dose of 700-800 IU and above of vitamin D and calcium supplementation caused a significant reduction in the incidence of hip and other nonvertebral fractures in women with post-menopausal osteoporosis, including nursing home residents (29,30,39).


TREATMENT


Adequate intake of vitamin D was defined recently in the USA by two working groups (NAM and the Endocrine Society) as discussed above. Both reports agree on the recommended dose for infants (400 IU/day) and children (600 IU/day). There is a difference in the recommendations for adults (600 IU/day) until the age of 70 (including pregnant and lactating women) and 800 IU/day above this age (NAM report), while the Endocrine Society recommendations are 1,500-2,000 IU/day for all of the adult population (34,35). In Europe, vitamin D intake recommendations are similar or somewhat lower than the NAM. The upper tolerable daily doses of vitamin D were suggested to be 4,000 IU, 10,000 IU, and 2,000 IU by the NAM, the Endocrine Society guidelines and the European Commission, respectively. There is an unresolved debate on the equipotency of vitamin D2 versus D3, but as vitamin D3 is widely available, all recommendations are actually for vitamin D3. These recommended intakes of vitamin D are usually unachievable if widely consumed food substances are not fortified with vitamin D. Thus, the population at large and the elderly population in particular are dependent on adequate cutaneous vitamin D synthesis, i.e., sunshine exposure, or vitamin D supplementation. In the United States and a few additional countries, milk is fortified with vitamin D, 400 IU per quart or liter, and the consumption of multivitamins containing vitamin D as well is relatively common, but not uniform or mandatory. Thus, in most countries and even in the USA, the elderly and especially the immobile, housebound elderly are prone to develop vitamin D deficiency.


Treatment has to be targeted towards the population with the highest risk to develop vitamin D deficiency. For a long period, vitamin D supplementation for infants up to 1 year of age, is mandatory in many countries and the daily dose recommendations was increased from 200 IU/day to 400 IU/day (34,35). Unfortunately, this has not yet become common practice for the elderly population. As discussed, nursing home residents, institutionalized and hospitalized elderly, and patients with hip and other non-traumatic fractures and neurological disorders are among the ones with the highest risk of having and developing vitamin D deficiency. Treatment with the recommended doses of vitamin D and calcium (see below) can be initiated even before biochemical screening of 25(OH)D serum levels and indices of mineral and bone metabolism is obtained. This is based on the very high incidence of vitamin D deficiency in this population of patients and on the fact that with the recommended vitamin D doses and the tight physiological control of 1.25(OH)2D production, no toxicity is likely to occur at doses of up to 4,000 IU/day for a limited period.


It is important to remember that in concordance with vitamin D treatment, the recommended daily calcium allowance must be achieved as well, usually by calcium salt supplementation (see Endotext chapter Osteoporosis: Prevention and Treatment).


The usual recommended oral doses of vitamin D as discussed above are 600 to 1,500 IU daily. In severe vitamin D deficiency, doses of 4,000 IU- to 6,000 IU per day (or the equivalent weekly or twice weekly dose) could be given for the first 4-6 weeks, followed by dose adjustment in accordance with the biochemical response, with the final aim to achieve the recommended maintenance dose. Because vitamin D is stored in fat and released slowly and the half-life of 25(OH)D is 2-3 weeks, the vitamin can be given orally once a week. Studies with administration of vitamin D in megadoses at intervals greater than monthly have shown increased risk of falls and should be avoided (28,40-43).


The response to treatment with vitamin D will depend on the degree and severity of vitamin D deficiency and the secondary changes in mineral and bone metabolism. In severe vitamin D deficiency with osteomalacia, a dramatic response in the signs, symptoms, and laboratory parameters will be observed. Bone pain and muscle weakness will improve quickly, pseudofractures will show signs of healing on x-ray, and serum calcium, iPTH and biochemical markers of bone turnover will return towards the normal range. In moderate or mild vitamin D deficiency or insufficiency, the response to treatment is more subtle. Muscle weakness and bone pain may improve, serum 25(OH)D levels will increase towards the normal, serum iPTH and biochemical markers of bone turnover will return towards normal (this will be a function of the severity of the initial vitamin D deficiency). In the long run, bone mineral density may increase somewhat and the incidence of fractures may decrease. These results are based on responses of groups of patients in clinical trials and not individuals (28).


1,25 Dihydroxyvitamin D Deficiency


As discussed, 1,25(OH)2D deficiency is defined as low circulating levels of this metabolite with normal or elevated (depending on preceding vitamin D therapy) serum concentrations of 25(OH)D. In theory, it could be the end result of decreased production or increased clearance. Increased clearance of 1,25(OH)2D is uncommon and usually a part of increased clearance of additional vitamin D metabolites such as 25(OH)D, thus it would fit the definition of vitamin D deficiency.


Decreased production of 1,25(OH)2D could be hereditary or acquired and each one can be subcategorized as simple or complex. Acquired 1,25(OH)2D deficiency due to defective synthesis is usually part of a more general disease (i.e., complex) as chronic renal failure, acquired Fanconi syndrome, hypoparathyroidism, or tumor induced osteomalacia, that will affect mineral and bone metabolism in a multiple and complex ways that is beyond the scope of this chapter. Thus, the entity to be discussed here will be simple hereditary 1,25(OH)2D deficiency caused by defective synthesis of calcitriol.


Prader et al. (44) were the first to describe two young children who showed all the usual clinical features of vitamin D deficiency despite adequate intake of the vitamin, thus coining the name “pseudovitamin D deficiency.” Complete remission was dependent on continuous therapy with high doses of vitamin D, thus the term “vitamin D-dependent rickets.” However, remission of the disease could be achieved by continuous therapy with physiological (microgram) doses of 1a-hydroxylated vitamin D metabolites (45,46).


Family studies have revealed it to be an autosomal recessive disease. Linkage analysis in a subset of French-Canadian families assigned the gene responsible for the disease to chromosome 12q13 (47,48). The gene encoding the 25(OH)D-1α-hydroxylase (CYP27B1) of mouse kidney, human keratinocytes, and peripheral mononuclear cells was localized on chromosome 12q 13.1-13.3 which maps to the disease locus of simple hereditary 1,25(OH)2D deficiency (49-55). Cloning and sequencing of the enzyme has enabled the demonstration of its decreased expression in patients with this disease (56) as well as enabling studies showing that the same enzyme is widely distributed in tissues and not limited to the kidney (56,57). The sequence of the human CYP27B1 gene from keratinocytes and peripheral blood mononuclear cells has been shown to be identical with the renal gene (49,51-55), thus supporting the use of these accessible cells as a proxy to study the renal tubular enzymatic defect. That said regulation of extrarenal CYP27B1 differs from that of the kidney, with its regulation in keratinocytes and macrophages responding to cytokines rather than PTH and FGF23 (25). Subjects with mutations in CYP27B1 have circulating levels of 25(OH)D that are normal or elevated, depending on previous vitamin D treatment; serum concentrations of 1,25(OH)2D are very low (Table 2); while massive doses (100-300 times the daily recommended dose) of vitamin D or 25(OH)D are required to maintain remission of rickets, physiological replacement doses of calcitriol are sufficient to achieve the same effect.  The 1α-hydroxylase gene from more than 25 families with simple hereditary 1,25(OH)2D deficiency and some of their first-degree healthy relatives were analyzed by direct sequencing, site directed mutagenesis, and cDNA expression in transfected cells (49,51-55). All patients had homozygous mutations while parents or other healthy siblings were heterozygous for the mutation. Most patients of French-Canadian origin had the same mutation causing a frameshifting and a premature stop codon in the putative heme-binding domain (51). The same mutation was observed in additional families of diverse origin (55). All other patients had either a base-pair deletion causing premature termination codon upstream from the putative ferredoxin and heme-binding domains, or missense mutations (56,58-61). No 1α-hydroxylase activity was detected when the mutant enzyme was expressed in various cells. Taken together, these observations support the notion that the etiology of this hereditary disease is a defect in CYP27B1.


The beneficial therapeutic effect of high serum concentrations of 25(OH)D in patients treated with massive doses of vitamin D, while 1,25(OH)2D levels remain low, may have several possible explanations. First, high levels of 25(OH)D may activate the VDR whose affinity for this metabolite is approximately two orders of magnitude lower than for 1,25(OH)2D. Second, a metabolite of 25(OH)D may act directly on target tissue, and finally, high levels of 25(OH)D may drive the production of 1,25(OH)2D if the mutated enzyme has some residual function.


The differential diagnosis of simple hereditary 1,25(OH)2D deficiency from other hereditary or acquired forms of hypocalcemic rickets and/or osteomalacia especially the one associated with defects in the vitamin D receptor-effector system is based on serum concentrations of calcitriol and the response to treatment with 1-alpha hydroxylated vitamin D metabolites (Table 2).


A similar syndrome has been described and studied in a mutant strain of pigs where the mode of inheritance as well as the clinical and biochemical features are similar to the human disease (62,63). Piglets affected by the disease have rickets, elevated 25(OH)D with low or undetectable 1,25(OH)2D serum concentrations, normal specific tissue binding sites for tritiated 1,25(OH)2D, and no detectable activity of 25(OH)D-1α-hydroxylase in renal cortical homogenates. Thus, there is strong evidence that the disease state in the pig is caused solely by an inherited defect in the porcine CYP27B1. An animal model in which the gene encoding 25(OH)D-1α-hydroxylase was knocked out by homologous recombination reproduced all the clinical and biochemical features of this disease including undetectable serum 1,25(OH)2D levels (64).


Simple Hereditary Resistance to 1,25 Dihydroxy-Vitamin D


This is a rare disorder and only about 60 patients have been reported (65) Brooks et al. (66) described an adult patient with hypocalcemic osteomalacia and elevated serum concentration of 1,25(OH)2D. Treatment with vitamin D, causing a further increase in serum calcitriol levels, cured the patient. The term vitamin D-dependent rickets type II was suggested to describe this disorder. However, reports on additional patients, about half of whom did not respond to vitamin D therapy, as well as in vivo and in vitro studies to be discussed below, seem to prove that vitamin D dependency is a misnomer. The term hereditary vitamin D resistant rickets (HVDRR) is the current most widely used name of this disorder.


CLINICAL AND BIOCHEMICAL FEATURES


General Features


The clinical, radiological, histological, and biochemical features (except serum levels of vitamin D metabolites) are typical of hypocalcemic rickets and/or osteomalacia as previously discussed with one exception. Many of these patients develop alopecia in early childhood, not seen in even severe cases of vitamin D deficiency. In these patients there is no history of vitamin D deficiency and no clinical or biochemical response to physiological doses of vitamin D or its 1a-hydroxylated active metabolites. Serum levels of 25(OH)D are normal or elevated (depending on preceding vitamin D therapy); 1,25(OH)2D concentrations are markedly elevated before or during therapy with vitamin D preparations (Table 2).


The disease manifests itself as an active metabolic bone disease in early childhood. However, late onset at adolescence and adulthood was documented in several sporadic cases including the first report by Brooks et al. (66,67). These patients represented the mildest form of the disease and had a complete remission when treated with vitamin D or its active metabolites. It is unclear if the adult-onset patients belong to the same hereditary entity, as no further studies on their VDR status have been published.


Ectodermal Anomalies  


A peculiar clinical feature of the patients, appearing in more than half of the subjects, is total alopecia or sparse hair (Figure 6). Alopecia usually appears during the first year of life and in one patient, at least, has been associated with additional ectodermal anomalies (68) (Figure 6).


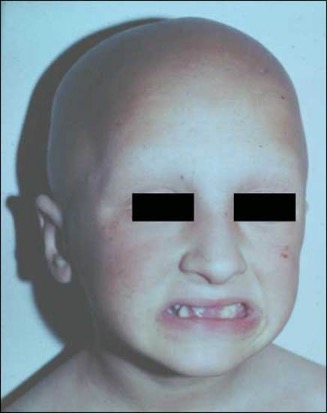
Figure 6. Patient with mutation in VDR demonstrating both alopecia and changes in dentition.


It seems that alopecia is a marker of a more severe form of the disease as judged by the earlier onset, the severity of the clinical features, the proportion of patients who do not respond to treatment with high doses of vitamin D or its active metabolites, and the extremely elevated levels of serum 1,25(OH)2D recorded during therapy (69,70). Though some patients with alopecia could achieve clinical and biochemical remission of their bone disease, none have shown hair growth. The notion that total alopecia is probably a consequence of a defective vitamin D receptor-effector system is supported by the following: alopecia has only been associated with hereditary defects in the VDR system, i.e., with end-organ resistance to the action of the hormone, and has not been recorded with hereditary deficiency in 1,25(OH)2D synthesis, i.e., low circulating levels of the hormone (71); alopecia is present in kindreds with different defects in the VDRs; high-affinity uptake of tritiated 1,25(OH)2D3 in the nucleus of the outer root sheath of the hair follicle of rodents has been demonstrated by autoradiography (72). Of interest is that mutations in Hairless likewise cause alopecia with histologic features similar to those seen with VDR mutations. Hairless and VDR interact in the keratinocyte suggesting their codependence for regulation of hair follicle cycling (73). High dietary or infusions of calcium can reverse the skeletal changes but do not reverse the alopecia (74). Finally, alopecia developed in homozygote VDR knockout mice (75-77). Taken together, it could be hypothesized that an intact VDR-effector system is important for the differentiation of the hair follicle in the fetus, which is unrelated to mineral homeostasis.


VITAMIN D METABOLISM


Serum concentrations of 1,25(OH)2D range from upper normal values to markedly elevated before therapy, but on vitamin D treatment may reach the highest levels found in any living system (100 times and more than the upper normal range) (70). These values may represent the end results of four different mechanisms acting synergistically to stimulate strongly the renal 25(OH)D-1α-hydroxylase. Three of the mechanisms are hypocalcemia, secondary hyperparathyroidism, and hypophosphatemia. The fourth mechanism may be a failure of the negative feedback loop by which the hormone inhibits the renal enzyme activity caused by the basic defect in the VDR-effector system. This was demonstrated in a patient in remission (normal serum levels of calcium, phosphorus and PTH) in whom a load of 25(OH)D3 had caused a marked increase in serum 1,25(OH)2D3 concentration (69,78). It was reported that the 1α-hydroxylase gene expression was not suppressed by 1,25(OH)2D3 in renal tubular cells from VDR knock out mice while it was suppressed in cells with normal VDR or heterozygote for the null mutation (6,79).


MODE OF INHERITANCE


In approximately half of the reported kindreds, parental consanguinity and multiple siblings with the same defect suggest autosomal recessive mode of inheritance (69). Parents or siblings of patients who are expected to be obligate heterozygotes have been reported to be normal, i.e., no bone disease or alopecia and normal blood biochemistry. However, studies on cells (cultured dermal fibroblasts, Epstein-Barr transformed lymphoblasts, and mitogen-stimulated lymphocytes) obtained from parents or siblings of affected children revealed decreased bioresponses, decreased normal VDR protein and its mRNA, and a heterozygote genotype exhibiting both normal and mutant DNA alleles (80-83). There is a striking clustering of patients around the Mediterranean, including patients reported from Europe and America who originated from the same area. A notable exception is a cluster of some kindreds from Japan (67,84-89).


CELLULAR AND MOLECULAR DEFECTS


Methods  


The near ubiquity of a similar if not identical VDR-effector system among various cell types including cells originating from tissues easily accessible for sampling made feasible studies on the nature of the intracellular and molecular defects in patients with simple hereditary resistance to 1,25(OH)2D. The cells used were mainly fibroblasts derived from skin biopsies (69,78,80-82,87,90-104) and peripheral blood mononuclear (PBM) cells. PBM cells contain high-affinity receptors for 1,25(OH)2D3 that are expressed constitutively in monocytes and are induced in mitogen-stimulated T-lymphocytes and Epstein-Barr (EB) transformed lymphoblasts. All cells have been used to assess most of the steps in 1,25(OH)2D3 action from cellular and subcellular uptake of the hormone to bioresponse as well as to elucidate the molecular aberrations in the VDR protein, RNA, and DNA.


The hormone-receptor interaction has been analyzed by several methods including binding characteristics of 3H 1,25(OH)2D3 to intact cells, nuclei or high salt cellular soluble extracts (69,78,80-83,90-92,95-99,105-110); measurements of VDR protein content by monoclonal antibodies with radiological immunoassay or Western blot analysis (81,82); by immunocyto-chemical methods in whole cells (111); characterization of the hormone-receptor complex on continuous sucrose gradient and nonspecific DNA-cellulose columns (69,78,80,90-92,94-97,106,110,112).


The cloning and nucleotide sequencing of the human VDR gene made feasible studies of the molecular defects in patients with this disease. The methods used included, among others, isolation, amplification, and sequencing of genomic VDR DNA, as well as cloning and sequencing of VDR complementary DNA (cDNA). The mutant DNA was recreated in vitro and was transfected into cells that do not express endogenous VDR. Post-transcriptional action of 1,25(OH)2D was tested in cells originating from patients or in cells co-transfected with VDR (either mutant or wild type) fused to a promoter containing vitamin D response element (VDRE).


Studies with the above-mentioned methods in cells originating from a variety of patients revealed heterogeneity of the cellular and molecular defects in the VDR-effector system. Based on the known functional properties of the VDR, different classes of defects could be identified.


Defect in the Hormone Binding Region (Including Heterodimerization)


Deficient Hormone Binding. There are three subgroups in this class:


(i) No Hormone Binding. This is the most common abnormality observed and is characterized by unmeasurable specific binding of 3H 1,25(OH)2D3 to either intact cells, nuclei, or cell extracts (69,78,81,82,91,96,100-102,105,107,112-116). Studies in several kindreds with this defect (including an extended kindred with 8 patients studied) revealed undetectable levels of VDR by immunoblots on an immunoradiometric assay in most kindreds (81,82,102,116,117). DNA from these affected subjects exhibited a single base mutation that was different in each kindred resulting in a premature stop codon. The truncated VDRs produced lacked hormone binding or both hormone and DNA binding domains (Figure 7) (113-115,117). The recreated mutant VDR cDNA was expressed in mammalian cells, and the resulting mutant VDR was demonstrated to be the truncated protein that exhibited no specific hormone binding. In cells cultured from parents of some patients, expected to be obligate heterozygotes, binding of 3H 1,25(OH)2D3, VDR protein, and mRNA content of cells ranged from the lower limit of normal to about half the normal level.


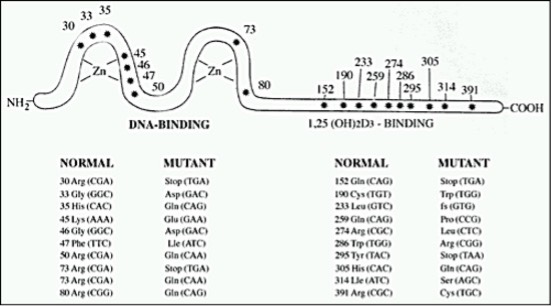
Figure 7. Schematic presentation of homozygous mutation in the VDR protein in simple hereditary resistance to 1,25(OH)2D. The asterisks depict sites of amino acid substitutions due to point mutation and codon changes, using the numbering system of Baker et (13); fs-frame shift.


In one patient representing a kindred with no hormone binding, a missense mutation resulted in the substitution of the hydrophobic basic arginine 274 by the hydrophilic nonpolar leucine in the hormone binding region (116) (Figure 7). In this patient, normal transcription could be elicited by 1000-fold higher concentrations of calcitriol than needed for the wild-type receptor. However, no in vivo or in vitro stimulation of 25(OH)D-24-hydroxylase could be obtained by high concentrations of 1,25(OH)2D3 (see below).


Two siblings without alopecia and no response to any dose of 1,25(OH)2D in vivo and in vitro (118) had a missense mutation that caused a substitution of tryptophan by arginine at amino acid 286 of the VDR (102). This substitution in a normal size VDR abolished completely the binding of 1,25(OH)2D to its receptor. The tryptophan in this position is critical for the positioning of calcitriol in the VDR as was unveiled by the three-dimensional arrangement of the VDR and its ligand based on its crystal structure.


(ii) Defective Hormone Binding Capacity. In a patient representing one kindred, the number of binding sites in nuclei and soluble cell extracts was 10% of control, with an apparent normal affinity  (78,105,112). Recently, a boy with total alopecia, severe rickets and growth retardation was found to have two heterozygote different molecular defects in the ligand binding domain (9). The patient’s VDR had a low hormone binding capacity, 10% to 30% of controls, with normal affinity and a markedly deficient stimulation of 25(OH)D3-24-hydroxylase. The recreated mutations, each one tested separately in vitro, showed also deficient heterodimerization as well as different transactivation of two gene promoters. This patient, similar to another one described more than 20 years ago, could be completely cured by very high doses of 25(OH) vitamin D, 250 μg a day initially, followed by 100 μg/day and then 75 μg/day as a maintenance dose for years, plus modest calcium supplementation. In both patients, it could be shown that during remission (normocalcemia, normophosphatemia, normal iPTH), 1,25(OH)2D production is driven by the substrate, i.e., 25(OH) vitamin D concentrations.


An additional patient with hereditary resistance to 1,25(OH)2D and alopecia was found to have compound heterozygous mutations in the VDR (119). This girl’s cultured fibroblasts were found to have about 30% binding sites of 1,25(OH)2D in comparison to her parents or normal controls. However, RXR heterodimerization, co-activator interaction and gene transactivation were completely abolished, and no response in vitro to high doses of 1,25(OH)2D3 was observed. Treatment with 3,000mg of calcium carbonate orally per day and 3μg/kg of calcitriol caused some improvement in the clinical features and biochemical parameters.


(iii) Defective Hormone Binding Affinity. Binding affinity of tritiated calcitriol was reduced 20- to 30-fold, with normal capacity in soluble dermal fibroblast extracts from one kindred (98). An additional patient, representing a different kindred had a modest decrease of VDR affinity when measured at 0°C (120).


Deficient Nuclear Uptake. The following features characterize the hormone-receptor-nuclear interaction in this defect: normal or near normal binding capacity and affinity of 3H 1,25(OH)2D3 to soluble cell extracts with low to unmeasurable hormone uptake into nuclei of intact cells (87,90,105,121,122). These features were demonstrated in skin-derived fibroblasts in all kindreds, in cells cultured from a bone biopsy of one patient (94), and in EB-transformed lymphoblasts of one patient (121). Occupied VDR obtained from fibroblast extracts of two kindreds demonstrated normal binding to nonspecific DNA cellulose (80). Immuno-cytological studies in fibroblasts of a patient with this defect showed that immediately after 1,25(OH)2D3 treatment, VDR accumulated along the nuclear membrane with no nuclear translocation (123). Patients with this defect included a kindred with normal hair and several kindreds with total alopecia. Finally, almost all patients responded with a complete clinical remission to high doses of vitamin D and its active 1a-hydroxylated metabolites.


Attempts to characterize the molecular defect were carried in six kindreds. In three of them, no mutation in the coding region of the VDR gene was observed (121). Studies in three kindreds, revealed a normal molecular mass and quantitative expression of the VDR (122). Complete sequencing of the VDR coding region revealed a different single nucleotide mutation in each kindred in a region that is considered to play a role in heterodimerization of VDR with RXR (Figure 7) (115,122). Thus, it has been suggested that these patients’ receptors have defects that compromise RXR heterodimerization, which is essential for nuclear localization and probably for recognition of the vitamin D responsive element as well. The fact that no mutation in the VDR coding region was observed in three additional kindreds with the same phenotypical defect may suggest that the genetic defect affects another component of the receptor effector system that is essential for the VDR function as a nuclear transcription factor. It has been shown that coactivation complexes are essential for the ligand induced transactivation of VDR (124).


Deficient coactivators of the calcitriol-VDR complex. A patient with simple hereditary resistance to 1,25(OH)2D without alopecia was described (104). Sequencing of the VDR-DNA revealed a missense mutation in the ligand binding domain that caused a substitution of glutamic acid to lysine at amino acid 120. This receptor exhibits many normal properties including calcitriol binding, dimerization and binding to vitamin D response elements in the DNA, but a marked impairment in binding coactivators that are essential for the transactivation of the hormone receptor complex and the initiation of the physiological response (104).


Defects in the DNA Binding Region  


Deficient Binding to DNA. Cell preparations derived from patients with this defect demonstrate normal or near normal binding capacity and affinity for 3H 1,25(OH)2D3 to nuclei of intact cells and soluble cell extracts, as well as normal molecular size. Hormone receptor complexes, however, have decreased affinity to nonspecific DNA (88,89,97,108,109). A single nucleotide missense mutation within exon 2 or 3, encoding the DNA binding domain of the VDR, was demonstrated in genomic DNA isolated from dermal fibroblasts and/or EB-transformed lymphoblasts from ten unrelated kindreds (80,88,89,95,110,114,125,126). Eight different single nucleotide mutations were found in the ten kindreds (Figure 7). Two apparently unrelated kindreds share the same mutation (88,110). All point mutations caused a single substitution of an amino acid that resides in the region of the two zinc fingers of the VDR protein that are essential for the functional interaction of the hormone-receptor complex with DNA. Interestingly, all these altered amino acids are highly conserved in the steroid receptor superfamily that includes the receptors for steroid hormones, thyroid hormones and retinoic acid.


Studies on cells obtained from parents and some of the siblings of these patients revealed, as expected, a heterozygous state, i.e., expression of both normal and defective forms of VDR as well as normal and mutant gene sequences (80,102,109), but without any clinical and biochemical abnormalities.


In Vitro Post Transcriptional Effect of 1,25(OH)2D3


In vitro bioeffects of the hormone on various cells in patients with simple hereditary resistance to 1,25(OH)2D have been assayed mainly by two procedures, induction of 25(OH)D-24-hydroxylase and inhibition of mitogen stimulated PBM cells.


1,25(OH)2D3 induces 25(OH)D-24 hydroxylase activity in skin-derived fibroblasts (78,81,82,89,91-93,96-104,109,110,121,126,127), mitogen-stimulated lymphocytes (83), and cells originating from bone (94,128) in a dose-dependent manner. In cells from normal subjects, maximal and half-maximal induction of the enzyme was achieved by 10-8and 10-9M concentrations of 1,25(OH)2D3, respectively. Dermal fibroblast or PBM cells from patients with no calcemic response to maximal doses of vitamin D or its metabolites in vivo did not show any 25(OH)D-24-hydroxylase response to very high concentration of 1,25(OH)2D3 in vitro, while dermal fibroblasts from patients with a calcemic response to high doses of vitamin D or its metabolites in vivo showed inducible 24-hydroxylase with supraphysiological concentrations of 1,25(OH)2D3 in vitro. Physiological concentrations of 1,25(OH)2D3 partially inhibit mitogen-induced DNA synthesis in peripheral lymphocytes with a half maximal inhibition achieved at 10-10M of the hormone (85,107). Mitogen stimulated lymphocytes from several kindreds with defects characterized as no hormone binding or deficient binding to DNA, with no calcemic response to high doses of vitamin D and its metabolites in vivo, showed no inhibition of lymphocyte proliferation in vitro with concentrations of up to 10-6M 1,25(OH)2D3. Additional methods to measure bioeffects of 1,25(OH)2D3 on various cells in vitro were carried out only in a few patients and included inhibition of dermal fibroblast proliferation (93), induction of osteocalcin synthesis in cells derived from bone (128), a mitogenic effect on dermal fibroblasts (123), and stimulation of cGMP production in cultured skin fibroblasts (129). It is noteworthy that in all assays mentioned and without exception, each patient’s cell showed severely deficient responses.


With the elucidation of the molecular defects in simple hereditary resistance to 1,25(OH)2D, the transactivation abilities of naturally occurring mutant or recreated mutant VDRs were evaluated in a transcriptional activation assay. In this assay a gene promoter responsive to VDR is fused to a gene reporter that its message is easily measured, and the plasmid is transfected into patients or normal cells (81,82,88,89,109,116,121). Treating normal transfected cells with 1,25(OH)2D3 caused a concentration-dependent induction of transcription. No induction of transcription was observed in cells originating from patients with defects characterized as no hormone binding (130,131)(116) or deficient binding to DNA (88,89,109,110). Moreover, in a cotransfection assay, the addition of a normal human VDR cDNA expression vector to the transfected plasmid that directed synthesis of a normal VDR, restored hormone responsiveness of resistant cells. Finally, in a patient characterized as deficient nuclear uptake defect, no mutation was identified within the coding region of the VDR gene; no induction of 25(OH)D-24-hydroxylase activity by up to 10-6 1,25(OH)2D3 was observed in cultured skin fibroblasts, but there was normal transactivation by 1,25(OH)2D3 in the transcriptional activation assay (121).


CELLULAR DEFECTS AND CLINICAL FEATURES


Normal hair was described with most phenotypes of the cellular defects, the exception being patients with deficient hormone binding capacity and affinity, but this could be due to the fact that only one or two kindreds were described per subgroup. Normal hair is usually associated with a milder form of the disease, as judged by the age of onset, severity of the clinical features, and usually the complete clinical and biochemical remission on high doses of vitamin D or its metabolites. Notable exceptions are 3 kindreds (4 patients), two of them without alopecia that displayed resistance both in vivo (no clinical remission on circulating calcitriol level up to 100 times the mean normal adult values) and in vitro (no induction of 25(OH)D-24-hydroxylase activity in dermal fibroblasts by up to 10-8 M 1,25(OH)2D3) (99,102,104). Only approximately half of the patients with alopecia have shown satisfactory clinical and biochemical remission to high doses of vitamin D or its active 1a-hydroxylated metabolites, but the dose requirement is ~10-fold higher than in patients with normal hair (70).


It seems that patients’ defects characterized as deficient hormone binding affinity and deficient nuclear uptake achieve complete clinical and biochemical remission on high doses of vitamin D or its active 1a-hydroxylated metabolites. Most of the patients with other types of defects could not be cured with high doses of vitamin D or its metabolites. However, it should be emphasized that not all of the patients received treatment for a long enough period of time and with sufficiently high doses (see Treatment, below).


DIAGNOSIS


Clinical features of early onset rickets with no history of vitamin D deficiency, total alopecia, parental consanguinity, additional siblings with the same disease, serum biochemistry of hypocalcemic rickets, elevated circulating levels of 1,25(OH)2D, and normal to high levels of 25(OH)D (Table 2) support the diagnosis of simple hereditary resistance to 1,25(OH)2D. The issue becomes more complicated when the clinical features are atypical, i.e., late onset of the disease, sporadic cases, and normal hair. Failure of a therapeutic trial with calcium and/or physiological replacement doses of vitamin D or its metabolites may support the diagnosis but the final direct proof requires the demonstration of a cellular, molecular, and functional defect in the VDR-effector system.


Based on the clinical and biochemical features, the following additional disease states should be considered: (1) extreme calcium deficiency: a seemingly rare situation described in a group of children from a rural community in South Africa, who consumed an exceptionally low calcium diet of 125 mg/day (20). All had severe bone disease with histologically proven osteomalacia, biochemical features of hypocalcemic rickets with elevated serum levels of 1,25(OH)2D, and sufficient vitamin D. Calcium repletion caused complete clinical and biochemical remission. Nutritional history and the response to calcium supplementation support this diagnosis. (2) Severe vitamin D deficiency: during initial stages of vitamin D therapy in children with severe vitamin D-deficient rickets, the biochemical picture may resemble 1,25(OH)2D resistance, i.e., hypocalcemic rickets with elevated serum calcitriol levels. This may represent a “hungry bone syndrome,” i.e., high calcium demands of the abundant osteoid tissue becoming mineralized. This is a transient condition that may be differentiated from simple hereditary resistance to 1,25(OH)2D by a history of vitamin D deficiency and the final therapeutic response to replacement doses of vitamin D.


TREATMENT


In about half of the kindreds with simple hereditary resistance to 1,25(OH)2D, the bioeffects of 1,25(OH)2D3 were measured in vitro (see above). An invariable correlation (with one exception) was documented between the in vitro effect and the therapeutic response in vivo; i.e., patients with no calcemic response to high levels of serum calcitriol showed no effects of 1,25(OH)2D3 on their cells in vitro (either induction of 25(OH))D-24-hydroxylase or inhibition of lymphocyte proliferation) and vice versa. If the predictive therapeutic value of the in vitro cellular response to 1,25(OH)2D3 could be substantiated convincingly, it may eliminate the need for time consuming and expensive therapeutic trials with massive doses of vitamin D or its active metabolites. In the meantime, it is mandatory to treat every patient with this disease irrespective of the type of receptor defect.


An adequate therapeutic trial must include vitamin D at a dose that is sufficient to maintain high serum concentrations of 1,25(OH)2D3 as the patients can produce high hormone levels if supplied with enough substrate. If high serum calcitriol levels are not achieved, it is advisable to treat with 1a-hydroxylated vitamin D metabolites in daily doses of up to 6 mg/kg weight or a total of 30-60 mg and calcium supplementation of up to 3 g of elemental calcium daily; therapy must be maintained for a period sufficient to mineralize the abundant osteoid (usually 3-5 months). Therapy may be considered a failure if no change in the clinical, radiological, or biochemical parameters occurs during continuous and frequent follow up while serum 1,25(OH)2D concentrations are maintained at ~100 times the mean normal range.


In some patients with no response to adequate therapeutic trials with vitamin D or its metabolites, a remarkable clinical and biochemical remission of their bone disease, including catch-up growth, was obtained by treatment with large amounts of calcium as noted previously. This was achieved by long-term (months) intracaval infusions of up to 1000 mg of calcium daily (102,128,132-134). Another way to increase calcium input into the extra cellular compartment is to increase net gut absorption, independent of vitamin D, by increasing calcium intake (135). This approach is limited by dose and patient tolerability and was actually used successfully in only a few patients.


Several patients have shown unexplained fluctuations in response to therapy or in presentation of the disease. One patient after a prolonged remission became completely unresponsive to much higher doses of active 1a-hydroxylated vitamin D metabolites (78), and another patient seemed to show amelioration of resistance to 1,25(OH)2D3 after a brief therapeutic trial with 24,25(OH)2D (68). In several patients, spontaneous healing occurred in their teens (106) or rickets did not recur for 14 years after cessation of therapy (87).


ANIMAL MODELS


Some New World primates (marmoset and tamarins) that develop osteomalacia in captivity are known to have high nutritional requirements for vitamin D and maintain high serum levels of 1,25(OH)2D, thus exhibiting a form of end-organ resistance to 1,25(OH)2D (136-139). Cultured dermal fibroblasts and EB-virus transformed lymphoblast have shown deficient hormone binding capacity and affinity (136,137). It has been observed that marmoset lymphoblasts contain a soluble protein of 50-60 kDa that binds 1,25(OH)2D3 with a low affinity but high capacity and thus may serve as a sink that interferes with the hormone binding and its cognate receptor (140). The same group described another protein present in the nuclear extract of these cells capable of inhibiting normal VDR-RXR binding to the vitamin D response element (141). It is of interest that these New World primates also exhibit a compensated hereditary end-organ resistance to the true steroid hormones including glucocorticoids, estrogens, and progestins (142). This of course raises the interesting possibility that the defect in the hormone-receptor-effector system involves an element shared by all the members of this superfamily of ligand modulated transcription factors. Subsequent studies have identified the proteins involved as members of the heterogeneous nuclear ribonucleoprotein family (143-145).


VDR knock out mice have been created by targeted ablation of the first or second zinc finger (75,76). Only the homozygote mice were affected. Though phenotypically normal at birth, after weaning however, they become hypocalcemic, develop secondary hyperparathyroidism, rickets, osteomalacia and progressive alopecia. The female mice with ablation of the first zinc finger are infertile and show uterine hypoplasia and impaired folliculogenesis. Otherwise, both VDR cell mutant mice show clinical, radiological, histological and biochemical features that are identical to the human disease. Supplementation with a calcium enriched diet can prevent or treat most of the disturbances in mineral and bone metabolism in these animal models except alopecia (77).


It is of interest that targeting expression of the human VDR to keratinocytes of VDR null mice prevented alopecia without correcting the mineral disorder (146). Further evidence that the role of VDR in hair follicle cycling is ligand independent comes from the observation that mice in which Cyp27b1, the enzyme solely responsible for producing 1,25(OH)2D, has been deleted do not lose hair (147)


CONCLUDING REMARKS


Acquired vitamin D deficiency, especially moderate or mild (sometimes referred to as vitamin D insufficiency), is much more common than previously appreciated. It may affect more than 50% of populations with limited sunshine exposure and no vitamin D supplementation. In the less severe forms of vitamin D deficiency, there is no defective bone matrix mineralization, but an increased bone loss secondary to the perturbations in calcium homeostasis and secondary hyperparathyroidism, which accelerates the development of osteoporosis in post-menopausal women, the elderly population at large in general, and some subgroups in particular such as those on drugs that contribute to bone loss or deficient in calcium intake. Osteomalacia, which marks severe vitamin D deficiency, may affect some of these patients as well. Based on these observations, it is highly recommended for anyone taking care of the elderly, especially the house or bed bound, institutionalized or patients with physical or mental deficiencies that limit their free movement, to consider and evaluate their vitamin D status. It seems to be good clinical practice and cost effective to recommend vitamin D supplementation for populations at risk, as a measure to prevent the deleterious effects of vitamin D deficiency on the musculoskeletal system.


Hereditary deficiencies in vitamin D action are rare disorders. The importance of studying these diseases stems from the fact that they represent a naturally occurring experimental model that helps to elucidate the function and importance of vitamin D and the VDR-effector system in human beings in vivo.


VDRs are abundant and widely distributed among most tissues studied and multiple effects of calcitriol are observed on various cell functions in vitro. Yet, the clinical and biochemical features in patients with simple hereditary 1,25(OH)2D deficiency and resistance seems to demonstrate that the most important disturbances of clinical relevance are perturbations in mineral and bone metabolism. This emphasizes the pivotal role of 1,25(OH)2D in transepithelial net calcium fluxes. Moreover, the fact that in patients with extreme end-organ resistance to calcitriol, calcium infusions correct the disturbances in mineral homeostasis and cure the bone disease may support the notion that defective bone matrix mineralization is secondary to disturbances in mineral homeostasis. That said, the widespread distribution of the VDR and the enzymes metabolizing vitamin D to its active metabolites have led to numerous studies into its non-skeletal actions with the hope that vitamin D may play a role in the treatment of diseases such as cancer, heart disease, respiratory illness, inflammatory diseases, and diabetes. Characterization of the molecular, cellular, and functional defects of the different natural mutants of the human VDR in simple hereditary 1,25(OH)2D deficiency and resistance, demonstrates the essentiality of the VDR as the mediator of calcitriol action and the importance and function of its different domains, i.e., binding of the hormone, an RXR isoform, and binding to a specifically defined DNA region, as well as coactivators and corepressor complexes. Thus, studies in patients with hereditary deficiencies in vitamin D action are the essential link between molecular defects and physiological relevant effects in human beings.


REFERENCES


  1. Ohyama Y, Noshiro M, Eggertsen G, Gotoh O, Kato Y, Bjoerkhem I, Okuda K. Structural characterization of the gene encoding rat 25-hydroxyvitamin D3 24-hydroxylase. Biochemistry. 1993;32(1):76-82.
  2. Akeno N, Saikatsu S, Kawane T, Horiuchi N. Mouse Vitamin D-24-Hydroxylase: Molecular Cloning, Tissue Distribution, and Transcriptional Regulation by 1α,25-Dihydroxyvitamin D3*. Endocrinology. 1997;138(6):2233-2240.
  3. Fu GK, Portale AA, Miller WL. Complete Structure of the Human Gene for the Vitamin D 1α-Hydroxylase, P450c1α. DNA and Cell Biology. 1997;16(12):1499-1507.
  4. Monkawa T, Yoshida T, Wakino S, Shinki T, Anazawa H, Deluca HF, Suda T, Hayashi M, Saruta T. Molecular Cloning of cDNA and Genomic DNA for Human 25-hydroxyvitamin D31α-hydroxylase. Biochemical and Biophysical Research Communications. 1997;239(2):527-533.
  5. Shinki T, Shimada H, Wakino S, Anazawa H, Hayashi M, Saruta T, DeLuca HF, Suda T. Cloning and expression of rat 25-hydroxyvitamin D3-1alpha-hydroxylase cDNA. Proceedings of the National Academy of Sciences of the United States of America. 1997;94(24):12920-12925.
  6. Takeyama K-i, Kitanaka S, Sato T, Kobori M, Yanagisawa J, Kato S. 25-Hydroxyvitamin D <sub>3</sub> 1α-Hydroxylase and Vitamin D Synthesis. Science. 1997;277(5333):1827-1830.
  7. Jehan F, Ismail R, Hanson K, DeLuca HF. Cloning and expression of the chicken 25-hydroxyvitamin D3 24-hydroxylase cDNA. Biochimica et Biophysica Acta (BBA) - Gene Structure and Expression. 1998;1395(3):259-265.
  8. Jones G, Ramshaw H, Zhang A, Cook R, Byford V, White J, Petkovich M. Expression and Activity of Vitamin D-Metabolizing Cytochrome P450s (CYP1α and CYP24) in Human Nonsmall Cell Lung Carcinomas*. Endocrinology. 1999;140(7):3303-3310.
  9. Nguyen M, d'Alesio A, Pascussi JM, Kumar R, Griffin MD, Dong X, Guillozo H, Rizk-Rabin M, Sinding C, Bougnères P, Jehan F, Garabédian M. Vitamin D-Resistant Rickets and Type 1 Diabetes in a Child With Compound Heterozygous Mutations of the Vitamin D Receptor (L263R and R391S): Dissociated Responses of the CYP-24 and rel-B Promoters to 1,25-Dihydroxyvitamin D3. Journal of Bone and Mineral Research.2006;21(6):886-894.
  10. Bouillon R, Bikle D. Vitamin D Metabolism Revised: Fall of Dogmas. J Bone Miner Res. 2019;34(11):1985-1992.
  11. Roizen JD, Long C, Casella A, O'Lear L, Caplan I, Lai M, Sasson I, Singh R, Makowski AJ, Simmons R, Levine MA. Obesity Decreases Hepatic 25-Hydroxylase Activity Causing Low Serum 25-Hydroxyvitamin D. J Bone Miner Res. 2019;34(6):1068-1073.
  12. Evans RM. The steroid and thyroid hormone receptor superfamily. Science. 1988;240(4854):889-895.
  13. Baker AR, McDonnell DP, Hughes M, Crisp TM, Mangelsdorf DJ, Haussler MR, Pike JW, Shine J, O'Malley BW. Cloning and expression of full-length cDNA encoding human vitamin D receptor. Proceedings of the National Academy of Sciences of the United States of America. 1988;85(10):3294-3298.
  14. Burmester JK, Maeda N, DeLuca HF. Isolation and expression of rat 1,25-dihydroxyvitamin D3 receptor cDNA. Proceedings of the National Academy of Sciences of the United States of America. 1988;85(4):1005-1009.
  15. Ozono K, Sone T, Pike JW. Perspectives: The genomic mechanism of action of 1,25-dihydroxyvitamin D3. Journal of Bone and Mineral Research. 2009;6(10):1021-1027.
  16. Deluca HF. The Metabolism, Physiology, and Function of Vitamin D. Vitamin D: Springer US; 1984:1-68.
  17. Mayer E, Kadowaki S, Williams G, Norman AW. Mode of Action of 1α,25-Dihydroxyvitamin D. Vitamin D: Springer US; 1984:259-302.
  18. Reichel H, Koeffler HP, Norman AW. The Role of the Vitamin D Endocrine System in Health and Disease. New England Journal of Medicine. 1989;320(15):980-991.
  19. Owen TA, Aronow MS, Barone LM, Bettencourt B, Stein GS, Lian JB. Pleiotropic Effects of Vitamin D on Osteoblast Gene Expression Are Related to the Proliferative and Differentiated State of the Bone Cell Phenotype: Dependency upon Basal Levels of Gene Expression, Duration of Exposure, and Bone Matrix Competency in Normal Rat Osteoblast Cultures*. Endocrinology. 1991;128(3):1496-1504.
  20. Pettifor JM, Ross FP, Travers R, Glorieux FH, Deluca HF. Dietary calcium deficiency : A syndrome associated with bone deformities and elevated serum 1,25-Dihyroxyvitamin D concentrations. Metabolic Bone Disease and Related Research. 1981;2(5):301-305.
  21. Teitelbaum SL, Bullough PG. The pathophysiology of bone and joint disease. Am J Pathol. 1979;96(1):282-354.
  22. Parfitt AM, Drezner MK, Glorieux FH, Kanis JA, Malluche H, Meunier PJ, Ott SM, Recker RR. Bone histomorphometry: Standardization of nomenclature, symbols, and units: Report of the asbmr histomorphometry nomenclature committee. Journal of Bone and Mineral Research. 2009;2(6):595-610.
  23. Cole DEC, Carpenter TO, Gundberg CM. Serum osteocalcin concentrations in children with metabolic bone disease. The Journal of Pediatrics. 1985;106(5):770-776.
  24. Roizen JD, Levine MA. Response to: Obesity and Vitamin D Metabolism Modifications. J Bone Miner Res.2019;34(7):1384.
  25. Bikle DD. Vitamin D: Newer Concepts of Its Metabolism and Function at the Basic and Clinical Level. J Endocr Soc. 2020;4(2):bvz038.
  26. Holick MF. McCollum Award Lecture, 1994: Vitamin D—new horizons for the 21st century. The American Journal of Clinical Nutrition. 1994;60(4):619-630.
  27. Holick MF. Environmental factors that influence the cutaneous production of vitamin D. The American Journal of Clinical Nutrition. 1995;61(3):638S-645S.
  28. Lips P. Vitamin D Deficiency and Secondary Hyperparathyroidism in the Elderly: Consequences for Bone Loss and Fractures and Therapeutic Implications. Endocrine Reviews. 2001;22(4):477-501.
  29. Bischoff-Ferrari HA, Giovannucci E, Willett WC, Dietrich T, Dawson-Hughes B. Estimation of optimal serum concentrations of 25-hydroxyvitamin D for multiple health outcomes. The American Journal of Clinical Nutrition.2006;84(1):18-28.
  30. Bischoff-Ferrari HA, Willett WC, Wong JB, Stuck AE, Staehelin HB, Orav EJ, Thoma A, Kiel DP, Henschkowski J. Prevention of Nonvertebral Fractures With Oral Vitamin D and Dose Dependency. Archives of Internal Medicine. 2009;169(6):551.
  31. Krall EA, Sahyoun N, Tannenbaum S, Dallal GE, Dawson-Hughes B. Effect of Vitamin D Intake on Seasonal Variations in Parathyroid Hormone Secretion in Postmenopausal Women. New England Journal of Medicine.1989;321(26):1777-1783.
  32. Thomas MK, Lloyd-Jones DM, Thadhani RI, Shaw AC, Deraska DJ, Kitch BT, Vamvakas EC, Dick IM, Prince RL, Finkelstein JS. Hypovitaminosis D in Medical Inpatients. New England Journal of Medicine.1998;338(12):777-783.
  33. Lips P, Duong T, Oleksik A, Black D, Cummings S, Cox D, Nickelsen T. A Global Study of Vitamin D Status and Parathyroid Function in Postmenopausal Women with Osteoporosis: Baseline Data from the Multiple Outcomes of Raloxifene Evaluation Clinical Trial. The Journal of Clinical Endocrinology &amp; Metabolism.2001;86(3):1212-1221.
  34. Ross AC, Manson JE, Abrams SA, Aloia JF, Brannon PM, Clinton SK, Durazo-Arvizu RA, Gallagher JC, Gallo RL, Jones G, Kovacs CS, Mayne ST, Rosen CJ, Shapses SA. The 2011 Dietary Reference Intakes for Calcium and Vitamin D: What Dietetics Practitioners Need to Know⁎⁎This article is a summary of the Institute of Medicine report entitled Dietary Reference Intakes for Calcium and Vitamin D (available at http://www.iom.edu/Reports/2010/Dietary-Reference-Intakes-for-Calcium-and-Vitamin-D.aspx) for dietetics practitioners; a similar summary for clinicians has also been published (Ross AC, Manson JE, Abrams SA, Aloia JF, Brannon PM, Clinton SK, Durazo-Arvizu RA, Gallagher JC, Gallo RL, Jones G, Kovacs CS, Mayne ST, Rosen CJ, Shapses SA. The 2011 report on Dietary Reference Intakes for calcium and vitamin D from the Institute of Medicine: What clinicians need to know. J Clin Endocrinol Metab. 2011;96:53-58). Journal of the American Dietetic Association. 2011;111(4):524-527.
  35. Holick MF, Binkley NC, Bischoff-Ferrari HA, Gordon CM, Hanley DA, Heaney RP, Murad MH, Weaver CM. Evaluation, Treatment, and Prevention of Vitamin D Deficiency: an Endocrine Society Clinical Practice Guideline. The Journal of Clinical Endocrinology &amp; Metabolism. 2011;96(7):1911-1930.
  36. Khaw KT, Sneyd MJ, Compston J. Bone density parathyroid hormone and 25-hydroxyvitamin D concentrations in middle aged women. BMJ. 1992;305(6848):273-277.
  37. Mezquita-Raya P, Muñoz-Torres M, De Dios Luna J, Luna V, Lopez-Rodriguez F, Torres-Vela E, Escobar-Jiménez F. Relation Between Vitamin D Insufficiency, Bone Density, and Bone Metabolism in Healthy Postmenopausal Women. Journal of Bone and Mineral Research. 2001;16(8):1408-1415.
  38. Collins D, Jasani C, Fogelman I, Swaminathan R. Vitamin D and bone mineral density. Osteoporosis International. 1998;8(2):110-114.
  39. Chapuy MC, Arlot ME, Duboeuf F, Brun J, Crouzet B, Arnaud S, Delmas PD, Meunier PJ. Vitamin D<sub>3</sub>and Calcium to Prevent Hip Fractures in Elderly Women. New England Journal of Medicine.1992;327(23):1637-1642.
  40. Davies M, Mawer EB, Hann JT, Stephens WP, Taylor JL. VITAMIN D PROPHYLAXIS IN THE ELDERLY: A SIMPLE EFFECTIVE METHOD SUITABLE FOR LARGE POPULATIONS. Age and Ageing. 1985;14(6):349-354.
  41. Weisman Y, Schen RJ, Eisenberg Z, Amarilio N, Graff E, Edelstein-Singer M, Goldray D, Harell A. Single Oral High-Dose Vitamin D<sub>3</sub>Prophylaxis in the Elderly. Journal of the American Geriatrics Society.1986;34(7):515-518.
  42. Khaw KT, Scragg R, Murphy S. Single-dose cholecalciferol suppresses the winter increase in parathyroid hormone concentrations in healthy older men and women: a randomized trial. The American Journal of Clinical Nutrition. 1994;59(5):1040-1044.
  43. Heikinheimo RJ, Inkovaara JA, Harju EJ, Haavisto MV, Kaarela RH, Kataja JM, Kokko AM-L, Kolho LA, Rajala SA. Annual injection of vitamin D and fractures of aged bones. Calcified Tissue International. 1992;51(2):105-110.
  44. Prader A, Illig R, Heierli E. [An unusual form of primary vitamin D-resistant rickets with hypocalcemia and autosomal-dominant hereditary transmission: hereditary pseudo-deficiency rickets]. Helv Paediatr Acta.1961;16:452-468.
  45. Fraser D, Kooh SW, Kind HP, Holick MF, Tanaka Y, DeLuca HF. Pathogenesis of Hereditary Vitamin-D-Dependent Rickets. New England Journal of Medicine. 1973;289(16):817-822.
  46. Delvin EE, Glorieux FH, Marie PJ, Pettifor JM. Vitamin D dependency: Replacement therapy with calcitriol. The Journal of Pediatrics. 1981;99(1):26-34.
  47. Labuda M, Morgan K, Glorieux FH. Mapping autosomal recessive vitamin D dependency type I to chromosome 12q14 by linkage analysis. Am J Hum Genet. 1990;47(1):28-36.
  48. Braekeleer MD, Larochelle J. Population genetics of vitamin D-dependent rickets in northeastern Quebec. Annals of Human Genetics. 1991;55(4):283-290.
  49. Fu GK, Lin D, Zhang MYH, Bikle DD, Shackleton CHL, Miller WL, Portale AA. Cloning of Human 25-Hydroxyvitamin D-1α-Hydroxylase and Mutations Causing Vitamin D-Dependent Rickets Type 1. Molecular Endocrinology. 1997;11(13):1961-1970.
  50. St-Arnaud R, Messerlian S, Moir JM, Omdahl JL, Glorieux FH. The 25-Hydroxyvitamin D 1-Alpha-Hydroxylase Gene Maps to the Pseudovitamin D-Deficiency Rickets (PDDR) Disease Locus. Journal of Bone and Mineral Research. 1997;12(10):1552-1559.
  51. Wang JT, Lin CJ, Burridge SM, Fu GK, Labuda M, Portale AA, Miller WL. Genetics of vitamin D 1alpha-hydroxylase deficiency in 17 families. Am J Hum Genet. 1998;63(6):1694-1702.
  52. Yoshida T, Monkawa T, Tenenhouse HS, Goodyer P, Shinki T, Suda T, Wakino S, Hayashi M, Saruta T. Two novel 1α-hydroxylase mutations in French-Canadians with vitamin D dependency rickets type I. Kidney International. 1998;54(5):1437-1443.
  53. Kitanaka S, Takeyama K-i, Murayama A, Sato T, Okumura K, Nogami M, Hasegawa Y, Niimi H, Yanagisawa J, Tanaka T, Kato S. Inactivating Mutations in the 25-Hydroxyvitamin D<sub>3</sub>1α-Hydroxylase Gene in Patients with Pseudovitamin D–Deficiency Rickets. New England Journal of Medicine. 1998;338(10):653-662.
  54. Kitanaka S, Murayama A, Sakaki T, Inouye K, Seino Y, Fukumoto S, Shima M, Yukizane S, Takayanagi M, Niimi H, Takeyama K-i, Kato S. No Enzyme Activity of 25-Hydroxyvitamin D3 1α-Hydroxylase Gene Product in Pseudovitamin D Deficiency Rickets, Including That with Mild Clinical Manifestation. The Journal of Clinical Endocrinology &amp; Metabolism. 1999;84(11):4111-4117.
  55. Smith SJ, Rucka AK, Berry JL, Davies M, Mylchreest S, Paterson CR, Heath DA, Tassabehji M, Read AP, Mee AP, Mawer EB. Novel Mutations in the 1α-Hydroxylase (P450c1) Gene in Three Families with Pseudovitamin D-Deficiency Rickets Resulting in Loss of Functional Enzyme Activity in Blood-Derived Macrophages. Journal of Bone and Mineral Research. 1999;14(5):730-739.
  56. Fu GK, Lin D, Zhang MY, Bikle DD, Shackleton CH, Miller WL, Portale AA. Cloning of human 25-hydroxyvitamin D-1 alpha-hydroxylase and mutations causing vitamin D-dependent rickets type 1. Mol Endocrinol. 1997;11(13):1961-1970.
  57. Glorieux FH, Arabian A, Delvin EE. Pseudo-vitamin D deficiency: absence of 25-hydroxyvitamin D 1 alpha-hydroxylase activity in human placenta decidual cells. The Journal of Clinical Endocrinology &amp; Metabolism. 1995;80(7):2255-2258.
  58. Kitanaka S, Takeyama K, Murayama A, Sato T, Okumura K, Nogami M, Hasegawa Y, Niimi H, Yanagisawa J, Tanaka T, Kato S. Inactivating mutations in the 25-hydroxyvitamin D3 1alpha-hydroxylase gene in patients with pseudovitamin D-deficiency rickets. N Engl J Med. 1998;338(10):653-661.
  59. Yoshida T, Monkawa T, Tenenhouse HS, Goodyer P, Shinki T, Suda T, Wakino S, Hayashi M, Saruta T. Two novel 1alpha-hydroxylase mutations in French-Canadians with vitamin D dependency rickets type I1. Kidney Int. 1998;54(5):1437-1443.
  60. Kitanaka S, Murayama A, Sakaki T, Inouye K, Seino Y, Fukumoto S, Shima M, Yukizane S, Takayanagi M, Niimi H, Takeyama K, Kato S. No enzyme activity of 25-hydroxyvitamin D3 1alpha-hydroxylase gene product in pseudovitamin D deficiency rickets, including that with mild clinical manifestation. J Clin Endocrinol Metab.1999;84(11):4111-4117.
  61. Smith SJ, Rucka AK, Berry JL, Davies M, Mylchreest S, Paterson CR, Heath DA, Tassabehji M, Read AP, Mee AP, Mawer EB. Novel mutations in the 1alpha-hydroxylase (P450c1) gene in three families with pseudovitamin D-deficiency rickets resulting in loss of functional enzyme activity in blood-derived macrophages. J Bone Miner Res. 1999;14(5):730-739.
  62. Winkler I, von Grabe C, Harmeyer J. Pseudo vitamin D deficiency rickets in pigs: in vitro measurements of renal 25-hydroxycholecalciferol-1-hydroxylase activity. Zentralbl Veterinarmed A. 1982;29(2):81-88.
  63. Fox J, Maunder EMW, Randall VA, Care AD. Vitamin D-dependent rickets type I in pigs. Clinical Science.1985;69(5):541-548.
  64. Dardenne O, Prud’homme Je, Arabian A, Glorieux FH, St-Arnaud R. Targeted Inactivation of the 25-Hydroxyvitamin D3-1α-Hydroxylase Gene (CYP27B1) Creates an Animal Model of Pseudovitamin D-Deficiency Rickets*. Endocrinology. 2001;142(7):3135-3141.
  65. Malloy PJ, Tasic V, Taha D, Tutunculer F, Ying GS, Yin LK, Wang J, Feldman D. Vitamin D receptor mutations in patients with hereditary 1,25-dihydroxyvitamin D-resistant rickets. Mol Genet Metab. 2014;111(1):33-40.
  66. Brooks MH, Bell NH, Love L, Stern PH, Orfei E, Queener SF, Hamstra AJ, DeLuca HF. Vitamin-D-Dependent Rickets Type II. New England Journal of Medicine. 1978;298(18):996-999.
  67. Fujita T, Nomura M, Okajima S, Furuya H. Adult-Onset Vitamin D-Resistant Osteomalacia with the Unresponsiveness to Parathyroid Hormone. The Journal of Clinical Endocrinology &amp; Metabolism.1980;50(5):927-931.
  68. Liberman UA, Halabe A, Samuel R, Kauli R, Edelstein S, Weisman Y, Papapoulos SE, Fraher LJ, Clemens TL, O'Riordan JLH. END-ORGAN RESISTANCE TO 1,25-DIHYDROXYCHOLECALCIFEROL. The Lancet.1980;315(8167):504-507.
  69. Marx SJ, Liberman UA, Eil C, Gamblin GT, Degrange DA, Balsan S. Hereditary Resistance to 1,25-Dihydroxyvitamin D. Proceedings of the 1983 Laurentian Hormone Conference: Elsevier; 1984:589-620.
  70. Marx SJ, Bliziotes MM, Nanes M. ANALYSIS OF THE RELATION BETWEEN ALOPECIA AND RESISTANCE TO 1,25-DIHYDROXYVITAMIN D. Clinical Endocrinology. 1986;25(4):373-381.
  71. Bikle DD, Chang S, Crumrine D, Elalieh H, Man MQ, Choi EH, Dardenne O, Xie Z, Arnaud RS, Feingold K, Elias PM. 25 Hydroxyvitamin D 1 α-Hydroxylase Is Required for Optimal Epidermal Differentiation and Permeability Barrier Homeostasis. Journal of Investigative Dermatology. 2004;122(4):984-992.
  72. Stumpf WE, Sar M, Reid FA, Tanaka Y, DeLuca HF. Target Cells for 1,25-Dihydroxyvitamin D <sub>3</sub> in Intestinal Tract, Stomach, Kidney, Skin, Pituitary, and Parathyroid. Science. 1979;206(4423):1188-1190.
  73. Hsieh JC, Sisk JM, Jurutka PW, Haussler CA, Slater SA, Haussler MR, Thompson CC. Physical and functional interaction between the vitamin D receptor and hairless corepressor, two proteins required for hair cycling. J Biol Chem. 2003;278(40):38665-38674.
  74. Balsan S, Garabedian M, Larchet M, Gorski AM, Cournot G, Tau C, Bourdeau A, Silve C, Ricour C. Long-term nocturnal calcium infusions can cure rickets and promote normal mineralization in hereditary resistance to 1,25-dihydroxyvitamin D. J Clin Invest. 1986;77(5):1661-1667.
  75. Li YC, Pirro AE, Amling M, Delling G, Baron R, Bronson R, Demay MB. Targeted ablation of the vitamin D receptor: an animal model of vitamin D-dependent rickets type II with alopecia. Proceedings of the National Academy of Sciences of the United States of America. 1997;94(18):9831-9835.
  76. Yoshizawa T, Handa Y, Uematsu Y, Takeda S, Sekine K, Yoshihara Y, Kawakami T, Arioka K, Sato H, Uchiyama Y, Masushige S, Fukamizu A, Matsumoto T, Kato S. Mice lacking the vitamin D receptor exhibit impaired bone formation, uterine hypoplasia and growth retardation after weaning. Nature Genetics.1997;16(4):391-396.
  77. Li YC, Amling M, Pirro AE, Priemel M, Meuse J, Baron R, Delling G, Demay MB. Normalization of mineral ion homeostasis by dietary means prevents hyperparathyroidism, rickets, and osteomalacia, but not alopecia in vitamin D receptor-ablated mice. Endocrinology. 1998;139(10):4391-4396.
  78. Balsan S, Garabedian M, Liberman UA, Bourdeau A, Eil C, Guillozo H, Grimberg R, Deunff MJL, Lieberherr M, Guimbaud P, Broyer M, Marx SJ. Rickets and Alopecia with Resistance to 1,25-Dihydroxyvitamin D: Two Different Clinical Courses with Two Different Cellular Defects*. The Journal of Clinical Endocrinology &amp; Metabolism. 1983;57(4):803-811.
  79. Murayama A, Takeyama K-i, Kitanaka S, Kodera Y, Kawaguchi Y, Hosoya T, Kato S. Positive and Negative Regulations of the Renal 25-Hydroxyvitamin D3 1α-Hydroxylase Gene by Parathyroid Hormone, Calcitonin, and 1α,25(OH)2D3 in Intact Animals*. Endocrinology. 1999;140(5):2224-2231.
  80. Malloy PJ, Hochberg Z, Pike JW, Feldman D. Abnormal Binding of Vitamin D Receptors to Deoxyribonucleic Acid in a Kindred With Vitamin D-Dependent Rickets, Type II*. The Journal of Clinical Endocrinology &amp; Metabolism. 1989;68(2):263-269.
  81. Malloy PJ, Hochberg Z, Tiosano D, Pike JW, Hughes MR, Feldman D. The molecular basis of hereditary 1,25-dihydroxyvitamin D3 resistant rickets in seven related families. The Journal of clinical investigation.1990;86(6):2071-2079.
  82. Ritchie HH, Hughes MR, Thompson ET, Malloy PJ, Hochberg Z, Feldman D, Pike JW, O'Malley BW. An ochre mutation in the vitamin D receptor gene causes hereditary 1,25-dihydroxyvitamin D3-resistant rickets in three families. Proceedings of the National Academy of Sciences of the United States of America. 1989;86(24):9783-9787.
  83. Takeda E, Yokota I, Ito M, Kobashi H, Saijo T, Kuroda Y. 25-Hydroxyvitamin D-24-Hydroxylase in Phytohemagglutinin-Stimulated Lymphocytes: Intermediate Bioresponse to 1,25-Dihydroxyvitamin D<sub>3</sub>of Cells from Parents of Patients with Vitamin DDependent Rickets type II*. The Journal of Clinical Endocrinology &amp; Metabolism. 1990;70(4):1068-1074.
  84. Tsuchiya Y, Matsuo N, Cho H, Kumagai M, Yasaka A, Suda T, Orimo H, Shiraki M. An Unusual Form of Vitamin D-Dependent Rickets in a Child: Alopecia and Marked End-Organ Hyposensitivity to Biologically Active Vitamin D. The Journal of Clinical Endocrinology &amp; Metabolism. 1980;51(4):685-690.
  85. Takeda E, Kuroda Y, Saijo T, Toshima K, Naito E, Kobashi H, Iwakuni Y, Miyao M. Rapid diagnosis of vitamin D-dependent rickets type II by use of phytohemagglutinin-stimulated lymphocytes. Clinica Chimica Acta.1986;155(3):245-250.
  86. Takeda E, Kuroda Y, Saijo T, Naito E, Kobashi H, Yokota I, Miyao M. 1α-Hydroxyvitamin D3 Treatment of Three Patients With 1,25-Dihydroxyvitamin D-Receptor-Defect Rickets and Alopecia. Pediatrics.1987;80(1):97-101.
  87. Takeda E, Yokota I, Kawakami I, Hashimoto T, Kuroda Y, Arase S. Two siblings with vitamin-D-dependent rickets type II: No recurrence of rickets for 14 years after cessation of therapy. European Journal of Pediatrics.1989;149(1):54-57.
  88. Saijo T, Ito M, Takeda E, Huq AH, Naito E, Yokota I, Sone T, Pike JW, Kuroda Y. A unique mutation in the vitamin D receptor gene in three Japanese patients with vitamin D-dependent rickets type II: utility of single-strand conformation polymorphism analysis for heterozygous carrier detection. Am J Hum Genet.1991;49(3):668-673.
  89. Yagi H, Ozono K, Miyake H, Nagashima K, Kuroume T, Pike JW. A new point mutation in the deoxyribonucleic acid-binding domain of the vitamin D receptor in a kindred with hereditary 1,25-dihydroxyvitamin D-resistant rickets. The Journal of Clinical Endocrinology &amp; Metabolism. 1993;76(2):509-512.
  90. Eil C, Liberman UA, Rosen JF, Marx SJ. A Cellular Defect in Hereditary Vitamin-D-Dependent Rickets Type II: Defective Nuclear Uptake of 1,25-Dihydroxyvitamin D in Cultured Skin Fibroblasts. New England Journal of Medicine. 1981;304(26):1588-1591.
  91. Feldman D, Chen T, Cone C, Hirst M, Shani S, Benderli A, Hochberg, Zeev. VITAMIN D RESISTANT RICKETS WITH ALOPECIA: CULTURED SKIN FIBROBLASTS EXHIBIT DEFECTIVE CYTOPLASMIC RECEPTORS AND UNRESPONSIVENESS TO 1,25(OH)2D3. The Journal of Clinical Endocrinology &amp; Metabolism. 1982;55(5):1020-1022.
  92. Clemens TL, Adams JS, Horiuchi N, Gilchrest BA, Cho H, Tsuchiya Y, Matsuo N, Suda T, Holick MF. Interaction of 1,25-Dihydroxyvitamin-D<sub>3</sub>with Keratinocytes and Fibroblasts from Skin of Normal Subjects and a Subject with Vitamin-D-Dependent Rickets, Type II: A Model for Study of the Mode of Action of 1,25-Dihydroxyvitamin D<sub>3</sub>*. The Journal of Clinical Endocrinology &amp; Metabolism.1983;56(4):824-830.
  93. Griffin JE, Zerwekh JE. Impaired stimulation of 25-hydroxyvitamin D-24-hydroxylase in fibroblasts from a patient with vitamin D-dependent rickets, type II. A form of receptor-positive resistance to 1,25-dihydroxyvitamin D3. The Journal of clinical investigation. 1983;72(4):1190-1199.
  94. Liberman UA, Eil C, Holst P, Rosen JF, Marx SJ. Hereditary Resistance to 1,25-Dihydroxyvitamin D: Defective Function of Receptors for 1,25-Dihydroxy vitamin D in Cells Cultured from Bone*. The Journal of Clinical Endocrinology &amp; Metabolism. 1983;57(5):958-962.
  95. Malloy PJ, Weisman Y, Feldman D. Hereditary 1 alpha,25-dihydroxyvitamin D-resistant rickets resulting from a mutation in the vitamin D receptor deoxyribonucleic acid-binding domain. The Journal of Clinical Endocrinology &amp; Metabolism. 1994;78(2):313-316.
  96. Chen TL, Hirst MA, Cone CM, Hochberg Z, Tietze H-U, Feldman D. 1,25-Dihydroxyvitamin D Resistance, Rickets, and Alopecia: Analysis of Receptors and Bioresponse in Cultured Fibroblasts from Patients and Parents*. The Journal of Clinical Endocrinology &amp; Metabolism. 1984;59(3):383-388.
  97. Hirst MA, Hochman H, Feldman D. Vitamin D Resistance and Alopecia: A Kindred with Normal 1,25-Dihydroxyvitamin D Binding, but Decreased Receptor Affinity for Deoxyribonucleic Acid*. The Journal of Clinical Endocrinology &amp; Metabolism. 1985;60(3):490-495.
  98. Castells S, Greig F, Fusi MA, Finberg L, Yasumura S, Liberman UA, Eil C, Marx SJ. Severely Deficient Binding of 1,25-Dihydroxyvitamin D to Its Receptors in a Patient Responsive to High Doses of This Hormone*. The Journal of Clinical Endocrinology &amp; Metabolism. 1986;63(1):252-256.
  99. Fraher LJ, Karmali R, Hinde FRJ, Hendy GN, Jani H, Nicholson L, Grant D, O'Riordan JLH. Vitamin D-dependent rickets type II: extreme end organ resistance to 1,25-dihydroxy vitamin D3 in a patient without alopecia. European Journal of Pediatrics. 1986;145(5):389-395.
  100. Zhu W, Malloy PJ, Delvin E, Chabot G, Feldman D. Hereditary 1,25-Dihydroxyvitamin D-Resistant Rickets Due to an Opal Mutation Causing Premature Termination of the Vitamin D Receptor. Journal of Bone and Mineral Research. 1998;13(2):259-264.
  101. Malloy PJ, Zhu W, Zhao X-Y, Pehling GB, Feldman D. A Novel Inborn Error in the Ligand-Binding Domain of the Vitamin D Receptor Causes Hereditary Vitamin D-Resistant Rickets. Molecular Genetics and Metabolism.2001;73(2):138-148.
  102. Nguyen TM, Adiceam P, Kottler ML, Guillozo H, Rizk-Rabin M, Brouillard F, Lagier P, Palix C, Garnier JM, Garabedian M. Tryptophan Missense Mutation in the Ligand-Binding Domain of the Vitamin D Receptor Causes Severe Resistance to 1,25-Dihydroxyvitamin D. Journal of Bone and Mineral Research.2002;17(9):1728-1737.
  103. Malloy PJ, Pike JW, Feldman D. The Vitamin D Receptor and the Syndrome of Hereditary 1,25-Dihydroxyvitamin D-Resistant Rickets*. Endocrine Reviews. 1999;20(2):156-188.
  104. Malloy PJ, Xu R, Peng L, Clark PA, Feldman D. A Novel Mutation in Helix 12 of the Vitamin D Receptor Impairs Coactivator Interaction and Causes Hereditary 1,25-Dihydroxyvitamin D-Resistant Rickets without Alopecia. Molecular Endocrinology. 2002;16(11):2538-2546.
  105. Liberman UA, Eil C, Marx SJ. Resistance to 1,25-dihydroxyvitamin D. Association with heterogeneous defects in cultured skin fibroblasts. The Journal of clinical investigation. 1983;71(2):192-200.
  106. Hochberg Z, Benderli A, Levy J, Vardi P, Weisman Y, Chen T, Feldman D. 1,25-dihydroxyvitamin D resistance, rickets, and alopecia. The American Journal of Medicine. 1984;77(5):805-811.
  107. Koren R, Ravid A, Liberman UA, Hochberg Z, Weisman Y, Novogrodsky A. Defective binding and function of 1,25-dihydroxyvitamin D3 receptors in peripheral mononuclear cells of patients with end-organ resistance to 1,25-dihydroxyvitamin D. The Journal of clinical investigation. 1985;76(5):2012-2015.
  108. Liberman UA, Eil C, Marx SJ. Receptor-Positive Hereditary Resistance to 1,25-Dihydroxyvitamin D: Chromatography of Hormone-Receptor Complexes on Deoxyribonucleic Acid-Cellulose Shows Two Classes of Mutation*. The Journal of Clinical Endocrinology &amp; Metabolism. 1986;62(1):122-126.
  109. Hughes MR, Malloy PJ, Kieback DG, Kesterson RA, Pike JW, Feldman D, O'Malley BW. Point mutations in the Human Vitamin D Receptor Gene Associated with Hypocalcemic Rickets. Science. 1988;242(4886):1702-1705.
  110. Sone T, Marx SJ, Liberman UA, Pike JW. A Unique Point Mutation in the Human Vitamin D Receptor Chromosomal Gene Confers Hereditary Resistance to 1,25-Dihydroxyvitamin D<sub>3</sub>. Molecular Endocrinology. 1990;4(4):623-631.
  111. Barsony J, Pike JW, DeLuca HF, Marx SJ. Immunocytology with microwave-fixed fibroblasts shows 1 alpha,25-dihydroxyvitamin D3-dependent rapid and estrogen-dependent slow reorganization of vitamin D receptors. J Cell Biol. 1990;111(6 Pt 1):2385-2395.
  112. Sone T, Scott RA, Hughes MR, Malloy PJ, Feldman D, O'Malley BW, Pike JW. Mutant vitamin D receptors which confer hereditary resistance to 1,25-dihydroxyvitamin D3 in humans are transcriptionally inactive in vitro. Journal of Biological Chemistry. 1989;264(34):20230-20234.
  113. Hawa NS, Cockerill FJ, Vadher S, Hewison M, Rut AR, Pike JW, O'Riordan JLH, Farrow SM. Identification of a novel mutation in hereditary vitamin D resistant rickets causing exon skipping. Clinical Endocrinology.1996;45(1):85-92.
  114. Mechica JB, Leite MOR, Mendonca BB, Frazzatto EST, Borelli A, Latronico AC. A Novel Nonsense Mutation in the First Zinc Finger of the Vitamin D Receptor Causing Hereditary 1,25-Dihydroxyvitamin D<sub>3</sub>-Resistant Rickets. The Journal of Clinical Endocrinology &amp; Metabolism. 1997;82(11):3892-3894.
  115. Cockerill FJ, Hawa NS, Yousaf N, Hewison M, O’Riordan JLH, Farrow SM. Mutations in the Vitamin D Receptor Gene in Three Kindreds Associated with Hereditary Vitamin D Resistant Rickets. The Journal of Clinical Endocrinology &amp; Metabolism. 1997;82(9):3156-3160.
  116. Kristjansson K, Rut AR, Hewison M, O'Riordan JL, Hughes MR. Two mutations in the hormone binding domain of the vitamin D receptor cause tissue resistance to 1,25 dihydroxyvitamin D3. The Journal of clinical investigation. 1993;92(1):12-16.
  117. Wiese RJ, Goto H, Prahl JM, Marx SJ, Thomas M, Al-Aqeel A, DeLuca HF. Vitamin D-dependency rickets type II: truncated vitamin D receptor in three kindreds. Molecular and Cellular Endocrinology. 1993;90(2):197-201.
  118. Rochel N, Wurtz JM, Mitschler A, Klaholz B, Moras D. The Crystal Structure of the Nuclear Receptor for Vitamin D Bound to Its Natural Ligand. Molecular Cell. 2000;5(1):173-179.
  119. Zhou Y, Wang J, Malloy PJ, Dolezel Z, Feldman D. Compound heterozygous mutations in the vitamin D receptor in a patient with hereditary 1,25-dihydroxyvitamin D-resistant rickets with alopecia. Journal of bone and mineral research : the official journal of the American Society for Bone and Mineral Research.2009;24(4):643-651.
  120. Malloy PJ, Eccleshall TR, Gross C, Van Maldergem L, Bouillon R, Feldman D. Hereditary vitamin D resistant rickets caused by a novel mutation in the vitamin D receptor that results in decreased affinity for hormone and cellular hyporesponsiveness. The Journal of clinical investigation. 1997;99(2):297-304.
  121. Hewison M, Rut AR, Kristjansson K, Walker RE, Dillon MJ, Hughes MR, O'Riordan JLH. Tissue resistance to 1,25-dihydroxyvitamin D without a mutation of the vitamin D receptor gene. Clinical Endocrinology.1993;39(6):663-670.
  122. Whitfield GK, Selznick SH, Haussler CA, Hsieh JC, Galligan MA, Jurutka PW, Thompson PD, Lee SM, Zerwekh JE, Haussler MR. Vitamin D receptors from patients with resistance to 1,25-dihydroxyvitamin D3: point mutations confer reduced transactivation in response to ligand and impaired interaction with the retinoid X receptor heterodimeric partner. Molecular Endocrinology. 1996;10(12):1617-1631.
  123. Barsony J, McKoy W, DeGrange DA, Liberman UA, Marx SJ. Selective expression of a normal action of the 1,25-dihydroxyvitamin D3 receptor in human skin fibroblasts with hereditary severe defects in multiple actions of that receptor. The Journal of clinical investigation. 1989;83(6):2093-2101.
  124. Freedman LP. Increasing the Complexity of Coactivation in Nuclear Receptor Signaling. Cell. 1999;97(1):5-8.
  125. Lin NU, Malloy PJ, Sakati N, al-Ashwal A, Feldman D. A novel mutation in the deoxyribonucleic acid-binding domain of the vitamin D receptor causes hereditary 1,25-dihydroxyvitamin D-resistant rickets. The Journal of Clinical Endocrinology &amp; Metabolism. 1996;81(7):2564-2569.
  126. Rut AR, Hewlson Y, Kristjansson K, Luisl B, Hughes MR, O'Riordan JLH. Two mutations causing vitamin D resistant rickets: modelling on the basis of steroid hormone receptor DNA-binding domain crystal structures. Clinical Endocrinology. 1994;41(5):581-590.
  127. Gamblin GT, Liberman UA, Eil C, Downs RW, Jr., DeGrange DA, Marx SJ. Vitamin D-dependent rickets type II. Defective induction of 25-hydroxyvitamin D3-24-hydroxylase by 1,25-dihydroxyvitamin D3 in cultured skin fibroblasts. The Journal of clinical investigation. 1985;75(3):954-960.
  128. Balsan S, Garabédian M, Larchet M, Gorski AM, Cournot G, Tau C, Bourdeau A, Silve C, Ricour C. Long-term nocturnal calcium infusions can cure rickets and promote normal mineralization in hereditary resistance to 1,25-dihydroxyvitamin D. The Journal of clinical investigation. 1986;77(5):1661-1667.
  129. Barsony J, Marx SJ. Receptor-mediated rapid action of 1 alpha,25-dihydroxycholecalciferol: increase of intracellular cGMP in human skin fibroblasts. Proceedings of the National Academy of Sciences of the United States of America. 1988;85(4):1223-1226.
  130. Ritchie HH, Hughes MR, Thompson ET, Malloy PJ, Hochberg Z, Feldman D, Pike JW, O'Malley BW. An ochre mutation in the vitamin D receptor gene causes hereditary 1,25-dihydroxyvitamin D3-resistant rickets in three families. Proc Natl Acad Sci U S A. 1989;86(24):9783-9787.
  131. Malloy PJ, Hochberg Z, Tiosano D, Pike JW, Hughes MR, Feldman D. The molecular basis of hereditary 1,25-dihydroxyvitamin D3 resistant rickets in seven related families. J Clin Invest. 1990;86(6):2071-2079.
  132. Lin JP, Uttley WS. Intra-atrial calcium infusions, growth, and development in end organ resistance to vitamin D. Arch Dis Child. 1993;69(6):689-692.
  133. Bliziotes M, Yergey AL, Nanes MS, Muenzer J, Begley MG, Vieira NE, Kher KK, Brandi ML, Marx SJ. Absent Intestinal Response to Calciferols in Hereditary Resistance to 1,25-Dihydroxyvitamin D: Documentation and Effective Therapy With High Dose Intravenous Calcium Infusions*. The Journal of Clinical Endocrinology &amp; Metabolism. 1988;66(2):294-300.
  134. Weisman Y, Bab I, Gazit D, Spirer Z, Jaffe M, Hochberg Z. Long-term intracaval calcium infusion therapy in end-organ resistance to 1,25-dihydroxyvitamin D. The American Journal of Medicine. 1987;83(5):984-990.
  135. Sakati N, Woodhouse NJY, Niles N, Harfi H, de Grange DA, Marx S. Hereditary Resistance to 1,25-Dihydroxyvitamin D: Clinical and Radiological Improvement during High-Dose Oral Calcium Therapy. Hormone Research. 1986;24(4):280-287.
  136. Adams JS, Gacad MA. Phenotypic Diversity of the Cellular 1,25-Dihydroxyvitamin D<sub>3</sub>-Receptor Interaction Among Different Genera of New World Primates. The Journal of Clinical Endocrinology &amp; Metabolism. 1988;66(1):224-229.
  137. Liberman UA, de Grange D, Marx SJ. Low affinity of the receptor for 1α, 25-dihydroxyvitamin D<sub>3</sub> in the marmoset, a new world monkey. FEBS Letters. 1985;182(2):385-388.
  138. Shinki T, Shiina Y, Takahashi N, Tanioka Y, Koizumi H, Suda T. Extremely high circulating levels of 1α,25-dihydroxyvitamin D3 in the marmoset, a new world monkey. Biochemical and Biophysical Research Communications. 1983;114(2):452-457.
  139. Takahashi N, Suda S, Shinki T, Horiuchi N, Shiina Y, Tanioka Y, Koizumi H, Suda T. The mechanism of end-organ resistance to 1 alpha,25-dihydroxycholecalciferol in the common marmoset. Biochem J.1985;227(2):555-563.
  140. Gacad MA, Adams JS. Identification of a competitive binding component in vitamin D-resistant new world primate cells with a low affinity but high capacity for 1,25-dihydroxyvitamin D3. Journal of Bone and Mineral Research. 2009;8(1):27-35.
  141. Arbelle JE, Chen H, Gaead MA, Allegretto EA, Pike JW, Adams JS. Inhibition of vitamin D receptor-retinoid X receptor-vitamin D response element complex formation by nuclear extracts of vitamin D-resistant New World primate cells. Endocrinology. 1996;137(2):786-789.
  142. Lipsett MB, Chrousos GP, Tomita M, Brandon DD, Loriaux DL. The Defective Glucocorticoid Receptor in Man and Nonhuman Primates. Proceedings of the 1984 Laurentian Hormone Conference: Elsevier; 1985:199-247.
  143. Gacad MA, Chen H, Arbelle JE, LeBon T, Adams JS. Functional characterization and purification of an intracellular vitamin D-binding protein in vitamin D-resistant new world primate cells. Amino acid sequence homology with proteins in the hsp-70 family. J Biol Chem. 1997;272(13):8433-8440.
  144. Chen H, Hu B, Gacad MA, Adams JS. Cloning and expression of a novel dominant-negative-acting estrogen response element-binding protein in the heterogeneous nuclear ribonucleoprotein family. J Biol Chem.1998;273(47):31352-31357.
  145. Chen H, Hewison M, Hu B, Adams JS. Heterogeneous nuclear ribonucleoprotein (hnRNP) binding to hormone response elements: a cause of vitamin D resistance. Proc Natl Acad Sci U S A. 2003;100(10):6109-6114.
  146. Chen CH, Sakai Y, Demay MB. Targeting Expression of the Human Vitamin D Receptor to the Keratinocytes of Vitamin D Receptor Null Mice Prevents Alopecia. Endocrinology. 2001;142(12):5386-5389.
  147. Bikle DD, Chang S, Crumrine D, Elalieh H, Man MQ, Choi EH, Dardenne O, Xie Z, Arnaud RS, Feingold K, Elias PM. 25 Hydroxyvitamin D 1 alpha-hydroxylase is required for optimal epidermal differentiation and permeability barrier homeostasis. J Invest Dermatol. 2004;122(4):984-992.

Pathogenesis of Type 1 Diabetes

Dana VanBuecken and Sandra Lord contributed equally to this submission

ABSTRACT


Type 1A diabetes (T1D) represents an autoimmune disorder that can affect individuals from within a year of birth until age 60. A number of genes strongly influence the development of disease, including genes found within the human lymphocyte antigen (HLA) complex. The role of non-HLA genes is being defined in recent studies, and we are beginning to identify pathways that lead to autoimmunity and eventually pancreatic islet cell destruction. Although genes can predispose one to type 1A diabetes, environmental factors may also play a significant role in the pathogenesis. These as-yet-undefined factors appear to have accelerated the onset and markedly increased the frequency of disease in many populations around the world over the last 30 years. The development of ever more sophisticated immunoassays to detect antibodies directed against pancreatic antigens have helped define the autoimmune nature of the disorder, but as importantly have also provided an opportunity to identify those individuals with prediabetes and to stratify their risk of developing overt hyperglycemia. Immunologic assays as well as intervention trials are allowing us to learn more about the immune pathways that are disordered and offer hope for future therapeutic approaches to prevent and reverse type 1A diabetes.


INTRODUCTION


In the U.S. alone, more than one million people are living with type 1 diabetes (TID) and approximately 80 people per day, or 30,000 individuals per year, are newly diagnosed (1, 2). Recent epidemiological studies demonstrate that the global T1D incidence is increasing at a rate of approximately 3-4% per year, notably among younger children (3, 4). Despite improvements in insulins, insulin delivery methods, and home glucose monitoring, the vast majority of those with T1D do not achieve recommended levels of glycemic control.  This is particularly true in childhood and adolescence, where a recent U.S. study reported mean HbA1c values exceeding 9.5%, and a high frequency of both DKA and severe hypoglycemia (5). In addition to the increased risk of morbidity and mortality, TID places significant emotional and financial burdens on individuals, families, and society. These realities highlight the need for both better TID therapies and the continued push towards the prevention of TID. In recent decades, research efforts have described the natural history of type 1 diabetes and expanded the ability to identify individuals at risk for the disease even before clinical onset, via the recognition of genetic markers or TID-specific autoantibodies. The increasing ability to identify the at-risk population affords researchers the opportunity to intervene at progressively earlier stages in the disease.  With the understanding that established islet autoimmunity, confirmed by the presence of multiple T1D autoantibodies, inevitably leads to clinical TID, investigative efforts are shifting towards the prevention or modification of autoimmunity.  Furthermore, with the mounting evidence that any amount of residual C-peptide improves long term clinical outcomes in TID, some therapies aim to preserve remaining beta cell function in those with clinical disease. In this chapter, we review the epidemiology of TID and the genetic and environmental risk factors for T1D.


EPIDEMIOLOGY OF DIABETES


T1D, or autoimmune diabetes, represents 5-10% of diabetes, and like autoimmunity in general, TID is increasing worldwide. The increase likely is attributable to environmental factors or epigenetic changes, as genetic changes don’t occur rapidly enough to explain such a dramatic increase. The SEARCH for Diabetes in Youth Study is a multicenter observational study investigating trends in incidence and prevalence of diabetes in American youth < age 20.  SEARCH data suggests that the prevalence of TID among non-Hispanic white youth is ~1/300 in the US by age 20 years (6). Between 2002 and 2009, the incidence of TID among non-Hispanic white youth < age 20 years increased by an average of 2.7% per year (7). Similarly, the EURODIAB study evaluated TID incidence trends in 17 European countries from 1989-2003 in youth < age 15 years, and found an average annual incidence increase of 3.9%. This trend predicts a 70% increase in TID prevalence between 2005-2020 among European youth < 15 years old (8) with the peak of diagnosis between ages 10-14 (9). While incidence and prevalence are well documented in children, TID occurs in adults as well, at a frequency that is less certain; estimates are that 25-50% of all TID cases are diagnosed in adulthood. The uncertainty likely is due to a less dramatic clinical presentation than is typically seen in children who present with TID. The incidence of TID varies tremendously by geographic location, with higher rates generally seen in countries located farther from the equator. Worldwide incidence data was reported in 2000 by the DIAMOND project (10), a WHO-sponsored effort to address the public health implications of TID. The incidence of TID between 1990 and 1994 in 50 countries is shown in Figure 1. Between 1990 and 1994, the incidence of TID in individuals aged 0-14 years in both Finland and Sardinia was 37/100,000 individuals, whereas the incidence in both China and Venezuela was 0.1/100,000 individuals, a 350-fold difference. The increased incidence coupled with reduced early mortality has contributed to the increasing prevalence of disease. 


Figure 1. Worldwide incidence of TID 1990-1994, used with permission from International Diabetes Federation.


WHAT IS THE RISK OF TYPE 1 DIABETES?


As is true for Cindy, 85% of individuals who develop TID have no family history of TID; nonetheless, a family history of the disease does increase an individual’s relative risk.  The prevalence of TID in the US non-Hispanic white population by age 20 is ~0.3%, as compared with ~5% of those with a relative with TID, a 15-fold increase in relative risk.   This relative risk is depicted in Figure 2.


Figure 2. Among 300 people without a family member with diabetes, 1 will have TID. Among 300 people with a family member with diabetes, 15 will have TID.


The risk of TID among family members varies depending on who the affected family member is, as shown in Table 1.  


Table 1. Prevalence of TID in Individuals with a Family History of TID

Relative with TID

Prevalence at age 20

Reference

Mother

2%

(11, 12)

Father

6%

(11, 12)

Non-twin sibling

6%

(13)

Dizygotic (fraternal) twin

10%

(13, 14)

Monozygotic (identical) twin

>50%

(15)


The heritability pattern suggests that both genes and environment contribute to risk.  Curiously, the risk of TID in offspring is higher if the father has TID (~6%) as compared to if the mother has TID (~2%) (11, 12). Moreover, the risk to a dizygotic twin is slightly higher (~10%) than is the risk to a non-twin sibling with similar HLA risk genes (~6%) (13, 14) suggesting that the intrauterine environment and/or similar early life exposures may be important. Lastly, the risk to a monozygotic twin is upwards of ~50%; surprisingly the second twin’s diagnosis may occur many decades after the index twin, highlighting the complexities of gene and environmental interactions that underlie the disease (15).


THE NATURAL HISTORY TYPE 1 DIABETES


It is now understood that TID is an immune-mediated disease that begins in the setting of genetic predisposition and then progresses along a predictable path: early islet autoimmunity (one autoantibody), established islet autoimmunity (two or more autoantibodies), abnormal glucose tolerance, clinical TID with some remaining beta cell function, and finally, little or no remaining beta cell function. This understanding comes from decades of effort by multiple investigators and from participation by thousands of patients with TID and their family members.  George Eisenbarth’s description of TID as a chronic autoimmune disease, manifested by autoimmunity and a gradual linear fall in beta cell function until there is insufficient beta cell mass to suppress symptomatic hyperglycemia, has served for decades as the TID natural history paradigm (16). The “Eisenbarth” model has undergone refinements in recent years; namely, although autoimmunity and beta cell dysfunction do appear prior to diagnosis, these changes are often step-wise and non-linear.  Furthermore, beta cell destruction may not be absolute.  Nonetheless, the paradigm is largely correct and serves as the underlying rationale for TID trials. 


The long pre-symptomatic natural history of TID presents an opportunity to intervene earlier than is done currently. Diabetes-specific autoantibodies can appear many years before clinical diagnosis and may reliably be used to predict disease progression. In 2015, JDRF, the Endocrine Society, and the American Diabetes Association proposed a new TID staging system which underscores that TID begins with islet autoimmunity rather than with symptomatic hyperglycemia (17). Stage 1 TID is defined as the presence of 2 or more autoantibodies with normoglycemia; stage 2 TID is 2 or more autoantibodies, impaired glucose tolerance, and no symptoms; stage 3 TID is clinical disease. The staging system is depicted in figure 3.  


HOW TO DETERMINE RISK OF TID


Risk of TID may be determined by the identification of autoantibodies, usually in those identified as having genetic risk through HLA testing or by family history. Autoantibodies are detectable years before the onset of clinical TID. 


Determining Risk: Genes


With the knowledge that TID runs in families and with advances in technology, investigators have described the genetic risk of TID.  TID risk is strongly linked to HLA class II DR3 and DR4 haplotypes, with the highest risk in those with the DR3/DR4 genotype.  The importance of HLA genes to TID risk highlights the role of the adaptive immune system in the development of autoimmunity.  Newer studies have discovered multiple other genes that also contribute to TID risk (18). They are largely genes known also to impact immune function; however, their contribution is dwarfed by the impact of HLA genes. Interestingly, recent work suggests that HLA genes primarily contribute to development of autoantibodies, while non-HLA genes and environmental factors may be more important in the progression from autoantibodies to clinically overt disease (19, 20). The description of non-HLA risk genes (such as the genes for insulin, a major TID autoantigen) highlights other potential pathways to disease and potential therapies. 

Although the contribution of HLA class II risk genes overwhelms the contribution of non-HLA risk genes, the HLA contribution may be decreasing as the overall incidence of TID increases.  This suggests that in a population with non-HLA genetic susceptibility, the environment may have become more conducive to the development of TID. This was reported in a 2004 Lancet article by Gillespie, et al., in which the investigators compared the frequency of HLA class II haplotypes in a UK cohort of 194 individuals diagnosed with TID between 1922-1946 (the Golden Years cohort) to a cohort of 582 individuals diagnosed between 1985-2002 (the BOX cohort) (21). In this comparison, shown in Figure 4, 47% of individuals in the Golden Years cohort were positive for the highest risk genotype DR3-DQ2/DR4-DQ8, compared to 35% of individuals in the BOX cohort.


Figure 4. Decreased contribution of high-risk HLA haplotypes over time. HLA class II haplotypes in Golden Years and BOX cohorts, adapted from Gillespie et.al Lancet 2004 (21).


Determining Risk: Family History And Islet Cell Autoantibodies


Natural history studies of relatives such as Diabetes Prevention Trial (DPT-1) and Diabetes TrialNet Pathway to Prevention have helped define the risk of TID in those with a family history of TID.  Since 2000, Diabetes TrialNet has screened over 200,000 relatives of people with TID, aiming to enroll at-risk individuals in prevention trials.  Among relatives of people with TID, ~5% will have at least one of five islet autoantibodies (22). TrialNet screens for islet cell antibodies (ICA), autoantibodies to insulin (IAA or mIAA), antibodies to a tyrosine phosphatase (IA-2; previously ICA512), antibodies to glutamic acid decarboxylase (GAD), and antibodies to a zinc transporter (ZnT8).  With each additional autoantibody, the risk of TID increases predictably. Unsurprisingly, those with islet autoimmunity and abnormal glucose tolerance are at an even further increased risk of symptomatic T1D. The TrialNet strategy to identify islet autoimmunity among relatives of individuals with TID is shown in Figure 5. There are many other screening efforts ongoing outside of TrialNet. (23-25)


Figure 5. Diabetes TrialNet process for identifying relatives with islet autoimmunity.


Natural history studies have shown not only that islet autoimmunity predicts TID risk, but also that islet autoantibodies usually appear early in life; 64% of babies destined to develop T1D before puberty will have antibodies by age 2 and 95% by age 5 (26). Furthermore, the data from both prospective birth cohort studies (27) and cross-sectional studies (28-31) is remarkably consistent and suggests that the risk of progression from established autoimmunity to clinical TID is in the range of 40% after 5 years, 70% after 10 years, and 85% after 15 years. This risk over time is depicted in Figure 6. The key understanding from natural history studies is that essentially all individuals with confirmed islet autoimmunity will eventually develop clinical T1D at a rate of 11% per year.


Figure 6. Established islet autoimmunity inevitably progresses to clinical T1D. Extrapolated data from multiple studies in genetically at-risk individuals; Ziegler et al. JAMA 2013; DPT-1 Study Group Diabetes 1997; Sosenko et al. Diabetes Care 2014; Mahon et al. Pediatric Diabetes 2009.


Identifying individuals with islet autoimmunity has two potential benefits; namely, the opportunity to monitor closely for disease progression, conferring a reduced risk of morbidity and mortality at the time of TID diagnosis, and the identification of individuals who are eligible for prevention trials.  It is perhaps underappreciated that there is potentially a direct clinical benefit to identifying those with islet autoimmunity.  Individuals with islet autoimmunity followed regularly until clinical diagnosis present with lower HbA1c and experience less DKA than those diagnosed in the community (Table 2) (32-36). For this reason, since 2009, the ADA has recommended that all individuals with a relative with T1D be counseled about the opportunity to be screened for diabetes autoantibodies in the context of a clinical research trial (37).


Table 2.  Individuals Diagnosed with T1D While Enrolled in a Clinical Trial have Less Morbidity at the Time of Diagnosis. (32-36)


STUDY

HbA1c at time of TID diagnosis

% with DKA at time of TID diagnosis


Enrolled in study

Usual care

Enrolled in study

Usual care

SEARCH


25.5%

BABYDIAB

8.6%

11.0%

3.3%

29.1%

DPT-1

6.4%


3.7%


DAISY

7.2%

10.9%

< 4%


TEDDY < age 5


13.1%


SEARCH < age 5


36.4%

BABYDIAB < age 5


32.3%


STRATEGIES TO BRING SCREENING FOR RISK TO CLINICAL PRACTICE


Screening relatives does identify a population of those at risk for clinical T1D; however, at least 85% who get T1D have no relatives with disease.  Thus, to truly prevent all T1D, testing of the general population would have to occur. This could be done with current technology by testing all babies for genetic (HLA) risk at birth and then following with antibody testing. The Population Level Estimate of type 1 Diabetes risk Genes in children (PLEDGE) study enrolls newborns from the general population and offers one-time genetic testing and follow-up autoantibody testing at 2 and 4 years of age (38). The study aims to demonstrate feasibility and to develop evidence to support eventual inclusion of a T1D screening program in standard primary care.


Other studies, such as The Environmental Determinants of Diabetes in the Young (TEDDY) study, the Diabetes Autoimmunity Study in the Young (DAISY), and the Global Platform for the Prevention of Autoimmune Diabetes (GPPAD) are exploring similar methodologies to screen and monitor for risk (24, 39, 40).  However, with an increasing number of individuals developing T1D even without the high-risk HLA types, such approaches may still miss some destined to develop disease. 


An alternative risk detection strategy for those without a family history may be to perform point-of-care antibody testing in a routine pediatric visit.  Since almost all who will develop diabetes before puberty will have antibodies by age 5; such testing could be done at age 4-5 and perhaps once again in the teenage years.  This method will still miss those who develop T1D before this age, but would likely be a cost-effective approach to finding those at risk.  If these at-risk subjects are monitored regularly until development of clinical disease they would benefit from reduced morbidity at time of diagnosis even if a prevention therapy were not yet available.


There are many ongoing projects aimed at screening members of the general population for diabetes autoantibodies even without prior HLA testing (23, 25, 41, 42).


As risk-screening programs employ varying assays and recruit from different populations, interpretation and translation of results is unclear. It is not yet known whether those found to be autoantibody positive through one program will experience the same rates of T1D progression and/or benefit from the same therapies as individuals who have participated in other screening and intervention efforts.


Source: (37).


PRENATAL INFLUENCES  


The prenatal environment can have profound effects on the developing fetus. With the recognition that antibodies often develop early in life and that essentially all those with established islet autoimmunity (two or more autoantibodies) will eventually develop TID, investigators have looked to the prenatal period to search for factors that could contribute to disease development in utero.  As shown in Table 3, decades of observational studies have yielded inconsistent results.  Yet this remains an important area of investigation and one that may lead to primary prevention strategies for T1D. The Environmental Determinants of Islet Autoimmunity (ENDIA) study is an ongoing prospective birth cohort study in Australia that enrolled infants and unborn infants of first degree relatives with T1D. Biologic samples including blood, stool, and saliva will be collected longitudinally for investigation of factors including viral exposures during pregnancy and early childhood, maternal and fetal microbiome, delivery method, maternal and early infant nutrition, pregnancy and early childhood body weight, and both innate and adaptive immune function. In 2018, the ENDIA study completed target enrollment of ~1500 subjects, who will be followed regularly until the development of islet autoimmunity (43).


Table 3.  Potential Prenatal Influences on TID Risk

Pre-natal or intrauterine exposure

Relative risk to offspring

Reference

Maternal age

Inconsistent data

(44-46)

Birth weight > 2 SD above norm (~4000g)

Inconsistent data

(47-51)

Birth weight < 2 SD below norm (~2500g)

Inconsistent data

(49-51)

Birth order: second and later born

Inconsistent data

(46, 52, 53)

Birth interval < 3 years

Inconsistent data

(46, 54)

Caesarean delivery

Inconsistent data

(51, 55, 56)

Pre-eclampsia

Inconsistent data

(51, 57)

Pre-term delivery (<37 weeks gestation)

Inconsistent data

(51, 58)

Maternal vitamin D supplementation

Inconsistent data

(59-62)

Maternal antibiotic use

No association

(53, 63)

maternal BMI/pregnancy weight gain

No association

(51, 64)

Maternal omega 3 fatty acid supplementation

No association

(60, 65, 66)


Source: (67).


Investigators also have studied the early childhood period for clues to the causes of islet autoimmunity and TID; these have included both observational studies and randomized clinical trials. Such influences might be divided into early nutritional exposures and early microbial/infectious exposures, both of which can affect development of the normal immune system.


The inconsistent findings relating to environmental factors reported from observational studies and clinical trials led to the design and implementation of a large international comprehensive evaluation of genetically at-risk babies using cutting edge technologies to study genetics, genomics (gene function), metabolomics, and the microbiome. The Environmental Determinants of Diabetes in the Young (TEDDY) is an international prospective birth cohort study that recruited almost 8,000 babies at increased risk for TID (based on HLA and family history) from Finland, Germany, Sweden, and the US from 2004-2010.  Information on environmental exposures such as diet (including breastfeeding history), infections, vaccinations, and psychosocial stressors will be collected. Participants will be followed until the age of 15 for the development of islet autoimmunity or TID. The wealth of data from this study will provide a foundation for future randomized clinical trials (24). One interesting finding reported in December 2019 is that there are subtle differences in the gut microbiome—such as, persistent stool enterovirus B species--in children who develop islet autoimmunity compared to children who do not develop autoimmunity (68).


EARLY NUTRITIONAL EXPOSURES


Breastfeeding


The hypothesis that human breastmilk may protect against future TID development was presented as early as 1984 (69). Since then, there have been several prospective cohort studies to suggest that breastmilk lowers the risk of islet autoimmunity and TID, including the German BABYDIAB/BABYDIET study (70), the Colorado-based DAISY study (71), and the Norwegian MIDIA study (72), but others show no effect (73).  Although the data on whether breastmilk is protective against TID isn’t clear, it certainly isn’t harmful.  Given the well-established general benefits of breastfeeding, patients may safely be advised to follow the American Academy of Pediatrics’ guidelines related to infant feeding. The mechanism by which breastmilk may lower the risk of TID is uncertain, but one theory suggests that breastmilk has positive effects on the infant microbiome. The microbiome is discussed in greater detail below.  


Cow’s Milk And Bovine Insulin Exposure


In contrast to considering breastfeeding as potentially beneficial in protecting against autoimmunity, it was hypothesized that early introduction of cow’s milk or cow protein might accelerate disease.  This concept was tested in the Trial to Reduce IDDM in the Genetically at Risk (TRIGR) which asked whether weaning to hydrolyzed casein (which is free of bovine proteins including insulin) formula (n=1081) instead of regular cow’s milk formula (n=1078) in genetically at-risk infants could prevent or delay TID.  Though the TRIGR pilot study was suggestive of benefit, no benefit was seen in the fully powered study (74) (75). Similarly, The Finnish Dietary Intervention Trial for the Prevention of Type 1 Diabetes of (FINDIA) suggested that weaning to hydrolyzed cow’s milk formula was not effective in reducing the appearance of autoantibodies, though they did report that a patented cow’s milk formula specifically removing bovine insulin appeared to be beneficial in this pilot study (76).  While additional studies may be informative, current data does not support that weaning to hydrolyzed cow’s milk formula is protective against islet autoimmunity. 


Gluten Exposure


Both BABYDIAB (77) and DAISY (78) were observational studies that suggested an association between introduction of gluten and islet autoimmunity.  However, these studies had different results as to the timing of gluten introduction. Similarly, no effect was found in the BABYDIET study; a randomized controlled trial that asked whether delayed introduction of gluten to 6 vs 12 months would affect the risk of diabetes autoimmunity (79, 80).


Vitamin D And/Or Omega 3 Fatty Acids


Vitamin D is an important component of a normal immune response; moreover, the higher incidence of TID in northern climates suggests that vitamin D deficiency could contribute to autoimmunity and TID.  However, data from observational studies is mixed on whether vitamin D and/or omega 3 supplementation is beneficial or not (60, 81-86). A pilot randomized trial of omega 3 supplementation to pregnant mothers and infants failed to demonstrate a profound immunologic effect of treatment (87). With routine vitamin D supplementation recommended for infants (88), it is unlikely that a fully powered randomized trial would be feasible to assess the impact on autoimmunity. 


MICROBIAL EXPOSURES


The Hygiene Hypothesis


Parallel to the rising incidence of TID and other autoimmune diseases, there has been a worldwide trend towards urbanization, increased standard of living, smaller family sizes, less crowded living conditions, safer water and food supplies, less cohabitation with animals, wide use of antibiotics, childhood vaccination, etc.  While these trends are generally considered improvements in human existence, the so-called “hygiene hypothesis,” proposed by Strachan in 1989 (89) suggests a possible downside; that is, that early microbial exposures might have a protective effect via the early education of the immune system and the development of normal tolerance to self-antigens. Data cited in support of the hygiene hypothesis comes from comparisons between eastern Finland and Russian Karelia (Figure 7) (90-92).


Figure 7. Border between Finland and Russian Karelia, with a 6-fold difference in the incidence of TID, from "Karelia today”. The countries share a common border and ancestry and thus have similar geography, climate, vitamin D levels, and prevalence of HLA risk haplotypes. However, Finland has 6-fold higher incidence of TID. This markedly higher rate of TID is accompanied by a much lower rate of infectious disease. In Finland as compared to Karelia 2% vs 24% had hepatitis A; 5% vs 24% had toxoplasma gondii; and 5% vs. 73% for helicobacter pylori. There is an ongoing study aiming to better understand the mechanisms that may underlie these differences.


The Microbiome


Another possible interface between microbial exposure and human disease is through the microbiome; that is the gut flora established within the first 3 years of life (93).  It has been hypothesized that perturbations in normal early microbiome development might pre-dispose to disease whether through direct modulation of innate immunity or via alteration of intestinal permeability and the downstream effects on adaptive immunity. Interestingly, it appears that the gut microbiome is less diverse and less “protective” in individuals with islet autoimmunity or recent onset TID (94-96).  Whether this difference is cause, effect, or correlation isn’t known. Nonetheless, multiple factors might affect the early intestinal microbiome, some of which also have been shown to correlate with risk of islet autoimmunity and TID.  For example, breastfeeding can alter the intestinal microbiome of the infant by increasing the number and diversity of beneficial microbiota (97, 98). As previously discussed, multiple prospective observational studies suggest that breastfeeding protects against future development of islet autoimmunity and TID, but there’s no evidence to connect this directly to the infant microbiome.


Viral Infections


A viral etiology for initiation of autoimmunity is an attractive idea; a beta cell trophic virus could contribute to disease by directly killing beta cells, by leading to a chronic infection which triggers an immune response, or by molecular mimicry in which self-antigens are erroneously recognized as viral epitopes targeted for destruction.  Notably, these possible mechanisms would not necessarily point to a particular virus; any virus widespread in a population could theoretically lead to autoimmunity in genetically susceptible individuals if encountered at a vulnerable time in immune system or beta cell development.  With the notable exception of congenital rubella which is associated with type 1 diabetes (99), other data relating viruses to initiation of autoimmunity is less conclusive.  While some studies have reported viral “footprints” in islets from individuals who have died from TID, these have not been consistently confirmed.  Similarly, many studies have focused on enteroviruses, including coxsackie B, due to observations suggesting seasonal variation in antibody development that is reminiscent of the timing of such infections (100) (101), yet this remains controversial.  Aside from a viral role in the initiation of autoimmunity, others have proposed that acute viral infections may impact the transition from islet autoimmunity to clinical TID due to increased insulin demand during infections.  Patients commonly report an acute viral illness preceding the diagnosis of TID, and the clinical onset of TID more commonly presents in the fall and winter months in both the northern and southern hemispheres (102); but this does not imply a causal relationship.


Vaccinations


In recent decades, an increasing number of parents in Western countries have declined routine childhood vaccination of their children, which has created a situation with significant personal and public health consequences.  Multiple high-quality studies have thoroughly investigated vaccinations and TID, and none have found any association with islet autoimmunity or TID (103-107)


Sources: (88, 103-108).


FUTURE CONSIDERATIONS


Despite advances in glucose monitoring and insulin delivery, the daily psychological and financial burden of disease on individuals, their families, and society together with the persistence of complications and reduced life span demand a paradigm shift.


As of 2021, we know much about the natural history of disease. We know that antibodies can develop early in life and that essentially all of those with established islet autoimmunity will develop clinically overt disease. We also know that identifying these individuals is of significant clinical benefit. Those with islet autoimmunity followed carefully until diagnosis have markedly less morbidity at the time of diagnosis and lower HbA1c values. Family members of T1D probands should be made aware of their disease risk and should be offered autoantibody screening and enrollment in monitoring trials. Correspondingly, patients with TID should be informed of the opportunity to have their relatives screened for TID risk in the setting of a clinical research study.


While the interaction of humans with their environment must contribute to disease; how this occurs is still being elucidated. It is likely that there are many different paths by which individual gene/environment interactions result in T1D; suggesting that dissecting this heterogeneity will provide better insights and therapies.


REFERENCES


  1. JDRF Fact Sheet (accessed 2021 Dec 14) Available from: https://www.jdrf.org/t1d-resources/about/facts/.
  2. Centers for Disease Control and Prevention, National Diabetes Statistics Report, 2014. 2014; (accessed 2021 Dec 14)Available from: http://www.cdc.gov/diabetes/pubs/statsreport14/national- diabetes-report-web.pdf.
  3. Patterson, C., et al., Trends in childhood type 1 diabetes incidence in Europe during 1989-2008: Evidence of non- uniformity over time in rates of increase. Diabetologia, 2012. 55(8): p. 2142-2147.
  4. Bell, R., et al., Diabetes in non-Hispanic white youth:prevalence, incidence, and clinical characteristics: the SEARCH for diabetes in youth study. Diabetes Care, 2009. 32(Suppl 2): p. S102-S111.
  5. Miller, K.M., et al., Current State of Type 1 Diabetes Treatment in the U.S.: Updated Data From the T1D Exchange Clinic Registry. Diabetes Care, 2015. 38(6): p. 971-978.
  6. Liese, A.D., R.B. D'Agostino, Jr., and R. Hamman, The burden of diabetes mellitus among US youth; prevalence estimates from the SEARCH for diabetes in youth study. Pediatrics, 2006. 118(4): p. 1510-18.
  7. Lawrence, J., et al., Trends in incidence of type 1 diabetes among non-Hispanic white youth in the U.S., 2002-2009 Diabetes, 2014. 63(11): p. 3938-3945.
  8. Patterson, C., et al., Incidence trends for childhood type 1 diabetes in Europe during 1989-2003 and predicted new cases 2005-20: a multicentre prospective registration study. Lancet, 2009. 373(9680): p. 2027-2033.
  9. Incidence and trends of childhood Type 1 diabetes worldwide 1990-1999. Diabet. Med, 2006. 23(8): p. 857-866.
  10. Karvonen, M., et al., Incidence of childhood type 1 diabetes worldwide. Diabetes Mondiale (DiaMond) Project Group. Diabetes Care, 2000. 23(10): p. 1516-1526.
  11. Warram, J.H., et al., Differences in risk of insulin- dependent diabetes in offspring of diabetic mothers and diabetic fathers. N Engl J Med, 1984. 311(3): p. 149-52.
  12. Pociot, F., et al., A nationwide population-based study of the familial aggregation of type 1 (insulin-dependent) diabetes mellitus in Denmark. Danish Study Group of Diabetes in Childhood. Diabetologia, 1993. 36(9): p. 870-875.
  13. Nistico, L., et al., Emerging effects of early environmental factors over genetic background for type 1 diabetes susceptibility: evidence from a Nationwide Italian Twin Study. J Clin Endocrinol Metab, 2012. 97(8): p. E1483- E1491.
  14. Kyvik, K., A. Green, and H. Beck-Nielsen, Concordance rates of insulin dependent diabetes mellitus: a population based study of young Danish twins. BMJ, 1995. 311(7010): p. 913-917.
  15. Redondo, M., et al., Concordance for islet autoimmunity among monozygotic twins. N Engl J Med, 2008. 359(26): p. 2849-2850.
  16. Eisenbarth, G.S., Type I diabetes mellitus. A chronic autoimmune disease. N. Engl. J. Med, 1986. 314(21): p. 1360-1368.
  17. Insel, R.A., et al., Staging presymptomatic type 1 diabetes: a scientific statement of JDRF, the Endocrine Society, and the American Diabetes Association. Diabetes Care, 2015. 38(10): p. 1964-74.
  18. Concannon, P., S.S. Rich, and G.T. Nepom, Genetics of type 1A diabetes. N. Engl. J. Med, 2009. 360(16): p. 1646- 1654.
  19. Knip, M., Can we predict type 1 diabetes in the general population? Diabetes Care, 2002. 25(3): p. 623-5.
  20. Steck, A.K., et al., Predictors of Progression From the Appearance of Islet Autoantibodies to Early Childhood Diabetes: The Environmental Determinants of Diabetes in the Young (TEDDY). Diabetes Care, 2015. 38(5): p. 808-13.
  21. Gillespie, K.M., et al., The rising incidence of childhood type 1 diabetes and reduced contribution of high-risk HLA haplotypes. Lancet, 2004. 364(9446): p. 1699-1700.
  22. Mahon, J.L., et al., The TrialNet Natural History Study of the Development of Type 1 Diabetes: objectives, design, and initial results. Pediatr. Diabetes, 2008.
  23. JDRF. T1Detect: Learn why you should be screened. (accessed 2021 Dec 14); Available from: https://www.jdrf.org/t1d-resources/t1detect/.
  24. Hagopian, W.A., et al., TEDDY--The Environmental Determinants of Diabetes in the Young: an observational clinical trial. Ann N Y Acad Sci, 2006. 1079: p. 320-6.
  25. Combined Antibody Screening for Celiac and Diabetes Evaluation (CASCADE). 2020.
  26. Parikka V., N.-S.K., Saarinen M, Simell T, Ilonen J, Hyöty H, Veijola R, Knip M, Simell O., Early seroconversion and rapidly increasing autoantibody concentrations predict prepubertal manifestation of type 1 diabetes in children at genetic risk. Diabetologia, 2012. 55(7): p. 1926-36.
  27. Vehik, K., et al., Methods, quality control and specimen management in an international multicentre investigation of type 1 diabetes: TEDDY. Diabetes Metab Res Rev, 2013. 29(7): p. 557-67.
  28. Ziegler, A.G., et al., Seroconversion to Multiple Islet Autoantibodies and Risk of Progression to Diabetes in Children. Journal of the American Medical Association, 2013. 309(23): p. 2473-9.
  29. DPT-1 Study Group, Demographics of relatives screened and ICA positive in the diabetes prevention trial-type 1 diabetes (DPT-1). Diabetes, 1997. 46 (Suppl 1): p. 142A.
  30. Sosenko, J., et al., Use of the Diabetes Prevention Trial- Type 1 Risk Score (DPTRS) for improving the accuracy of the risk classification of type 1 diabetes. Diabetes Care, 2014. 37(4): p. 979-984.
  31. Mahon, J., et al., The TrialNet Natural History Study of the Development of Type 1 Diabetes: Objectives, design, and initial results. Pediatr Diabetes, 2009. 10(2): p. 97-104.
  32. Winkler, C., et al., Markedly reduced rate of diabetic ketoacidosis at onset of type 1 diabetes in relatives screened for islet autoantibodies. Pediatric Diabetes, 2012. 13(4): p. 308-313.
  33. Triolo, T., et al., Diabetic subjects diagnosed through the Diabetes Prevention Trial-Type 1 (DPT-1) are often asymptomatic with normal A1C at diabetes onset. Diabetes Care, 2009. 32: p. 769-773.
  34. Elding Larsson, H., et al., Reduced prevalence of diabetic ketoacidosis at diagnosis of type 1 diabetes in young children participating in longitudinal follow-up. Diabetes Care, 2011. 34(11): p. 2347-52.
  35. Rewers, A., et al., Presence of diabetic ketoacidosis at diagnosis of diabetes mellitus in youth: the Search for Diabetes in Youth Study. Pediatrics, 2008. 121: p. e1258- e1266.
  36. Barker, J., et al., Clinical characteristics of children diagnosed with type 1 diabetes through intensive screening and follow-up. Diabetes Care, 2004. 27(6): p. 1399-404.
  37. American Diabetes Association, I., American Diabetes Association Standards of Medical Care in Diabetes- 2021. Diabetes Care, 2021. 44 (Supplement 1): p. S18.
  38. General Population Level Estimation for Type 1 Diabetes Risk in Children 0-5 Years Old During Routine Care Delivery (PLEDGE). 2021 October 27, 2020 (accessed 2021 Dec 14); Available from: https://clinicaltrials.gov/ct2/show/NCT04477928?term=PL EDGE+study&cond=t1d&draw=2&rank=1.
  39. Rewers, M., et al., Newborn screening for HLA markers associated with IDDM: diabetes autoimmunity study in the young (DAISY). Diabetologia, 1996. 39(7): p. 807-12.
  40. Munchen, T.U., GPPAD-POInT (Global Platform of Autoimmune Diabetes - Primary Oral Insulin Trial).
  41. Barbara Davis Center for Diabetes, Autoimmunity Screening for Kids. 2019, March 13 (accessed 2021 Dec 14); Available from: https://www.askhealth.org/.
  42. Puff, R., et al., (Early diagnosis, early care--"Fr1da" screening of children for type 1 diabetes). MMW Fortschr Med, 2016. 158(4): p. 65-6.
  43. Megan AS Penno, J.J.C., Maria E Craig, et al. ENDIA Study Group, Environmental determinants of islet autoimmunity (ENDIA): a pregnancy to early life cohort study in children at-risk of type 1 diabetes, BMC Pediatr, 2013. 13-124: p. 1471-2431.
  44. Cardwell, C., et al., Maternal age at birth and childhood type 1 diabetes: a pooled analysis of 30 observational studies. Diabetes, 2010. 59(2): p. 486-494.
  45. Flood, T., S. Brink, and R. Gleason, Increased incidence of type 1 diabetes in children of older mothers. Diabetes Care, 1982. 5(6): p. 571-573.
  46. Warram, J.H., B.C. Martin, and A.S. Krolewski, Risk of IDDM in children of diabetic mothers decreases with increasing maternal age at pregnancy. Diabetes, 1991. 40(12): p. 1679-1684.
  47. Cardwell, C., et al., Birthweight and the risk of childhood- onset type 1 diabetes: a meta-analysis of observational studies using individual patient data. Diabetologia, 2010. 53(4): p. 641-651.
  48. Stene, L., et al., Birth weight and childhood onset type 1 diabetes: population-based cohort study. BMJ, 2001. 322(7291): p. 889-892.
  49. Dahlquist, G., S. Bennich, and B. Kallen, Intrauterine growth pattern and risk of childhood onset insulin dependent (type 1) diabetes: population based case- control study. BMJ, 1996. 313(7066): p. 1174-1177.
  50. Harder, T., et al., Birth weight, early weight gain, and subsequent risk of type 1 diabetes: systematic review and meta-analysis. Am J Epidemiol, 2009. 169(12): p. 1428-1436.
  51. Robertson, L. and K. Harrild, Maternal and neonatal risk factors for childhood type 1 diabetes: a Matched case- control study. BMC Public Health, 2010. 10: p. 281.
  52. Cardwell, C., et al., Birth order and childhood type 1 diabetes risk: a pooled analysis of 31 observational studies. Int J Epidemiol, 2011. 40(2): p. 363-374.
  53. Virtanen, S.M., et al., Microbial exposure in infancy and subsequent appearance of type 1 diabetes mellitus- associated autoantibodies: a cohort study. JAMA Pediatr, 2014. 168(8): p. 755-63.
  54. Cardwell, C., et al., Interbirth interval is associated with childhood type 1 diabetes risk. Diabetes, 2012. 61(3): p. 702-707.
  55. Cardwell, C., et al., Caesarean section is associated with an increased risk of childhood-onset type 1 diabetes mellitus: a meta-analysis of observational studies. Diabetologia, 2008. 51(5): p. 726-735.
  56. Khashan, A., et al., Mode of obstetrical delivery and type 1 diabetes: a sibling design study. Pediatrics, 2014. 134(3): p. e806-e813.
  57. Dahlquist, G. and B. Kallen, Maternal-child blood goup incompatibility and other perinatal events increase the risk for early-onset type 1 (insulin-dependent) diabetes mellitus. Diabetologia, 1992. 35(7): p. 671-675.
  58. Zhang, L., et al., Preterm birth and risk of type 1 and type 2 diabetes: systematic review and meta-analysis. Obes. Rev., 2014. 15(10): p. 804-811.
  59. Granfors, M., et al., No association between use of multivitamin supplement containing vitamin D during pregnancy and risk of Type 1 Diabetes in the child. Pediatr Diabetes, 2016. 17(7): p. 525-530.
  60. Stene, L.C. and G. Joner, Use of cod liver oil during the first year of life is associated with lower risk of childhood-onset type 1 diabetes: a large, population-based, case-control study. Am. J. Clin. Nutr, 2003. 78(6): p. 1128-1134.
  61. Fronczak, C., et al., In utero dietary exposures and risk of islet autoimmunity in children. Diabetes Care, 2003. 26(12): p. 3237-3242.
  62. Marjamaki, L., et al., Maternal intake of vitamin D during pregnancy and risk of advanced beta cell autoimmunity and type 1 diabetes in offspring. Diabetologia, 2010. 53(8): p. 1599-607.
  63. Kikkinen, A., et al., Use of antimicrobials and risk of type 1 diabetes in a population-based mother-child cohort. Diabetalogia, 2006. 49(1): p. 66-70.
  64. Arkkola, T., et al., Relationship of maternal weight status and weight gain rate during pregnancy to the development of advanced beta cell autoimmunity in the offspring: a prospective birth cohort study. Pediatr Diabetes, 2011. 12(5): p. 478-84.
  65. Niinisto, S., et al., Fatty acid status in infancy is associated with the risk of type 1 diabetes-associated autoimmunity. Diabetologia, 2017. 60(7): p. 1223-1233.
  66. Sorenson, I., et al., Serum long chain n-3 fatty acids (EPA and DHA) in the pregnant mother are independent of tisk of type 1 diabetes in the offspring. Diabetes Metab Res Rev, 2012. 28(5): p. 431-438.
  67. Ross, A., et al., The 2011 report on dietary reference intakes for calcium and vitamin D from the Institute of Medicine: what clinicians need to know. J Clin Endocrinol Metab, 2011. 96(1): p. 53-38.
  68. Vehik. Kendra; Lynch, K.W., Matthew; et al. TEDDY Study Group, Prospective virome analyses in young children at increased genetic risk for type 1 diabetes. Nature Medicine, 2019. 25(12):1865-1872.
  69. Borch-Johnsen, K., et al., Relation between breast-feeding and incidence rates of insulin-dependent diabetes mellitus: A hypothesis. Lancet, 1984. 2(8411): p. 1083-1086.
  70. Chimel, R., et al., Early infant feeding and risk of developing islet autoimmunity and type 1 diabetes. Acta Diabetol, 2015 Jun;52(3): p. 621-624.
  71. Frederiksen, B., et al., Infant exposures and development of type 1 diabetes mellitus: The Diabetes Autoimmunity Study in the Young (DAISY). JAMA Pediatr, 2013. 167(9): p. 808-815.
  72. Lund-Blix, N., et al., Infant feeding in relation to islet autoimmunity and type 1 diabetes in genetically susceptible children: the MIDIA Study. Diabetes Care, 2015. 38(2): p. 257-263.
  73. Couper, J.J., et al., Lack of association between duration of breast-feeding or introduction of cow's milk and development of islet autoimmunity. Diabetes, 1999. 48(11): p. 2145-2149.
  74. Knip, M., et al., Hydrolyzed infant formula and early beta- cell autoimmunity: a randomized clinical trial. JAMA, 2014. 311(22): p. 2279-87.
  75. Knip, M., Writing group for teh TRIGR Study Group, Effect of Hydrolyzed Infant Formula vs Conventional Formula on Risk of Type 1 Diabetes. JAMA, 2018 Jan. 319(1): p. 38-48.
  76. Vaarala, O., et al., Removal of Bovine Insulin From Cow's Milk Formula and Early Initiation of Beta-Cell Autoimmunity in the FINDIA Pilot Study. Arch Pediatr Adolesc Med, 2012. 166(7): p. 608-14.
  77. Ziegler, A.G., et al., Early infant feeding and risk of developing type 1 diabetes-associated autoantibodies. JAMA, 2003. 290(13): p. 1721-1728.
  78. Norris, J.M., et al., Timing of initial cereal exposure in infancy and risk of islet autoimmunity. JAMA, 2003. 290(13): p. 1713-1720.
  79. Hummel S, P.M., Hummel M, Primary dietary intervention study to reduce the risk of islet autoimmunity in children at increased risk for type 1 diabetes: the BABYDIET study. Diabetes Care, 2011. 34(6): p. 1302-1305.
  80. Beyerlein, A., et al., Timing of gluten introduction and islet autoimmunity in young children: updated results from the BABYDIET study. Diabetes Care, 2014. 37(9): p. e194- e195.
  81. Brekke, H. and J. Ludvigsson, Vitamin D supplementation and diabetes-related autoimmunity in the ABIS study. Pediatr Diabetes, 2007. 8(1): p. 11-14.
  82. Vitamin D supplement in early childhood and risk for Type I (insulin-dependent) diabetes mellitus. The EURODIAB Substudy 2 Study Group. Diabetologia, 1999. 42(1): p. 51-54.
  83. Hypponen, E., et al., Intake of vitamin D and risk of type 1 diabetes: a birth-cohort study. Lancet, 2001. 358(9292): p. 1500-1503.
  84. Zipitis, C. and A. Akobeng, Vitamin D supplementation in early childhood and risk of type 1 diabetes: a systematic review and meta-analysis. Arch Dis Child, 2008. 93(6): p. 512-517.
  85. Simpson, M., et al., No association of vitamin D intake or 25-hydroxyvitamin D levels in childhood with risk of islet autoimmunity and type 1 diabetes: the Diabetes Autoimmunity Study in the Young (DAISY). Diabetologia, 2011. 54(11): p. 2779-2788.
  86. Norris, J., et al., Omega-3 polyunsaturated fatty acid intake and islet autoimmunity in children at increased risk for type 1 diabetes. JAMA, 2007. 298(12): p. 1420-1428.
  87. Chase, H., et al., Effect of docosahexaenoic acid supplementation on inflammatory cytokine levels in infants at high risk for type 1 diabetes. Pediatr Diabetes, 2014.
  88. Wagner, C. and F. Greer, Prevention of rickets and vitamin D deficiency in infants, children, and adolescents. Pediatrics, 2008. 122(5): p. 1142-1152.
  89. Strachan, D.P., Hay fever, hygiene, and household size. BMJ, 1989. 299(6710): p. 1259-1260.
  90. Karelia map. 2015; (accessed 2021 Dec 14) Available from: https://commons.wikimedia.org/wiki/File:Karelia_today.pn g#/media/File:Karelia_today.png.
  91. Kondrashova, A., et al., The 'Hygiene hypothesis' and the sharp gradient in the incidence of autoimmune and allergic diseases between Russian Karelia and Finland. APMIS, 2013. 121(6): p. 478-93.
  92. Seiskari, T., et al., Allergic senstization and microbial load--a comparison between Finland and Russian Karelia. Clin Exp Immunol, 2007. 148(1): p. 47-52.
  93. Yatsunenko, T., et al., Human gut microbiome viewed across age and geography. Nature, 2012. 486(7402): p. 222-227.
  94. Giongo, A., et al., Toward defining the autoimmune microbiome for type 1 diabetes. ISME J, 2011. 5(1): p. 82-91.
  95. Brown, C.T., et al., Gut microbiome metagenomics analysis suggests a functional model for the development of autoimmunity for type 1 diabetes. PLoS One, 2011. 6(10): p. e25792.
  96. de Goffau, M.C., et al., Fecal microbiota composition differs between children with beta-cell autoimmunity and those without. Diabetes, 2013. 62(4): p. 1238-44.
  97. Bezirtzoglou, E., A. Tsiotsias, and G.W. Welling, Microbiota profile in feces of breast- and formula-fed newborns by using flourescence in situ hybridization (FISH). Anaerobe, 2011. 2011(17): p. 6.
  98. Stark, P. and A. Lee, The microbial ecology of the large bowel of breast-fed and formula-fed infants during the first year of life. J Med Microbiol, 1982. 15(2): p. 189-203.
  99. Menser, M., J. Forrest, and R. Bransby, Rubella infection and diabetes mellitus. Lancet, 1978. 1: p. 57-60.
  100. Oikarinen, S., et al., Enterovirus RNA in blood is linked to the development of type 1 diabetes. Diabetes, 2011. 60(1): p. 276-9.
  101. Kimpimaki, T., et al., The first signs of beta-cell autoimmunity appear in infancy in genetically susceptible children from the general population: the Finnish Type 1 Diabetes Prediction and Prevention Study. J Clin Endocrinol Metab, 2001. 86(10): p. 4782-8.
  102. Moltchanova, E., et al., Seasonal variation of diagnosis of type 1 diabetes mellitus in children worldwide. Diabet Med, 2009. 26(7): p. 673-678.
  103. Duderstadt, S., et al., Vaccination and risk of type 1 diabetes mellitus in active component U.S. military,

2002-2008. Vaccine, 2012. 30(4): p. 813-819.

  1. Graves, P., et al., Lack of association between early childhood immunizations and beta-cell autoimmunity. Diabetes Care, 1999. 22(10): p. 1694-1697.
  2. DeStefano, F., et al., Childhood vaccinations, vaccination timing, and risk of type 1 diabetes mellitus. Pediatrics, 2001. 108(6): p. E112.
  3. Hviid, A., et al., Childhood vaccination and type 1 diabetes. N Engl J Med, 2004. 350(14): p. 1398-1404.
  4. Elding Larsson, H., et al., Pandemrix(R) vaccination is not associated with increased risk of islet autoimmunity or type 1 diabetes in the TEDDY study children. Diabetologia, 2018. 61(1): p. 193-202.
  5. Breastfeeding and the use of human milk. Pediatrics, 2012. 129(3): p. e827-e841.


ADDITIONAL INFORMATION

(From prior chapter by Aaron W. Michels, MD and Peter Gottlieb, MD)


INTRODUCTION


Type 1 diabetes mellitus is defined as immune mediated diabetes mellitus (1-6). It can become manifest with hyperglycemia presenting in the first days of life or in adults over the age of 60. Current estimates indicate that immune mediated diabetes represents approximately 5 to 10% of the diabetes developing in adults and that approximately as many individuals develop this form of diabetes as adults as do children (7-9). In the United States the great majority (>90%) of Caucasian children developing diabetes have type 1 diabetes; whereas, approximately 50% of African American and Hispanic American children developing diabetes lack the autoantibody and immunogenetic markers of typical type 1 diabetes (10-12). Most of these latter children appear to have variants of type 2 diabetes with a small number having specific characteristic genetic syndromes (e.g. MODY: Maturity Onset Diabetes of Youth) with identified mutations of genes such as glucokinase and HNF (Hepatic Nuclear Factors) (13). In addition, studies of the pathology of the pancreas of Hispanic and African American children who lack islet autoantibodies show that all islets have some beta cells, but in decreased numbers (11). In contrast, in the pancreas of patients with type 1 diabetes, there is lobular loss of beta cells (termed pseudoatrophic islets) (11).


When an individual presents with type 1 diabetes it indicates that they and their relatives have an increased risk of having or developing a series of autoimmune disorders (12). Celiac disease, hypothyroidism, hyperthyroidism, Addison's disease, and pernicious anemia are some of the most prominent associated diseases. For example, approximately 1/20 patients with type 1 diabetes have celiac disease (14,15). Most of these patients are asymptomatic and the disorder is only discovered if anti-transglutaminase autoantibodies are measured and individuals with positive antibodies biopsied. In that the therapy for celiac disease, namely gluten avoidance, is highly effective, and we routinely screen all type 1 diabetic patients. We also screen for thyroid disease, which has an incidence of approximately 20% in type 1 diabetes, with yearly TSH measurements and for Addison's disease (21-hydroxylase autoantibodies) (16).


GENETIC SUSCEPTIBILITY


Type 1 diabetes is itself heterogeneous, with several forms of immune mediated diabetes with known genetic causes as parts of autoimmune syndromes (thus likely to be classified as other Specific Forms of Diabetes). In particular, patients develop immune mediated diabetes when they have mutations of the AIRE (Autoimmune Regulator) gene (21). Mutations of the AIRE gene result in Autoimmune Polyendocrine Syndrome Type I (23,24). Most forms of type 1 diabetes are polygenic in etiology, and polymorphisms of genes within the major histocompatibility complex (HLA genes) play a major role in determining disease susceptibility (27,28).


The alleles of different HLA genes (e.g., DRB1 and DQB1) are non-randomly associated with each other, such that with DRB1*0401 one usually finds one of three DQ alleles (e.g., DQB1*0301, DQB1*0302, DQB1*0303) rather than any one of more than forty different DQB molecules. Such non-random association of alleles of different genes on the same chromosome is termed linkage disequilibrium. The histocompatibility complex is divided into three regions, class II, class III and class I. The most important determinants of type 1 diabetes are the HLA DQ and DR alleles. These molecules on the surface of antigen presenting cells (e.g., macrophages) bind and present short peptides that are recognized by T cell receptors of T lymphocytes (27,35,36). They are termed immune response genes in that the specific amino acid sequence of these molecules determines which peptides will be bound and to a large extent determine which peptides an individual will respond to. Each different amino acid sequence is given a number. For the DQ molecules both its alpha and beta chain gene are polymorphic, and thus to specify a DQ molecule one must specify both chains. For DR molecules only the DRB chain is polymorphic and thus only this chain is specified. Each number after the star indicates a specific amino acid sequence of the HLA allele and the letters and first number the gene (e.g., DRB1*0401, DR B chain gene number 1, allele 0401).


There is a tremendous spectrum of diabetes risk associated with different DR and DQ genotypes (37-39) (Figure 8). For Caucasians with type 1 diabetes the most common diabetes-associated haplotypes are DR3 and DR4. More than 90% of patients with type 1A diabetes have one or both of these alleles versus approximately 40% of the general U.S. population. With the finer sequence information that is now available, DR4 haplotypes are subdivided based on specific variants of DRB1 and DQB1. The highest risk DR4 haplotypes have DRB1*0401, DRB1*0402, DRB1*0405, while DRB1*0403 is moderately protective. The highest risk DR4 haplotypes have DQB1*0302, with DQB1*0301 and DQB1*0303 of lower risk. Thus, both DR and DQ alleles contribute to diabetes risk. DR3 haplotypes are almost always conserved with DRB1*03 combined with DQA1*0501, DQB1*0201 (40). The highest risk genotype has both DR4/DR3 DQB1*0302/DQB1*0201. This genotype occurs in 2.4% of newborns in Denver, Colorado, and between 30 and 50% of children developing type 1 diabetes. Approximately 50% of children developing type 1 diabetes early (i.e., less than age 5) are DR3/4 heterozygotes versus 30% of young adults presenting with type 1A diabetes.


Figure 8. Hierarchy of diabetes risk with examples of haplotypes that lead to diabetes susceptibility, are neutral, or protective. Modified from teaching slides www.barbaradaviscenter.org


There are three HLA molecules that provide dominant protection. The most common is DQB1*0602 that occurs in approximately 20% of U.S. individuals (41-43). Protection is not absolute, but less than 1% of children with type 1 diabetes have this molecule. DQA1*0201 with DQB1*0303 and DRB1*1401 also provide dramatic protection, rarely being found in patients with type 1 diabetes and rarely transmitted from a parent with the alleles to their diabetic offspring (38,39). It is noteworthy that both DR and DQ alleles can protect. The specific mechanism underlying both susceptibility and protection are not fully understood. One attractive hypothesis is that protective alleles when expressed within the thymus lead to deletion of T cells with receptors that recognize a critical islet peptide (44). With deletion of such T cells, the risk of diabetes would be reduced. In addition, it is likely that high-risk HLA alleles present specific peptides of target islet molecules to T lymphocytes (28).


Multiple additional loci (Figure 7) have been implicated with estimates that approximately 50% of the familial aggregation of type 1 diabetes is attributable to the HLA region, perhaps 10% to the insulin locus, with all other loci contributing much less, though in aggregate their contribution is important. In the Cox analysis (Figure 7) of approximately 700 sibling pairs the only significant LOD score was for a locus on chromosome 16q that was not given an iddm designation with earlier genome screens. Several areas implicated in the past had suggestive scores, but there is overlap with the families from which the original evidence was generated. It is likely that contributing loci may differ between populations contributing to the initial difficulty of replicating putative loci in different studies (56,57). More than 40 genetic loci contributing to diabetes risk have been implicated (Figure 7). Polymorphisms of the insulin gene are well established as contributing to risk. A repeat sequence upstream (5') of the insulin gene termed a Variable nucleotide tandem repeat or VNTR, is divided into three general repeat sizes with the longest set of repeats associated with protection from diabetes (46-48). This set of alleles is also associated with greater thymic production of insulin messenger RNA (49), leading to the hypothesis that greater thymic message and presumably greater proinsulin production dampens anti-insulin autoimmunity (49-51). A functional polymorphism of the LYP gene (Lymphocyte Specific Phosphatase; PTPN22- Protein Tyrosine Phosphatase) has been associated with type 1 diabetes, rheumatoid arthritis, and lupus erythematosus (52-54). The R620W missense mutation (tryptophan replacing arginine) disrupts the binding of the phosphatase to the molecule Csk and this blocks its ability to down-regulate T cell receptor signaling. With an odds ratio of between 1.7 and 2.0 of the "autoimmunity” allele which is relatively common (5-10% allele frequency) there is a large genetic effect that is much greater than CTLA-4 polymorphisms associated with diabetes risk (55). Combining known diabetogenic polymorphisms of LYP, the insulin gene, alleles of DP, DQ, and DR class II immune response genes, as well all of the new loci account for approximately 48% of the familial aggregation of type 1A diabetes, with DR and DQ loci accounting for 41% of this 48% (45).  A recent study suggests that for a major subset of individuals with the highest risk HLA genotype (DR3/4-DQ2/DQ8 heterozygotes) who share both HLA haplotypes with a diabetic sibling, risk of activating anti-islet autoimmunity is as high as 80% (33).


AUTOIMMUNITY


Insulin autoantibodies are usually the first autoantibody to appear in children followed from birth for the development of type 1 diabetes (84,85). These autoantibodies can appear in the first six months of life. Once insulin autoantibodies appear in such young children there is a high risk of development of additional anti-islet autoantibodies and progression to diabetes. More than 90% of children developing type 1 diabetes prior to age 5 have insulin autoantibodies while less than 50% of children developing diabetes after age 12 have such autoantibodies (86). Therapy with human insulin induces insulin antibodies that cannot at present be distinguished from insulin autoantibodies. Thus, if an individual has been treated with insulin for more than several weeks, positive insulin autoantibodies are not interpretable. For all autoantibodies measured in the first 9 months of life, the antibodies may be transplacental in origin, a particular problem if a mother has type 1 diabetes and is treated with insulin.


There are a number of important caveats in the utilization of anti-islet autoantibody assays. The field developed from the initial observation that patient's sera "stained” islets of cut sections of human pancreas, the cytoplasmic islet cell antibody (ICA) assay (83). This assay, given its utilization of human pancreas from cadaveric donation and subjective reading of slides, has proven the most difficult to standardize (69). The assay predominantly detects antibodies reacting with GAD65, IA-2 and ZnT8, but does not detect anti-insulin autoantibodies. Given the difficulty in standardization, reliability over time, and major overlap with defined autoantibody assays, a number of investigators no longer utilize this assay. For research purposes and potentially in older adults with what has been termed LADA (latent autoimmune diabetes of adults) the ICA assay may have utility in that there is evidence of one or more additional autoantibodies detected with this assay and not with GAD65, IA-2, ZnT8 and insulin autoantibody determination.


A single autoantibody, even when present on multiple occasions, is associated with only a modest risk of progression to diabetes: approximately 10% (87,88). Once two or more anti-islet autoantibodies are present in children, progression to diabetes is very high, approaching almost 100% after 15 years of follow-up (89). In addition, once multiple autoantibodies are present it is very unusual for an individual to lose all expression of autoantibodies prior to the development of overt diabetes. Following the development of diabetes, IA-2 and more slowly GAD65 (over decades) autoantibodies wane. Following islet or pancreatic transplantation expression of GAD65 and IA-2 autoantibodies can be induced in patients with long-standing diabetes (90).


The most specific of the autoantibodies react with the molecule IA-2, but IA-2 autoantibodies are usually detected following the appearance of insulin and/or GAD65 autoantibodies (84). Even with IA-2 autoantibodies, however, there are apparent "false” positives in terms of diabetes risk. We evaluated approximately 10 individuals with either transient IA-2 autoantibodies or normal controls with IA-2 autoantibodies. None of these individuals expressed an additional anti-islet autoantibody. In contrast to patients diagnosed with or developing type 1 diabetes, the ICA512/IA-2 autoantibodies of nine out of ten of these normal individuals did not recognize multiple ICA512 epitopes and did not react with the dominant ICA512 autoantigenic domain (91). This indicates that even with a highly specific radioassay, if one screens tens of thousands of sera, one can find sera that presumably by chance cross-react with some epitope of the IA-2 molecule. It is much less likely to find an individual with antibodies that by chance react with two different islet autoantigens using fluid phase radioassays set with specificity at the 99th percentile of controls.


LOSS OF INSULIN SECRETION


At present, beta cell mass is not readily measured over time in humans, so it is not possible to absolutely define progression of beta cell loss. There is however no doubt that measurable anti-islet autoimmunity precedes the development of diabetes in terms of anti-islet autoantibodies in humans, and autoantibodies and T cell invasion in animal models. In the NOD mouse there is evidence of some beta cell destruction and beta cell regeneration prior to the onset of diabetes (92). There is also evidence for a change in the immune system close to the time of onset of diabetes (i.e., Th2 to Th1) (93-96). This change is associated with more rapid disease progression, ability to transfer diabetes by T cells, and a time window during which a specific immunotherapy (monoclonal anti-CD3 antibodies) is effective (97). In humans the best evidence for progressive loss of beta cell function comes from studies of insulin and C-peptide secretion (98). C-peptide, the connecting peptide of proinsulin, is secreted in equimolar amount to insulin, but C-peptide is not present in insulin preparations utilized to treat diabetes. Thus, C-peptide has become an important indicator of remaining beta cell function. Following the onset of diabetes, it has long been appreciated that C-peptide secretion progressively declines, until for most patients with type 1 diabetes C-peptide becomes non-detectable, associated with true insulin dependence. In a similar manner, first phase insulin secretion following a bolus of glucose on intravenous glucose tolerance testing is progressively lost for relatives followed to the development of type 1 diabetes (99). Such metabolic abnormalities may result in part from functional inhibition of beta cell secretion, but pathologic studies indicate that beta cell mass is normal for identical twins of patients that have not activated anti-islet autoimmunity, and for new onset patients that bulk of beta cells are destroyed (100). Within the pancreas of a patient with type 1 diabetes there is heterogeneity of islet lesions, with most islets lacking all beta cells and with no lymphocytic infiltrates (pseudoatrophic islets), few normal islets with no infiltrates, and few islets with remaining beta cells and infiltrates. This is perhaps analogous to the progressive development of vitiligo in patients, with patches of skin with all melanocytes destroyed, whereas other skin is normal.


OVERT DIABETES


The development of type 1 diabetes is usually perceived as an abrupt event, and some individuals may rapidly manifest severe hyperglycemia. Now that we can follow individuals to the development of type 1 diabetes, we can see that anti-islet autoantibodies can precede hyperglycemia by years, and there is usually some deterioration in glucose tolerance more than one year prior to diabetes onset (particularly with intravenous glucose tolerance testing) (101). The majority of individuals identified to be diabetic following autoantibody testing are found to have a diabetic 2-hour glucose on oral glucose tolerance testing (>200mg/dl) rather than fasting hyperglycemia. The acute presentation with severe hyperglycemia and ketoacidosis is life threatening, and it is estimated that approximately 1/200 children die at the onset of type 1 diabetes (102,103). Such children typically have a medical history where the first health care providers have failed to make the diagnosis of diabetes; the child then presents again later and dies with cerebral edema. The classic symptoms of polyuria, polydipsia, and weight loss are usually present but the initial diagnosis is still missed. The alternative diagnosis of nausea and vomiting due to viral illness is the most common mistaken diagnosis, and with the ready availability of glucose determination from a finger or heel stick, there should be a low threshold in emergency rooms and physicians’ offices for ruling out diabetes. Though transient hyperglycemia can occur, such children obviously need close follow up. We usually arrange glucose monitoring for children thought to have transient hyperglycemia, and measure anti-islet autoantibodies (104). Of those with anti-islet autoantibodies and transient hyperglycemia, almost all progress to type 1 diabetes within several months.


At the onset of type 1 diabetes, almost all individuals have residual insulin secretion, and there is convincing evidence that residual insulin secretion as measured by C-peptide secretion is of clinical benefit (less hypoglycemia, less microvascular complications, and much easier diabetes management).


REFERENCES


  1. Eisenbarth GS. Banting Lecture 2009: An unfinished journey: molecular pathogenesis to prevention of type 1A diabetes. Diabetes 2010; 59:759-774
  2. Todd JA. Etiology of type 1 diabetes. Immunity 2010; 32:457-467
  3. Stadinski B, Kappler J, Eisenbarth GS. Molecular targeting of islet autoantigens. Immunity 2010; 32:446-456
  4. Skyler JS. Immunomodulation for type 1 diabetes mellitus. International journal of clinical practice Supplement 2010:59-63
  5. Wong FS, Wen L. The study of HLA class II and autoimmune diabetes. Current molecular medicine 2003; 3:1-15
  6. Atkinson MA, Eisenbarth GS, Michels AW. Type 1 diabetes. Lancet 2014; 383:69-82
  7. Lorenzen T, Pociot F, Hougaard P, et al. Long-term risk of IDDM in first-degree relatives of patients with IDDM. Diabetologia 1994; 37:321-327
  8. Janzon L, Bergentz SE, Ericsson BF, et al. The arm-ankle pressure gradient in relation to cardiovascular risk factors in intermittent claudication. Circulation 1981; 63:1339-1341
  9. Zimmet P, Turner R, McCarty D, et al. Crucial points at diagnosis. Type 2 diabetes or slow type 1 diabetes. Diabetes care 1999; 22 Suppl 2:B59-64
  10. Pinhas-Hamiel O, Dolan LM, Daniels SR, et al. Increased incidence of non-insulin-dependent diabetes mellitus among adolescents. The Journal of pediatrics 1996; 128:608-615
  11. Gianani R, Campbell-Thompson M, Sarkar SA, et al. Dimorphic histopathology of long-standing childhood-onset diabetes. Diabetologia 2010; 53:690-698
  12. Triolo TM, Armstrong TK, McFann K, et al. Additional Autoimmune Disease Found in 33% of Patients at Type 1 Diabetes Onset. Diabetes care 2011; 34:1211-1213
  13. McCarthy MI, Hattersley AT. Learning from molecular genetics: novel insights arising from the definition of genes for monogenic and type 2 diabetes. Diabetes 2008; 57:2889-2898
  14. Bao F, Yu L, Babu S, et al. One third of HLA DQ2 homozygous patients with type 1 diabetes express celiac disease-associated transglutaminase autoantibodies. Journal of autoimmunity 1999; 13:143-148
  15. Hoffenberg EJ, Bao F, Eisenbarth GS, et al. Transglutaminase antibodies in children with a genetic risk for celiac disease. The Journal of pediatrics 2000; 137:356-360
  16. Baker PR, Baschal EE, Fain PR, et al. Dominant suppression of Addison's disease associated with HLA-B15. The Journal of clinical endocrinology and metabolism 2011; 96:2154-2162
  17. Atkinson MA, Eisenbarth GS. Type 1 diabetes: new perspectives on disease pathogenesis and treatment. Lancet 2001; 358:221-229
  18. Eisenbarth GS. Type I diabetes mellitus. A chronic autoimmune disease. The New England journal of medicine 1986; 314:1360-1368
  19. Diagnosis and classification of diabetes mellitus. Diabetes care 2004; 27 Suppl 1:S5-S10
  20. Imagawa A, Hanafusa T, Miyagawa J, et al. A novel subtype of type 1 diabetes mellitus characterized by a rapid onset and an absence of diabetes-related antibodies. Osaka IDDM Study Group. The New England journal of medicine 2000; 342:301-307
  21. Robles DT, Eisenbarth GS, Ikegami H, et al. Endocrinology and metabolism clinics of North America. Philadelphia: W.B. Saunders; 2002.
  22. Patel DD. Escape from tolerance in the human X-linked autoimmunity-allergic disregulation syndrome and the Scurfy mouse. The Journal of clinical investigation 2001; 107:155-157
  23. Bjorses P, Aaltonen J, Horelli-Kuitunen N, et al. Gene defect behind APECED: a new clue to autoimmunity. Human molecular genetics 1998; 7:1547-1553
  24. Michels AW, Eisenbarth GS. Autoimmune polyendocrine syndrome type 1 (APS-1) as a model for understanding autoimmune polyendocrine syndrome type 2 (APS-2). Journal of internal medicine 2009; 265:530-540
  25. Fontenot JD, Gavin MA, Rudensky AY. Foxp3 programs the development and function of CD4+CD25+ regulatory T cells. Nature immunology 2003; 4:330-336
  26. Owen CJ, Jennings CE, Imrie H, et al. Mutational analysis of the FOXP3 gene and evidence for genetic heterogeneity in the immunodysregulation, polyendocrinopathy, enteropathy syndrome. The Journal of clinical endocrinology and metabolism 2003; 88:6034-6039
  27. Klein J, Sato A. The HLA system. First of two parts. The New England journal of medicine 2000; 343:702-709
  28. Lee KH, Wucherpfennig KW, Wiley DC. Structure of a human insulin peptide-HLA-DQ8 complex and susceptibility to type 1 diabetes. Nature immunology 2001; 2:501-507
  29. Mordes JP, Greiner DL, Rossini AA. Animal models of autoimmune diabetes mellitus. . In: LeRoith D, Taylor SI, Olefsky JM, eds. Diabetes mellitus : a fundamental and clinical text. Philadelphia: Lippincott-Raven; 1996:349-360.
  30. Martin AM, Maxson MN, Leif J, et al. Diabetes-prone and diabetes-resistant BB rats share a common major diabetes susceptibility locus, iddm4: additional evidence for a "universal autoimmunity locus" on rat chromosome 4. Diabetes 1999; 48:2138-2144
  31. Yu B, Gauthier L, Hausmann DH, et al. Binding of conserved islet peptides by human and murine MHC class II molecules associated with susceptibility to type I diabetes. European journal of immunology 2000; 30:2497-2506
  32. Redondo MJ, Jeffrey J, Fain PR, et al. Concordance for islet autoimmunity among monozygotic twins. The New England journal of medicine 2008; 359:2849-2850
  33. Aly TA, Ide A, Jahromi MM, et al. Extreme genetic risk for type 1A diabetes. Proceedings of the National Academy of Sciences of the United States of America 2006; 103:14074-14079
  34. Redondo MJ, Fain PR, Eisenbarth GS. Genetics of type 1A diabetes. Recent progress in hormone research 2001; 56:69-89
  35. Kwon OJ, Brautbar C, Weintrob N, et al. Immunogenetics of HLA class II in Israeli Ashkenazi Jewish, Israeli non-Ashkenazi Jewish, and in Israeli Arab IDDM patients. Human immunology 2001; 62:85-91
  36. Undlien DE, Lie BA, Thorsby E. HLA complex genes in type 1 diabetes and other autoimmune diseases. Which genes are involved? Trends in genetics : TIG 2001; 17:93-100
  37. Lie BA, Ronningen KS, Akselsen HE, et al. Application and interpretation of transmission/disequilibrium tests: transmission of HLA-DQ haplotypes to unaffected siblings in 526 families with type 1 diabetes. American journal of human genetics 2000; 66:740-743
  38. Redondo MJ, Kawasaki E, Mulgrew CL, et al. DR- and DQ-associated protection from type 1A diabetes: comparison of DRB1*1401 and DQA1*0102-DQB1*0602*. The Journal of clinical endocrinology and metabolism 2000; 85:3793-3797
  39. Kawasaki E, Noble J, Erlich H, et al. Transmission of DQ haplotypes to patients with type 1 diabetes. Diabetes 1998; 47:1971-1973
  40. Erlich H, Valdes AM, Noble J, et al. HLA DR-DQ haplotypes and genotypes and type 1 diabetes risk: analysis of the type 1 diabetes genetics consortium families. Diabetes 2008; 57:1084-1092
  41. Baisch JM, Weeks T, Giles R, et al. Analysis of HLA-DQ genotypes and susceptibility in insulin-dependent diabetes mellitus. The New England journal of medicine 1990; 322:1836-1841
  42. Pugliese A, Gianani R, Moromisato R, et al. HLA-DQB1*0602 is associated with dominant protection from diabetes even among islet cell antibody-positive first-degree relatives of patients with IDDM. Diabetes 1995; 44:608-613
  43. Pugliese A, Kawasaki E, Zeller M, et al. Sequence analysis of the diabetes-protective human leukocyte antigen-DQB1*0602 allele in unaffected, islet cell antibody-positive first degree relatives and in rare patients with type 1 diabetes. The Journal of clinical endocrinology and metabolism 1999; 84:1722-1728
  44. Barrett JC, Clayton DG, Concannon P, et al. Genome-wide association study and meta-analysis find that over 40 loci affect risk of type 1 diabetes. Nature genetics 2009; 41:703-707
  45. Todd JA, Walker NM, Cooper JD, et al. Robust associations of four new chromosome regions from genome-wide analyses of type 1 diabetes. Nature genetics 2007; 39:857-864
  46. Bell GI, Horita S, Karam JH. A polymorphic locus near the human insulin gene is associated with insulin-dependent diabetes mellitus. Diabetes 1984; 33:176-183
  47. Undlien DE, Bennett ST, Todd JA, et al. Insulin gene region-encoded susceptibility to IDDM maps upstream of the insulin gene. Diabetes 1995; 44:620-625
  48. Barratt BJ, Payne F, Lowe CE, et al. Remapping the insulin gene/IDDM2 locus in type 1 diabetes. Diabetes 2004; 53:1884-1889
  49. Pugliese A, Brown D, Garza D, et al. Self-antigen-presenting cells expressing diabetes-associated autoantigens exist in both thymus and peripheral lymphoid organs. The Journal of clinical investigation 2001; 107:555-564
  50. Pugliese A, Zeller M, Fernandez A, Jr., et al. The insulin gene is transcribed in the human thymus and transcription levels correlated with allelic variation at the INS VNTR-IDDM2 susceptibility locus for type 1 diabetes. Nature genetics 1997; 15:293-297
  51. Bennett ST, Wilson AJ, Esposito L, et al. Insulin VNTR allele-specific effect in type 1 diabetes depends on identity of untransmitted paternal allele. The IMDIAB Group. Nature genetics 1997; 17:350-352
  52. Bottini N, Musumeci L, Alonso A, et al. A functional variant of lymphoid tyrosine phosphatase is associated with type I diabetes. Nature genetics 2004; 36:337-338
  53. Kyogoku C, Langefeld CD, Ortmann WA, et al. Genetic association of the R620W polymorphism of protein tyrosine phosphatase PTPN22 with human SLE. American journal of human genetics 2004; 75:504-507
  54. Begovich AB, Carlton VE, Honigberg LA, et al. A missense single-nucleotide polymorphism in a gene encoding a protein tyrosine phosphatase (PTPN22) is associated with rheumatoid arthritis. American journal of human genetics 2004; 75:330-337
  55. Ueda H, Howson JM, Esposito L, et al. Association of the T-cell regulatory gene CTLA4 with susceptibility to autoimmune disease. Nature 2003; 423:506-511
  56. Noble JA, Valdes AM, Varney MD, et al. HLA class I and genetic susceptibility to type 1 diabetes: results from the Type 1 Diabetes Genetics Consortium. Diabetes 2010; 59:2972-2979
  57. Burren OS, Adlem EC, Achuthan P, et al. T1DBase: update 2011, organization and presentation of large-scale data sets for type 1 diabetes research. Nucleic acids research 2011; 39:D997-1001
  58. Abiru N, Maniatis AK, Yu L, et al. Peptide and major histocompatibility complex-specific breaking of humoral tolerance to native insulin with the B9-23 peptide in diabetes-prone and normal mice. Diabetes 2001; 50:1274-1281
  59. Heath VL, Hutchings P, Fowell DJ, et al. Peptides derived from murine insulin are diabetogenic in both rats and mice, but the disease-inducing epitopes are different: evidence against a common environmental cross-reactivity in the pathogenicity of type 1 diabetes. Diabetes 1999; 48:2157-2165
  60. Wen L, Chen NY, Tang J, et al. The regulatory role of DR4 in a spontaneous diabetes DQ8 transgenic model. The Journal of clinical investigation 2001; 107:871-880
  61. Ellerman KE, Like AA. Susceptibility to diabetes is widely distributed in normal class IIu haplotype rats. Diabetologia 2000; 43:890-898
  62. Ellerman KE, Richards CA, Guberski DL, et al. Kilham rat triggers T-cell-dependent autoimmune diabetes in multiple strains of rat. Diabetes 1996; 45:557-562
  63. Wucherpfennig KW, Eisenbarth GS. Type 1 diabetes. Nature immunology 2001; 2:767-768
  64. Stadinski BD, Zhang L, Crawford F, et al. Diabetogenic T cells recognize insulin bound to IAg7 in an unexpected, weakly binding register. Proceedings of the National Academy of Sciences of the United States of America 2010; 107:10978-10983
  65. Michels AW. Targeting the trimolecular complex. Clin Immunol 2013; 149:339-344
  66. Ginsberg-Fellner F, Witt ME, Yagihashi S, et al. Congenital rubella syndrome as a model for type 1 (insulin-dependent) diabetes mellitus: increased prevalence of islet cell surface antibodies. Diabetologia 1984; 27 Suppl:87-89
  67. Shaver KA, Boughman JA, Nance WE. Congenital rubella syndrome and diabetes: a review of epidemiologic, genetic, and immunologic factors. American annals of the deaf 1985; 130:526-532
  68. Rabinowe SL, George KL, Loughlin R, et al. Congenital rubella. Monoclonal antibody-defined T cell abnormalities in young adults. The American journal of medicine 1986; 81:779-782
  69. Lonnrot M, Korpela K, Knip M, et al. Enterovirus infection as a risk factor for beta-cell autoimmunity in a prospectively observed birth cohort: the Finnish Diabetes Prediction and Prevention Study. Diabetes 2000; 49:1314-1318
  70. Graves PM, Norris JM, Pallansch MA, et al. The role of enteroviral infections in the development of IDDM: limitations of current approaches. Diabetes 1997; 46:161-168
  71. Rewers M, Norris JM. Epidemiology of type I diabetes. In: Eisenbarth GS, Lafferty KJ, eds. Type I diabetes : molecular, cellular, and clinical immunology. New York: Oxford University Press; 1996:172-208.
  72. Martin JM, Trink B, Daneman D, et al. Milk proteins in the etiology of insulin-dependent diabetes mellitus (IDDM). Annals of medicine 1991; 23:447-452
  73. Norris JM, Beaty B, Klingensmith G, et al. Lack of association between early exposure to cow's milk protein and beta-cell autoimmunity. Diabetes Autoimmunity Study in the Young (DAISY). Jama 1996; 276:609-614
  74. Norris JM, Barriga K, Klingensmith G, et al. Timing of initial cereal exposure in infancy and risk of islet autoimmunity. Jama 2003; 290:1713-1720
  75. Ziegler AG, Schmid S, Huber D, et al. Early infant feeding and risk of developing type 1 diabetes-associated autoantibodies. Jama 2003; 290:1721-1728
  76. Yang Z, Wang K, Li T, et al. Childhood diabetes in China. Enormous variation by place and ethnic group. Diabetes care 1998; 21:525-529
  77. Onkamo P, Vaananen S, Karvonen M, et al. Worldwide increase in incidence of Type I diabetes--the analysis of the data on published incidence trends. Diabetologia 1999; 42:1395-1403
  78. Bach JF. The effect of infections on susceptibility to autoimmune and allergic diseases. The New England journal of medicine 2002; 347:911-920
  79. Wenzlau JM, Moua O, Sarkar SA, et al. SlC30A8 is a major target of humoral autoimmunity in type 1 diabetes and a predictive marker in prediabetes. Annals of the New York Academy of Sciences 2008; 1150:256-259
  80. Bonifacio E, Atkinson M, Eisenbarth G, et al. International Workshop on Lessons From Animal Models for Human Type 1 Diabetes: Identification of Insulin but Not Glutamic Acid Decarboxylase or IA-2 as Specific Autoantigens of Humoral Autoimmunity in Nonobese Diabetic Mice. Diabetes 2001; 50:2451-2458
  81. Margolis DJ, Gupta J, Hoffstad O, et al. Lack of effectiveness of hyperbaric oxygen therapy for the treatment of diabetic foot ulcer and the prevention of amputation: a cohort study. Diabetes care 2013; 36:1961-1966
  82. Miao D, Guyer KM, Dong F, et al. GAD65 autoantibodies detected by electrochemiluminescence assay identify high risk for type 1 diabetes. Diabetes 2013; 62:4174-4178
  83. Bottazzo GF, Florin-Christensen A, Doniach D. Islet-cell antibodies in diabetes mellitus with autoimmune polyendocrine deficiencies. Lancet 1974; 2:1279-1283
  84. Bonifacio E, Scirpoli M, Kredel K, et al. Early autoantibody responses in prediabetes are IgG1 dominated and suggest antigen-specific regulation. J Immunol 1999; 163:525-532
  85. Yu L, Robles DT, Abiru N, et al. Early expression of antiinsulin autoantibodies of humans and the NOD mouse: evidence for early determination of subsequent diabetes. Proceedings of the National Academy of Sciences of the United States of America 2000; 97:1701-1706
  86. Vardi P, Ziegler AG, Mathews JH, et al. Concentration of insulin autoantibodies at onset of type I diabetes. Inverse log-linear correlation with age. Diabetes care 1988; 11:736-739
  87. Verge CF, Gianani R, Kawasaki E, et al. Prediction of type I diabetes in first-degree relatives using a combination of insulin, GAD, and ICA512bdc/IA-2 autoantibodies. Diabetes 1996; 45:926-933
  88. Bingley PJ, Bonifacio E, Williams AJ, et al. Prediction of IDDM in the general population: strategies based on combinations of autoantibody markers. Diabetes 1997; 46:1701-1710
  89. Ziegler AG, Rewers M, Simell O, et al. Seroconversion to multiple islet autoantibodies and risk of progression to diabetes in children. Jama 2013; 309:2473-2479
  90. Bosi E, Braghi S, Maffi P, et al. Autoantibody response to islet transplantation in type 1 diabetes. Diabetes 2001; 50:2464-2471
  91. Clark CM, Jr. How should we respond to the worldwide diabetes epidemic? Diabetes care 1998; 21:475-476
  92. Sreenan S, Pick AJ, Levisetti M, et al. Increased beta-cell proliferation and reduced mass before diabetes onset in the nonobese diabetic mouse. Diabetes 1999; 48:989-996
  93. Gazda LS, Charlton B, Lafferty KJ. Diabetes results from a late change in the autoimmune response of NOD mice. Journal of autoimmunity 1997; 10:261-270
  94. Dilts SM, Lafferty KJ. Autoimmune diabetes: the involvement of benign and malignant autoimmunity. Journal of autoimmunity 1999; 12:229-232
  95. Andre I, Gonzalez A, Wang B, et al. Checkpoints in the progression of autoimmune disease: lessons from diabetes models. Proceedings of the National Academy of Sciences of the United States of America 1996; 93:2260-2263
  96. Shimada A, Charlton B, Taylor-Edwards C, et al. Beta-cell destruction may be a late consequence of the autoimmune process in nonobese diabetic mice. Diabetes 1996; 45:1063-1067
  97. Chatenoud L, Primo J, Bach JF. CD3 antibody-induced dominant self tolerance in overtly diabetic NOD mice. J Immunol 1997; 158:2947-2954
  98. Rosenbauer J, Herzig P, von Kries R, et al. Temporal, seasonal, and geographical incidence patterns of type I diabetes mellitus in children under 5 years of age in Germany. Diabetologia 1999; 42:1055-1059
  99. Chase HP, Cuthbertson DD, Dolan LM, et al. First-phase insulin release during the intravenous glucose tolerance test as a risk factor for type 1 diabetes. The Journal of pediatrics 2001; 138:244-249
  100. Foulis AK, McGill M, Farquharson MA, et al. A search for evidence of viral infection in pancreases of newly diagnosed patients with IDDM. Diabetologia 1997; 40:53-61
  101. Srikanta S, Ganda OP, Rabizadeh A, et al. First-degree relatives of patients with type I diabetes mellitus. Islet-cell antibodies and abnormal insulin secretion. The New England journal of medicine 1985; 313:461-464
  102. Laing SP, Swerdlow AJ, Slater SD, et al. The British Diabetic Association Cohort Study, II: cause-specific mortality in patients with insulin-treated diabetes mellitus. Diabetic medicine : a journal of the British Diabetic Association 1999; 16:466-471
  103. Laing SP, Swerdlow AJ, Slater SD, et al. The British Diabetic Association Cohort Study, I: all-cause mortality in patients with insulin-treated diabetes mellitus. Diabetic medicine : a journal of the British Diabetic Association 1999; 16:459-465
  104. Herskowitz RD, Wolfsdorf JI, Ricker AT, et al. Transient hyperglycemia in childhood: identification of a subgroup with imminent diabetes mellitus. Diabetes Res 1988; 9:161-167
  105. Barker JM, Goehrig SH, Barriga K, et al. Clinical characteristics of children diagnosed with type 1 diabetes through intensive screening and follow-up. Diabetes care 2004; 27:1399-1404

Obesity and Dyslipidemia

ABSTRACT


Abnormalities in lipid metabolism are very commonly observed in patients who are obese. Approximately 60-70% of patients with obesity are dyslipidemic. The lipid abnormalities in patients who are obese include elevated serum TG, VLDL, apolipoprotein B, and non-HDL-C levels. The increase in serum TG is due to increased hepatic production of VLDL particles and a decrease in the clearance of TG rich lipoproteins. HDL-C levels are typically low and are associated with the increase in serum TG. LDL-C levels are frequently in the normal range or only slightly elevated but there is an increase in small dense LDL. Patients who are obese are at an increased risk of developing cardiovascular disease and therefore treatment of their dyslipidemia is often indicated. Life style induced weight loss will decrease serum TG and LDL-C levels and increase HDL-C levels. In most patients the changes in lipid levels with life style induced weight loss are not very robust and are proportional to the change in weight. Dietary constituents of a weight loss diet have a small but significant impact on the changes in lipid levels. Low carbohydrate diets decrease TG levels to a greater extent than high carbohydrate diets. High fat diets blunt the decrease in LDL-C that occurs with weight loss. The increase in HDL-C with weight loss is greatest with a high fat diet but the significance of this increase on cardiovascular disease risk is uncertain. Weight loss medications will also improve dyslipidemia. Bariatric surgery results in robust weight loss and has a marked effect on serum lipid levels. Remission of hyperlipidemia with gastric bypass surgery is frequently observed. The reduction in cardiovascular disease with statin therapy is no different in patients with a BMI >30 or BMI <25 (i.e., statins are effective in patients who are obese). Many, if not most, patients who are obese should be on statin therapy and some will require the addition of other LDL-C decreasing drugs to achieve satisfactory reductions in LDL-C. The mixed dyslipidemia that is frequently observed in patients who are obese will often require combination therapy. However, recent studies have failed to demonstrate that adding fibrates or niacin to statin therapy provides additional benefits beyond statins alone. However, the addition of the omega-3-fatty acid, icosapent ethyl, to statin therapy has been shown to decrease cardiovascular events.


INTRODUCTION


The prevalence of obesity has increased dramatically over the last several decades (1,2). In the United States it is estimated that approximately 35% of men and 40% of women are obese defined as a BMI >30 kg/m2 (2,3). Additionally, approximately 1/3 of the population is overweight defined as a BMI between 25 and 30 kg/m2 (2,4). Moreover, the obesity epidemic is not localized to the United States as there has been a marked increase in the prevalence of obesity worldwide (5). The number of individuals with morbid obesity (BMI > 40) has also greatly increased (6). It should be noted that very athletic individuals may have a high BMI without excess body fat (the increase in weight is due to muscle mass) and as a consequence not have metabolic abnormalities. Conversely, in certain ethnic groups obesity occurs even though the BMI is in the normal range (7). Of great concern is that the prevalence of obesity has also markedly increased in children (8). Obesity is associated with insulin resistance, alterations in lipid metabolism, and the metabolic syndrome, particularly when the excess adipose tissue is located in an intra-abdominal location or in the upper chest (9-11). Obesity is a risk factor for the development of cardiovascular disease, but it appears that much of this effect is accounted for by obesity inducing dyslipidemia, diabetes, hypertension, inflammation, and a procoagulant state (9-13). The majority of deaths related to high BMI are due to cardiovascular disease (5).


LIPID ABNORMALITIES IN PATIENTS WITH OBESITY


The lipid abnormalities seen in patients who are obese include elevated TG, VLDL, Apo B, and non-HDL-C levels, which are all commonly observed (9,10,14,15). HDL-C and Apo A-I levels are typically low (9,10,14,15). LDL-C levels are frequently in the normal to slightly elevated range, but an increase in small dense LDL is often seen resulting in an increased number of LDL particles (9,10,14,15). These small dense LDL particles are considered to be more pro-atherogenic than large LDL particles for a number of reasons (16). Small dense LDL particles have a decreased affinity for the LDL receptor resulting in a prolonged period of time in the circulation. Additionally, these small particles enter the arterial wall more easily than large particles and then they bind more avidly to intra-arterial proteoglycans, which traps them in the arterial wall. Finally, small dense LDL particles are more susceptible to oxidation, which could result in an enhanced uptake by macrophages. Postprandial TG levels are also increased in subjects with obesity and these chylomicron remnants are pro-atherogenic (17,18). The greater the increase in BMI the greater the abnormalities in lipid levels. Approximately 60-70% of patients who are obese are dyslipidemic while 50-60% of patients who are overweight are dyslipidemic (9). Notably, obesity in children and young adults also leads to an increased prevalence of elevated TG and decreased HDL-C levels (19). The increased risk for cardiovascular disease in patients with obesity is partially accounted for by this dyslipidemia.


Table 1. Lipid and Lipoprotein Levels in Patients who are Obese

Increased TG

Increased VLDL

Increased apo B

Increased non-HDL-C

Increased small dense LDL

Increased LDL particle number

Decreased HDL-C

Decreased apo A1

LDL-C and Lp(a) are not altered


It should be emphasized that the effects of obesity on lipid metabolism are dependent on the location of the adipose tissue (20-24).  Increased visceral adipose tissue and trunk (especially upper trunk) subcutaneous adipose tissue are associated with higher TG and lower HDL-C levels. In contrast, increased subcutaneous adipose tissue in the leg is associated with lower TG levels. The protective effect of leg fat may explain why women and African-Americans have lower TG levels. In addition, increased visceral adipose tissue and upper trunk subcutaneous adipose tissue are associated with insulin resistance, which may contribute to the lipid changes described above.


PATHOPHYSIOLOGY OF THE DYSLIPIDEMIA OF OBESITY


Figure 1. Changes in Lipid/Lipoprotein Metabolism Leading to the Dyslipidemia of Obesity.


Production of TG Rich Lipoproteins


There are a number of different abnormalities that contribute to the dyslipidemia seen in patients with obesity (figure 1) (9,15,18,25,26). These abnormalities are driven by the combination of the greater delivery of free fatty acids to the liver from increased total and visceral adiposity, insulin resistance, and a pro-inflammatory state, induced by macrophages infiltrating fat tissue (9,15,18,25,26). A key abnormality is the overproduction of VLDL particles by the liver, which is an important contributor to the elevation in serum TG levels (9,15,18,25,26). The rate of secretion of VLDL particles is highly dependent on TG availability, which is determined by the levels of fatty acids available for the synthesis of TG in the liver. An abundance of TG prevents the intrahepatic degradation of Apo B-100 allowing for increased VLDL formation and secretion.


There are three major sources of fatty acids in the liver all of which may be altered in patients with obesity (9,15,18,25,26). First, the flux of fatty acids from adipose tissue to the liver is increased (9,25,26). An increased mass of adipose tissue, particularly visceral stores, results in increased fatty acid delivery to the liver. Additionally, insulin suppresses the lipolysis of TG to free fatty acids in adipose tissue. In patients with obesity a decrease in insulin activity due to insulin resistance results in the blunting of the inhibition of TG lipolysis and an increase in TG breakdown in adipose tissue leading to increased fatty acid deliver to the liver (9,26). A second source of fatty acids in the liver is de novo fatty acid synthesis. Numerous studies have shown that fatty acid synthesis is increased in the liver in patients with obesity (15,25,27). This increase may be mediated by the hyperinsulinemia seen in patients with insulin resistance. Specifically, insulin stimulates the activity of SREBP-1c, a transcription factor that increases the expression of the enzymes required for the synthesis of fatty acids. While the liver is insulin resistant to the effects of insulin on carbohydrate metabolism, the liver remains sensitive to the effects of insulin stimulating lipid synthesis (28). The third source of fatty acids is the uptake of TG rich lipoproteins by the liver. Studies have shown an increase in intestinal fatty acid synthesis accompanied by the enhanced secretion of chylomicrons in obesity (15,25,29). This increase in chylomicrons leads to the increased delivery of fatty acids to the liver. The increase in hepatic fatty acids by these three pathways results in an increase in the synthesis of TG in the liver and the protection of Apo B-100 from degradation resulting in the increased formation and secretion of VLDL (15,26). Additionally, the ability of insulin to suppress Apo B secretion is diminished in patients with obesity and marked insulin resistance (25,26). Finally, increased caloric intake may contribute to circulating TG, either by dietary fat leading to increased chylomicron TG levels and/or providing fatty acids to the liver or dietary carbohydrate enhancing de novo hepatic lipogenesis. 


Metabolism of TG Rich Lipoproteins


In addition to the overproduction of TG rich lipoproteins by the liver and intestine there are also abnormalities in the subsequent metabolism of these TG rich lipoproteins, which contributes to the increase in TG levels (9,15,18,25). Patients who are obese have an increase in Apo C-III levels (25,30). Apo C-III expression is inhibited by insulin and hence the insulin resistance that occurs in patients with obesity could account for the increase in Apo C-III (25). Apo C-III is an inhibitor of lipoprotein lipase activity and could thereby reduce the clearance of TG rich lipoproteins (31). In addition, Apo C-III also inhibits the cellular uptake of TG rich lipoproteins (31). Recent studies have shown that loss of function mutations in Apo C-III lead to decreases in serum TG levels and a reduced risk of cardiovascular disease (32-34). Interestingly, inhibition of Apo C-III expression results in a decrease in serum TG levels even in patients deficient in lipoprotein lipase indicating that the ability of Apo C-III to modulate serum TG levels is not dependent solely on regulating lipoprotein lipase activity (35). Finally, if insulin resistance is severe the insulin induced stimulation of lipoprotein lipase may be reduced, which would also decrease the clearance of TG rich lipoproteins (18). Thus, a decrease in clearance of TG rich lipoproteins also contributes to the elevation in serum TG levels in patients with obesity.


Production of Small Dense LDL and HDL


The elevation in TG rich lipoproteins in turn has effects on other lipoproteins (figure 1). Specifically, cholesterol ester transfer protein (CETP) mediates the equimolar exchange of TG from TG rich VLDL and chylomicrons for cholesterol from LDL and HDL (9,10,14,18). The increase in TG rich lipoproteins per se leads to an increase in CETP mediated exchange, increasing the TG content and decreasing the cholesterol content of both LDL and HDL. Additionally, obesity also increases the activity and mass of CETP (14). This CETP-mediated exchange underlies the commonly observed reciprocal relationship of low HDL-C levels when TG levels are high and the increase in HDL-C when TG levels decrease.


The TG on LDL and HDL is then hydrolyzed by hepatic lipase and lipoprotein lipase leading to the production of small dense LDL and small HDL particles (9,10,18). Notably hepatic lipase activity is increased in patients who are obese with increased visceral adiposity, which will facilitate the removal of TG from LDL and HDL resulting in small lipoprotein particles (9,10,18). The affinity of Apo A-I for small HDL particles is reduced leading to the disassociation of Apo A-I and the clearance and breakdown of Apo A-I by the kidneys (9). These changes result in reduced levels of Apo A-I and HDL-C in patients who are obese.


Role of Inflammation and Adipokines


Obesity is a pro-inflammatory state due to macrophages that infiltrate adipose tissue. The cytokines produced by macrophages and the adipokines that are produced by fat cells also alter lipid metabolism (26,36-38).


Adipokines, such as adiponectin and resistin, regulate lipid metabolism. The circulating levels of adiponectin are decreased in subjects who are obese (39). Decreased adiponectin levels are associated with elevations in serum TG levels and decreases in HDL-C levels (39). This association is thought to be causal as studies in mice have shown that overexpressing adiponectin (transgenic mice) decreases TG and increases HDL-C levels while conversely, adiponectin knock-out mice have increased TG and decreased HDL-C levels (39). The adiponectin induced decrease in TG levels is mediated by an increased catabolism of TG rich lipoproteins due to an increase in lipoprotein lipase activity and a decrease Apo C-III, an inhibitor of lipoprotein lipase (39). The increase in HDL-C levels induced by adiponectin is mediated by an increase in hepatic Apo A-I and ABCA1, which results in the increased production of HDL particles (39).


Resistin is increased in subjects who are obese and the levels of resistin directly correlate with plasma TG levels (40). Moreover, resistin has been shown to stimulate hepatic VLDL production and secretion due to an increase in the synthesis of Apo B, TG, and cholesterol (26,40). Finally, resistin is associated with a decrease in HDL-C and Apo A-I levels (26).


The pro-inflammatory cytokines, TNF and IL-1, stimulate lipolysis in adipocytes increasing circulating free fatty acid levels, which will provide substrate for hepatic TG synthesis (37). In the liver, pro-inflammatory cytokines stimulate de novo fatty acid and TG synthesis (37). These alterations will lead to the increased production and secretion of VLDL. At higher levels the pro-inflammatory cytokines decrease the expression of lipoprotein lipase and increase the expression of angiopoietin like protein 4, an inhibitor of lipoprotein lipase (37,41). Together these changes decrease lipoprotein lipase activity, thereby delaying the clearance of TG rich lipoproteins. Thus, increases in the levels of pro-inflammatory cytokines will stimulate the production of TG rich lipoproteins and delay the clearance of TG rich lipoproteins, which together will contribute to the increase in serum TG that occurs in patients with obesity.


Pro-inflammatory cytokines also affect HDL metabolism (42,43). First, they decrease the production of Apo A-I, the main protein constituent of HDL. Second, in macrophages pro-inflammatory cytokines decrease the expression of ABCA1 and ABCG1, which will lead to a decrease in the efflux of phospholipids and cholesterol from the cell to HDL. Third, pro-inflammatory cytokines decrease the production and activity of LCAT, which will limit the conversion of cholesterol-to-cholesterol esters in HDL. This step is required for the formation of a normal spherical HDL particle and facilitates the ability of HDL to transport cholesterol. Together these changes induced by pro-inflammatory cytokines could result in a decrease in HDL-C and Apo AI levels.


CURRENT TREATMENT GUIDELINES FOR SERUM LIPIDS


The purpose of treating lipid disorders is to prevent the development of other diseases, particularly cardiovascular disease. Thus, the decision to treat should be based on the risk of the hyperlipidemia leading to those medical problems. A number of guidelines have been published that discuss in detail cardiovascular risk assessment and provide recommendations on treatment strategies (44-48). It should be noted that while these guidelines are similar there are significant differences between their recommendations. The current American College of Cardiology/American Heart Association (ACC/AHA) guidelines do not emphasize specific lipid/lipoprotein goals of therapy but rather to just treat with statins to lower LDL-C by a certain percentage (44). An exception is that they do recommend in patients with very high-risk ASCVD, to use an LDL-C threshold of 70 mg/dL to consider addition of non-statins to statin therapy. In contrast, other groups, such as the National Lipid Association, International Atherosclerosis Society, European Society of Cardiology/European Atherosclerosis Society, and American Association of Clinical Endocrinologists (AACE), do recommend lowering the LDL-C and non-HDL-C levels to below certain levels depending upon the cardiovascular risk in a particular patient but the recommendations from these organizations are not identical (43,45-47) (49).These issues are discussed in detail in the chapters on Guidelines for the Management of High Blood Cholesterol (50). In addition to cardiovascular complications, marked elevations in TG can lead to pancreatitis (51). The National Lipid Association recommends treating TG levels greater than 500mg/dL while the Endocrine Society recommends treating TG if they are greater than 1000mg/dL to lower the risk of pancreatitis (48,52).


It should be noted that most lipid experts would recommend trying to achieve an LDL-C levels less than 70mg/dL and non-HDL-C levels less than 100mg/dL at a minimum in patients with cardiovascular disease or patients at very high risk for the development of cardiovascular disease. AACE and European Society of Cardiology/European Atherosclerosis Society have recommended LDL-C levels less than 55mg/dL in patients at very high risk (47,49). In other patients, an LDL-C level less than 100mg/dL and non-HDL-C level less than 130mg/dL is a reasonable goal. The recommendations for evaluating and treating dyslipidemia in patients with obesity are the same as non-obese patients. For additional details on deciding who to treat and the goals of therapy see other Endotext chapters (50,51,53)


MODALITIES TO TREAT LIPID ABNORMALITIES IN PATIENTS WITH OBESITY


Effect of Diet


There are two issues with regards to diet. First is the effect of weight loss on serum lipids. Second is the effect of dietary constituents (macronutrients) on serum lipids. For additional details on the effect of diet on lipid and lipoproteins please see the chapter “The Effect of Diet on Cardiovascular Disease and Lipid and Lipoprotein Levels” (54) and for additional information on weight loss diets see the chapter on “Dietary Treatment of Obesity” (55).


LOW-CALORIE DIET-INDUCED WEIGHT LOSS


In 1992, Dattilo and Kris-Etherton published a meta-analysis that evaluated the effect of weight loss on serum lipids (56). For every 1Kg decrease in body weight there was a 0.77mg/dL decrease in LDL-C and 1.33mg/dL decrease in TG. The effect of weight loss on HDL-C was more complex. For every 1kg decrease in body weight there is a 0.27mg/dL decrease in HDL-C during active weight loss. However, when weight is stabilized there is a 0.35mg/dL increase in HDL-C for every 1kg decrease in body weight that has occurred. In a more recent systemic review and meta-analysis Zomer et al. reported that a 5-10% weight loss resulted in a 16mg/dL decrease in TG, 10mg/dL decrease in LDL-C, and a nonsignificant effect on HDL (+0.5 mg/dL) (57). Finally, in a very recent meta-analysis of 30 randomized controlled trials with 2,434 participants by Hasan et al it was reported that lifestyle (diet and/or exercise) induced weight loss at 12 months resulted in a 4mg/dL decrease in TG, a 1.28 mg/dL decease in LDL-C, and 0.46 mg/dL increase in HDL-C per 1kg weight loss (58). Using the results of the most recent meta-analysis if a patient lost 10Kg of body weight and maintained the weight loss, one would expect that LDL-C would have decreased by 12.8mg/dL, TG would have decreased by 40mg/dL, and HDL-C would have increased by 4.6mg/dL. Of course, many, if not most patients, will not be able to loss 10kg and maintain that weight loss for an extended period of time.


Additionally, one should recognize that the response of lipid levels to weight loss will vary greatly in individual patients but in general one can expect a decrease in serum TG and LDL-C levels and an increase in HDL-C levels. The degree of decrease in serum TG levels is related to baseline TG levels with higher levels typically demonstrating a greater reduction with weight loss. In the Look-Ahead Trial decreases in LDL-C (15-18mg/dL) and TG (21-25mg/dL) levels were similar across BMI categories in lifestyle participants who lost weight but in the severely obese the increase in HDL-C levels was blunted (59). Interestingly, in metabolically healthy patients who are obese and do not have lipid abnormalities or other metabolic abnormalities a calorie deficient diet still results in a decrease in TG with no change in HDL-C levels (60). Finally, a systematic review of studies has shown that weight loss in children also decreases TG and increases HDL-C levels (61).


Whether particular diets are better at inducing weight loss is hotly debated with many “experts” recommending certain diets as being advantageous. Sacks and colleagues in a large trial of 811 obese subjects compared four different diets (fat 20%/protein 15%/carbohydrate 65%; fat 20%/protein 25%/carbohydrate 55%; fat 40%/protein 121-25mg/dL)5%/carbohydrate 45%; and fat 40% protein 25% carbohydrate 35%) in which total calories were also reduced. They found that after two years weight loss was similar (62). Other studies that compared different diets over an extended of time period (at least one year) have reached similar conclusions (63-65). During the first 6 months of many diet studies, patients lose a significant amount of weight but unfortunately over an extended period of time most patients regain weight such that after two years the amount of weight loss is relatively modest. For example, in the study of Sacks et al patients lost approximately 6kg of weight during the first six months but by 24 months the total weight loss was only between 3-4kg (62). It is therefore essential that one focuses on “long-term” studies when comparing different diet approaches. At this time, it is not clear that any particular diet is “best” for inducing weight loss and individual weight loss is highly variable. The key is the ability of the patient to follow the diet for an extended period of time.


DIETARY MACRONUTRIENT CONSTITUENTS


The effect of different weight loss diets that differ by macronutrient content on the lipid profile has been evaluated in a large number of studies. A meta-analysis by Hu and colleagues examined the effect of a low-carbohydrate vs. a low-fat diet in 23 studies with 2,788 participants (64). They found, as expected, that both types of weight loss diets decreased LDL-C and TG levels and increased HDL-C levels. However, the low carbohydrate diet decreased TG and increased HDL-C to a greater extent than the low-fat diet. Conversely, the low-fat diet was more effective in lowering LDL-C levels. The results of this meta-analysis are shown in table 2. It should be noted that the magnitude of these changes, except for the decrease in TG are small. Similarly, Mansoor et al in a meta-analysis of 11 RCT with 1369 participants reported that a low carbohydrate diet resulted in a decreased TG level (23mg/dL) and increased HDL-C level (5.5mg/dL) compared to a high fat diet but LDL-C levels were also increased (6.2mg/dL) with the low carbohydrate diet (66). Additionally, Naude and colleagues in a meta-analysis of 12 studies with 1603 subjects, found that a low carbohydrate diet compared to a “balanced” diet resulted in lower TG levels and higher HDL-C and LDL-C levels but once again the differences were relatively small (67). Additionally, a meta-analysis by Schwingshackl and Hoffmann compared high fat vs. low fat diets and observed that the decrease in LDL-C was more pronounced with a low-fat diet whereas the increase in HDL-C and the decrease in TG were greater with the high-fat diet (68). Finally, a meta-analysis comparing ketogenic diets that are very-low in carbohydrates with low-fat diets resulted, as expected, in greater decreases in TG and increases in HDL-C levels with the ketogenic than the low-fat diet but the ketogenic diet leads to an increase in LDL-C levels (69).


Table 2. Comparison of High and Low Fat and Carbohydrate Diets (64)  


Low carbohydrate/high fat

Low fat/high carbohydrate

Weight Loss (kg)

-6.1

-5.0

LDL-C (mg/dL)

-2.1

-6.0

HDL-C (mg/dL)

4.5

1.6

TG (mg/dL)

-30.4

-17.1


While the typical increases in LDL-C levels observed with a ketogenic diet are modest, recently a series of reports have described marked elevations in LDL-C levels in some patients on a ketogenic diet (70-72). For example, Goldberg et al reported 5 patients with marked increases in LDL-C levels on a ketogenic diet (73). Three patients had LDL-C levels greater than 500mg/dl. Similarly, Schaffer et al described 3 patients in which a very low carbohydrate diet induced LDL-C levels greater then 400mg/dL (74). Finally, Schmidt et al reported 17 patients with LDL-C levels greater than 200mg/dL on a ketogenic diet (75). In these patients there was an average increase in their LDL-C level of 187 mg/dL (75). The elevations in LDL-C levels decrease towards normal with cessation of the ketogenic diet (73-75). It should be noted that most of the patients with marked elevations in LDL-C in response to a ketogenic diet had normal LDL-C levels prior to the dietary change (71). This hyper response seems to occur more commonly in patients who are lean (71) but has also been seen in obese patients (73).


Many of the individuals who develop marked increases in LDL-C on a very low carbohydrate ketogenic diet have low triglyceride levels, elevated HDL-C levels, and are thin (70,71). This phenotype has been called the lean mass hyper-responder (LMHR) phenotype (70,71). LMHR individuals have been defined as having triglycerides <70mg/dL, HDL-C > 80mg/dL, and LDL-C > 200mg/dL (70,71). The mechanism for the marked increase in LDL-C levels is unknown.


A meta-analysis by Wycherley et al evaluated the effect of high protein vs. low protein diet on lipid levels in 24 studies with over a 1000 subjects (76). Weight loss was similar between the two diet strategies with less than a 1kg difference in weight loss between the high protein vs. low protein diets. Similarly, there were no differences in LDL-C or HDL-C levels but the high protein diet resulted in a greater decrease in TG levels (20mg/dL). A meta-analysis by Schwingshackl and Hoffmann compared the effect of low fat diets that were either low or high in protein (77). They observed no significant differences in LDL-C, HDL-C, or TG levels indicating that high protein diets have neither beneficial nor detrimental effects on lipid levels.


There are many diet programs that a widely advertised. In a network meta-analysis of 121 eligible trials with 21, 942 overweight or obese patients Ge and colleagues compared the effect of 14 different diets on LDL-C and HDL-C levels (78). The diets could be grouped into low CHO diets (Atkins, South Beach, Zone), moderate macronutrients diets (Biggest Loser, DASH, Jenny Craig, Mediterranean, Portfolio, Slimming World, Volumetrics, Weight Watchers), and low-fat diets (Ornish, Rosemary Conley). The effect of these different diets on LDL-C and HDL-C levels are shown in table 3. It should be noted that despite considerable weight loss the effect of these diets on LDL-C and HDL-C levels was very modest except for the LDL-C lowering seen with the Portfolio diet. The portfolio dietary pattern is a plant-based dietary pattern that includes four cholesterol-lowering foods; a) tree nuts or peanuts, b) plant protein from soy products, beans, peas, chickpeas, or lentils, c) viscous soluble fiber from oats, barley, psyllium, eggplant, okra, apples, oranges, or berries, and d) plant sterols initially provided in a plant sterol-enriched margarine. Unfortunately, a comparison of the effect of these 14 different diets on TG levels was not reported.


Table 3. Effect of Different Diets in Comparison with Usual Diet

Diet vs. Usual Diet

Decrease in Weight (Kg)

Change in LDL-C (mg/dL)

Change in HDL-C (mg/dL)

Atkins

5.46

+2.75

-3.41

Zone

4.07

+2.89

+0.33

Dash

3.63

-3.93

+1.90

Mediterranean

2.87

-4.59

+0.61

Paleolithic

5.31

-7.27

+2.52

Low Fat

4.87

-1.92

+2.13

Jenny Craig

7.77

-0.21

+2.85

Volumetrics

5.95

-7.13

+0.13

Weight Watchers

3.90

-7.13

+0.88

Rosemary Conley

3.76

-7.15

+2.04

Ornish

3.64

-4.71

+4.87

Portfolio

3.64

-21.29

+3.26

Biggest Loser

2.88

-3.90

+0.01

Slimming World

2.15

N/A

N/A

South Beach

9.86

+0.64

-3.60

Dietary Advice

0.31

+2.01

+1.71


In a study carried out in a single center the Atkins, Zone, Weight Watchers, and Ornish diets were compared and the effect on TG levels was also reported (79). Table 4 shows the results of this study at 2 months, a period at which dietary compliance was still high. The magnitude of weight loss was similar but the decrease in LDL-C that occurs with weight loss was blunted with a diet that was high in fat (Atkins diet). In contrast HDL-C levels increased with a high fat diet, particularly saturated fatty acids (Atkins diet) and decreased with a very low-fat diet (Ornish diet). The weight loss induced decrease in TG levels was blunted by a high carbohydrate intake (Ornish diet). These observations confirm and extend the results described above.


Table 4. Effect of Different Diets on Lipid Levels


Weight (kg)

LDL-C (mg/dL)

HDL-C (mg/dL)

TG (mg/dL)

Atkins

-3.6

1.3

3.2

-32

Zone

-3.8

-9.7

1.8

-54

Weight Watchers

-3.5

-12.1

-0.2

-9.2

Ornish

-3.6

-16.5

-3.6

-0.4


In summary, low carbohydrate/high fat diets result in greater decreases in TG and increases in HDL-C but LDL-C decreases are blunted. In contrast, low fat/high carbohydrate diets are more effective in lowering LDL-C levels but the decrease in TG and the increase in HDL-C are blunted. Stated simply, diets that contain carbohydrates tend to increase TG levels while diets high in fat increase HDL-C levels and if they contain saturated fats and/or trans fats increase LDL-C levels.   


GLYCEMIC INDEX


The glycemic index of foods is a marker for the rapid absorption and appearance of glucose in the blood during meal consumption. Higher glycemic index foods result in greater glucose and insulin excursions than low-glycemic index foods. A meta-analysis by Goff et al has examined the effect of foods with a high glycemic index vs. foods with a low glycemic index in 28 studies with over a 1000 subjects (80). There was no significant effect of glycemic index on either HDL-C or TG levels. However, the low glycemic index foods resulted in a small decrease in LDL-C (approximately 6mg/dL). The decrease in LDL-C was only seen in the studies where the low glycemic diet also had an increase in dietary fiber, indicating that the observed differences were likely due to dietary fiber, a factor well known to decrease LDL-C levels. The effect of glycemic index has to be distinguished from that of carbohydrate levels. Indeed, in a recent study in which fiber was kept constant, a low glycemic index diet increased LDL-C when carbohydrate intake was high, but decreased LDL-C when carbohydrate was low (81).


To summarize dietary constituents of weight loss diets have a small but significant impact on the changes in lipid levels. Low carbohydrate diets decrease TG levels to a greater extent than high carbohydrate diets. High saturated fat diets blunt the decrease in LDL-C that occurs with weight loss. HDL-C levels increase with weight loss and this increase is greatest with a high fat diet. A weight loss diet that contains a markedly reduced fat content my result in a decrease in HDL-C levels. Finally, a diet high in soluble fiber will lower LDL-C levels. As should be apparent from these data the effect of diet induced weight loss on the lipid profile is modest and thus in most patient’s pharmacologic therapy will be required to induce significant changes in the lipid profile.  


It should be emphasized that the inability to decrease weight with diet therapy is not a reason to abandon dietary therapy. Patients should be encouraged to decrease their intake of saturated fats (<7% of calories) and trans fats and increase their intake of soluble fiber, which will favorably effect LDL-C levels. Additionally, reducing intake of simple sugars and alcohol will lower TG levels. Thus, even in the absence of significant weight loss dietary therapy can be beneficial and should be encouraged.


Effect of Exercise


Exercise alone is usually not sufficient to induce significant weight loss (82,83). However, exercise when combined with diet therapy can facilitate weight loss and is considered very important for weight loss maintenance (82). It may also diminish the loss of muscle mass during weight loss (82). The effect of exercise on serum LDL-C varies with some studies showing a 4-7% decrease and some even showing increases (84,85). The decrease in LDL-C levels typically occurs in association with weight loss. However, the levels of small dense LDL decrease with exercise, while the levels of large LDL increase, an effect that occurs even in the absence of significant weight loss (85). To significantly increase HDL-C levels requires a considerable amount of exercise (700-2000kcal of exercise per week) (84,86). Serum TG levels are most responsive to exercise with various studies showing a 4-37% decrease in serum TG levels with exercise (mean decrease 24%) (84). Of note the changes in HDL-C and TG induced by exercise occur independent of weight loss (84). Resistance training alone has minimal effects on TG and HDL-C levels (87). It is recommended that patients exercise 150 minutes or more per week (for example 30 minutes 5x per week). The more intensive the exercise program the greater the effect on weight and lipid levels.


Effect of Weight Loss Drugs


There are several weight loss drugs currently approved for the long-term treatment of obesity. For a detailed discussion of weight loss drugs see the chapter on “Pharmacologic Treatment of Overweight and Obese Adults” (88). Weight loss drugs tend to decrease TG and LDL-C levels and increase HDL-C levels due to their ability to decrease weight but the results vary in individual patients.


ORLISTAT (XENICAL)


Orlistat is a lipase inhibitor that decreases fat absorption. Total cholesterol and LDL-C levels decrease with orlistat treatment to a greater degree than expected with diet alone (89-91). For example, in the XENDOS study LDL-C decreased by 12.8% in the orlistat group vs. 5.1% in the placebo group (89). Additionally, studies have shown that the levels of small dense LDL are reduced and the average LDL particle size increased with orlistat treatment (92). It has been shown that orlistat, in addition to reducing dietary TG absorption, also decreases cholesterol absorption (93). A likely mechanism for the decrease in cholesterol absorption is orlistat inhibition of NPC1L1, a transporter in the intestine that mediates cholesterol absorption (94). Despite the effect on TG absorption, orlistat does not markedly affect either fasting TG or HDL-C levels beyond what one would expect with weight loss (90,95). However, orlistat does reduce postprandial TG levels and has been used to treat patients with familial chylomicronemia syndrome (96).


PHENTERAMINE + TOPIRAMATE (QSYMIA)


Phenteramine is a sympathomimetic amine that induces satiety and topiramate is a neurostabilizer that also decreases appetite. In randomized controlled trials, phenteramine + topiramate combination therapy decreased TG levels and increased HDL-C without a consistent effect on LDL-C levels (97-99). It is likely that these changes primarily represent the effect of the weight loss induced by this drug.


NALTREXONE + BUPROPION (CONTRAVE)


Naltrexone is an opioid antagonist and bupropion is an antidepressant. In large randomized control trials naltrexone + bupropion decreased TG levels by approx. 8-12%, decreased LDL-C levels by 0-6%, and increased HDL-C by 3-8% (100-103). The magnitude of these changes in lipid levels mimics what one would expect from weight loss.


LIRAGLUTIDE (SAXENDA)


Liraglutide is a GLP-1 agonist that has been approved for the treatment of obesity. A large randomized trial demonstrated modest reductions in TG (9%) and LDL-C levels (2.4%) and increases in HDL-C (1.9%) with liraglutide treatment (104). Another randomized trial failed to demonstrate changes in lipid parameters (105). However, a trial in patients with diabetes also resulted in modest improvements in TG and HDL-C levels (106). Thus, liraglutide induces modest changes in the lipid profile that mimics what one observes with weight loss.


SEMAGLUTIDE (WEGOVY)


Several studies have determined the effect of semaglutide on lipid levels during weight loss trials. In the STEP 1and 2 trials minimal decreases in LDL-C and increases in HDL-C were observed (107,108). However, a more marked decrease in TG were observed (107,108). In the STEP 3 trial LDL-C was decreased by 7mg/dL and TG by 17mg/dL while HDL-C was increased by 1.5mg/dL (109). In other studies it has been shown that GLP-1 receptor agonists reduce postprandial TGs by reducing circulating chylomicrons due to decreasing intestinal lipoprotein production (110).


SUMMARY OF WEIGHT LOSS DRUGS


Except for orlistat, which appears to lower LDL-C beyond what would be expected with weight loss alone, the effect of these weight loss drugs on lipid levels seems to reflect their ability to induce weight loss. It should be noted that the change in fasting lipid levels induced by weight loss drugs is modest, variable, and roughly correlates with the degree of weight loss.


Effect of Bariatric Surgery on Lipids


Bariatric surgery is more effective at inducing weight loss than either diet or medications (111,112). Associated with this greater decrease in weight is a more robust decrease in serum TG levels and increase in HDL-C levels (113-115). In some studies, a marked decrease in LDL-C is also observed. For example, Nguyen et al reported that in patients with severe obesity, Roux-en-Y gastric bypass (RYGB) resulted in a 63% decrease in serum TG, a 31% decrease in LDL-C, and a 39% increase in HDL-C (116). Studies have also shown a decrease in postprandial lipemia and Lp(a) levels (117-119). Moreover, the ability of HDL to mediate cholesterol efflux from cells is improved following bariatric surgery (120-122). Many patients are able to discontinue their lipid lowering drugs post bariatric surgery.


There are differences in the ability of different bariatric surgeries to impact lipids. Two randomized trials demonstrated a greater effect of RYGB compared to sleeve gastrectomy on dyslipidemia (123,124). In contrast, another randomized trial did not observe a difference in the effect of RYGB compared to sleeve gastrectomy on triglycerides, HDL-C, or LDL-C (125). However, in a meta-analysis comparing randomized trials of RNYGB vs. sleeve gastrectomy, Li et al reported that serum TG decreased to a greater degree in the RYGB patients (approximately 20mg/dL) (126). A similar greater decrease in LDL-C levels was also seen in the RYGB groups (approximately 28mg/dL). Puzziferri et al published a systemic review of the long-term follow-up of patients after bariatric surgery (127). They reported that the remission of hyperlipidemia (defined as total cholesterol < 200mg/dL, HDL-C > 40mg/dL, LDL-C < 160mg/dL, and TG < 200mg/dL) was 60.4% after RYGB but only 22.7% after gastric band. Thus, RYGB is the most effective procedure for reducing dyslipidemia in patients with obesity, followed by sleeve gastrectomy, followed by gastric banding (115). Whether the greater beneficial effects of RYGB on lipids is due to greater weight loss, endocrine changes, nutrient malabsorption, or enhanced bile-acid absorption and increases in circulating bile-acid levels induced by this procedure remains to be fully elucidated.


It should be noted that observational studies have found large reductions in cardiovascular events with bariatric surgery in both patients with and without pre-existing cardiovascular disease (128). It is likely that improvements in dyslipidemia contributes to this decrease in cardiovascular events.


Summary of Weight Loss Effect on Lipid Levels


A meta-analysis of 73 studies enrolling 32,496 patients examined the effect of weight loss due to diet, drugs, and bariatric surgery on lipid levels at 12 months (table 5) (58). One should recognize that there is quite a bit of variability and the results shown in table 5 only provide a rough estimate of the effect of weight loss in an individual patient with the different treatments.


Table 5. Change in Lipid Levels with Weight Loss Interventions (mg/dL per kg weight loss)


Triglycerides

LDL Cholesterol

HDL Cholesterol

Diet and/or Exercise

-4.00; 95% CI -5.24, -2.77

-1.28; 95% CI -2.19, -0.37

0.46; 95% CI 0.19, 0.71

Weight Loss Drugs

-1.25; 95% CI -2.94, 0.43

-1.67; 95% CI -2.28, -1.06

0.37; 95% CI 0.23, 0.52

Bariatric Surgery

-2.47, 95% CI -3.14, -1.80

-0.33; 95% CI -0.77, 0.10

0.42; 95% CI 0.37, 0.47

Note- The decrease in LDL-C with weight loss drugs included a relatively large number of patients treated with orlistat, which may have enhanced the LDL-C reduction.


Effect of Lipid Lowering Drugs


In general, the effect of lipid lowering drugs in patients with obesity is similar to the effects observed in normal weight patients. Statins are the first line drug except in patients with very high TG levels (>500mg/dL) where fibrates, fish oil (omega-3-fatty acids), or niacin may be used initially to specifically target very high TG (>500-1000mg/dL). For additional information on lipid lowering drugs please see the chapters on cholesterol lowering drugs and TG lowering drugs (129,130). Below we address issues of using lipid lowering drugs that have importance specifically for patients who are obese.


STATINS


Statins are easy to use and generally well tolerated by patients who are obese. Statins can adversely affect glucose homeostasis. In non-diabetics the risk of developing diabetes is increased by approximately 10% with higher doses of statins causing a greater risk than more moderate doses (131,132). The mechanism for this adverse effect is unknown but a recent study suggests that decreases in HMG-coenzyme A activity leads to weight gain, which could increase the risk of developing diabetes (133). Older patients who are obese with higher baseline glucose levels are at greatest risk for developing diabetes on statin therapy.


Muscle symptoms occur in patients with obesity similar to what is observed in normal weight patients. One study has shown that the cardiorespiratory benefits of exercise were blunted in patients who are overweight or obese on statin therapy (134). However, a recent review concluded that statins do not consistently reduce muscle strength, endurance, or overall exercise performance (135).


Statin outcome trials have not specifically focused on the benefits of statins in patients with obesity. However, subgroup analysis of the statin trials has demonstrated that the beneficial effects also occur in patients who are obese. In the Cholesterol Clinical Trialists meta-analysis, the reduction in cardiovascular events was no different in patients with a BMI greater than 30 or less than 25 (136,137). Thus, one can anticipate that statin treatment will achieve the same beneficial outcomes in patients who are obese as seen in the general population.


BILE ACID SEQUESTRANTS  


Bile acid sequestrants may increase serum TG levels, which can be a problem in some patients with obesity who are already hypertriglyceridemic (129). Colesevelam (Welchol) is a bile acid sequestrants that comes in pill or powder form that causes fewer side effects and has fewer interactions with other drugs than other preparations. Of particular note is that a number of studies have shown that colesevelam decreases A1c levels (approximately 0.5% decrease) and therefore this drug may have an added advantage in patients with obesity who are at high risk of developing diabetes (138).


NIACIN  


Niacin reduces insulin sensitivity (i.e., causes insulin resistance), which can worsen glycemic control (139). In the HPS2-Thrive trial, niacin therapy induced new onset diabetes in subjects that were non-diabetic (140). In patients with obesity, who are at an increased risk of developing diabetes, niacin therapy increases the risk of these patients progressing to diabetes. Niacin can also increase serum uric acid levels and induce gout, an abnormality that is already common in patients with obesity (139).


PCSK9 INHIBITORS


In 2015 two monoclonal antibodies that inhibit PCSK9 (proprotein convertase subtilisin kexin type 9) were approved for the lowering of LDL cholesterol levels; Alirocumab (Praluent) and evolocumab (Repatha) (129). Inclisiran, small interfering RNA that stimulates the catalytic breakdown of PCSK9 mRNA, was approved in the US in 2021. The reduction in LDL cholesterol levels with PCSK9 inhibitor treatment is similar in obese and non-obese subjects and results in a 50-60% decrease in LDL cholesterol levels when added to statin therapy (129,141-143).


BEMPEDOIC ACID


Bempedoic acid was approved in the US in February 2020 and is an adenosine triphosphate-citrate lyase (ACL) inhibitor that decreases hepatic cholesterol synthesis (129).  Patients with obesity often have elevated uric acid levels and an increased risk of gouty attacks and a major side effect of bempedoic acid is elevating uric acid levels (129). In clinical trials, 26% of bempedoic acid-treated patients with normal baseline uric acid values experienced hyperuricemia one or more times versus 9.5% in the placebo group (package insert). The increase in uric acid is due to bempedoic acid inhibiting renal tubular OAT2 (129). Elevations in blood uric acid levels may lead to the development of gout and gout was reported in 1.5% of patients treated with bempedoic acid vs. 0.4% of patients treated with placebo. The risk for gout attacks were higher in patients with a prior history of gout (11.2% for bempedoic acid treatment vs. 1.7% in the placebo group) (package insert). In patients with no prior history of gout only 1% of patients treated with bempedoic acid and 0.3% of the placebo group had a gouty attack (package insert).


EZETIMIBE, FIBRATES, AND OMEGA-3-FATTY ACIDS


These drugs are well tolerated in patients with obesity and their use in patients with obesity does not have any unique concerns.


TREATMENT APPROACH


The first priority in treating lipid disorders is to lower the LDL-C levels to goal, unless TG are markedly elevated (> 500-1000mg/dL), which increases the risk of pancreatitis. LDL-C is the first priority because the data linking lowering LDL-C with reducing cardiovascular disease are extremely strong and we now have the ability to markedly decrease LDL-C levels. Dietary therapy is the initial step but in the majority of patients’ dietary modifications will not be sufficient to achieve the LDL-C goals. If patients are willing and able to make major changes in their diet it is possible to achieve remarkable reductions in LDL-C levels but this seldom occurs in clinical practice.


Primary Prevention Patients


The first step is determining the risk for developing atherosclerotic cardiovascular disease. There are a number of different calculators for determining risk. In the US the most popular is the ACC/AHA risk calculator (http://www.cvriskcalculator.com/) whereas in Europe the SCORE (Systematic Coronary Risk Estimation) is popular (http://www.heartscore.org/en_GB/access). The ACC/AHA recommendations are shown in Figure 2 and the European Society of Cardiology/European Atherosclerosis Society (ESC/EAS) recommendations are shown in Figure 3 (45,47). Note that the risk shown in the ACC/AHA calculator is for major cardiovascular events while the risk in the SCORE calculator is for mortality.


Figure 2. ACC/AHA Recommendations for Patients without ASCVD, Diabetes, or LDL-C greater than 190mg/dL. Risk enhancers are listed in table 6. (Note the risk is for MI and stroke, both fatal and nonfatal)

Figure 3. European Society of Cardiology/European Atherosclerosis Society Recommendations for Primary Prevention Patients. Risk categories are shown in table 7. (Note that the SCORE risk is for a fatal event). Goals of therapy are shown in table 8.


Table 6. ASCVD Risk Enhancers (ACC/AHA)

Family history of premature ASCVD
Persistently elevated LDL > 160mg/dL
Chronic kidney disease
Metabolic syndrome
History of preeclampsia
History of premature menopause
Inflammatory disease (especially rheumatoid arthritis, psoriasis, HIV)
Ethnicity (e.g., South Asian ancestry)
Persistently elevated TG > 175mg/dL
Hs-CRP > 2mg/L
Lp(a) > 50mg/dL or >125nmol/L
Apo B > 130mg/dL
Ankle-brachial index (ABI) < 0.9


Table 7. Cardiovascular Risk Categories (ESC/EAS)

Very High Risk

ASCVD

DM with target organ damage or at least three major risk factors or early onset of T1DM of long duration (>20 years)

Severe CKD (eGFR <30 mL/min/1.73 m2)

A calculated SCORE >10% for 10-year risk of fatal CVD

FH with ASCVD or with another major risk factor

High Risk

Markedly elevated single risk factors, in particular TC >310 mg/dL, LDL-C >190 mg/dL, or BP >180/110 mmHg

Patients with FH without other major risk factors

Patients with DM without target organ damage with DM duration >10 years or another additional risk factor

Moderate CKD (eGFR 30-59 mL/min/1.73 m2).

A calculated SCORE >5% and <10% for 10-year risk of fatal CVD

Moderate Risk

Young patients (T1DM <35 years; T2DM <50 years) with DM duration <10 years, without other risk factors

Calculated SCORE >1 % and <5% for 10-year risk of fatal CVD.

Low Risk

Calculated SCORE <1% for 10-year risk of fatal CVD


Table 8. Treatment Targets and Goals (ECS/EAS)


LDL-C

Non-HDL-C**

Apo B**

Very High Risk

< 55mg/L; 1.4mmol/L*

< 85mg/dL; 2.2mmol/L

< 65mg/dL

High Risk

< 70mg/dL; 1.8mmol/L*

< 100mg/dL; 2.6mmol/L

< 80mg/dL

Moderate Risk

< 100mg/L; 2.6mmol/L

< 130mg/dL; 3.4mmol/L

< 100mg/dL

Low Risk

< 116mg/dL; 3.0mmol/L


*>50% LDL-C reduction from baseline; ** Secondary goals


A few caveats are worth noting. First, in patients less than 60 years of age it is very helpful to calculate the life-time risk of ASCVD events. Often one will find that the 10-year risk is modest but the life-time risk is high and this information should be included in the risk discussion to help in the decision process. Second, patients should be made aware of the natural history of ASCVD and that it begins early in life and slowly progresses overtime with high LDL-C levels accelerating the rate of development of atherosclerosis and low LDL-C leading to a slower progression of atherosclerosis (144). Third, patients should be made aware of genetic studies demonstrating that variants in genes that lead to lifetime decreases in LDL-C levels (for example the HMG-CoA reductase gene, NPC1L1 gene, PCSK9 gene, ATP citrate lyase gene, and LDL receptor gene) result in a decreased risk of cardiovascular events. In a recent study it was reported that a 10mg/dL lifetime decrease in LDL-C with any of these genetic variants was associated with a 16-18% decrease in cardiovascular events whereas a 10mg/dL reduction in LDL-C with lipid lowering therapy later in life results in only approximately a 5% decrease in cardiovascular events ((145,146). The combination of the natural history and the results observed with genetic variants strongly suggests that early therapy to lower LDL-C levels will have greater effects on reducing the risk of ASCVD events than starting therapy later in life. This information needs to be discussed with the patient. Fourth, when patients and/or health care providers are uncertain of the best course of action obtaining a cardiac calcium scan can be very helpful in the decision-making process, particularly in older individuals (45). A score of 0, particularly in an older patient would indicate that statin therapy is not needed whereas a score > 100 would indicate a need for statin therapy. A score of 1-99 favors the use of a statin.


In most primary prevention patients, statin therapy is sufficient to lower LDL-C levels to goal (< 100mg/dL). One can usually start with moderate statin therapy (for example atorvastatin 10-20mg or rosuvastatin 5-10mg) and increase the statin dose, if necessary, to achieve LDL-C goals. In some instances, primary prevention patients are at high risk (see figures 2 and 3) and should be started on intensive statin therapy with lower LDL-C goals. Statins are available as generic drugs and therefore are relatively inexpensive. If a patient does not achieve their LDL-C goal on intensive statin therapy, cannot tolerate statin therapy, or is able to take only a low dose of a statin one can use ezetimibe (generic drug), bempedoic acid, bile acid sequestrant, or PCSK9 inhibitors to further lower LDL-C levels (for detailed discussion of cholesterol lowering drugs see (129)). It should be noted that the addition of ezetimibe or a PCSK9 inhibitor to statin therapy has been shown to reduce cardiovascular events (147-150). Bempedoic acid has been shown to reduce cardiovascular event in statin intolerant patients (151). In most situations, ezetimibe is the drug of choice given its low cost, ability to reduce ASCVD events, and long-term safety record.


Patients with Diabetes


Most patients with diabetes without risk factors should be started on moderate statin therapy (for example atorvastatin 10-20mg or rosuvastatin 5-10mg) and the dose increased as needed to reach therapy goals. Patients with diabetes with ASCVD or risk factors should be started on intensive statin therapy. In my opinion reasonable goals are shown in table 9 (similar to AACE  and ECS/EAS guidelines) (47,49,152). If moderate statin therapy does not achieve the LDL-C goal the dose can be increased. If intensive therapy does not achieve LDL-C goals additional drugs can be added. If reasonably close to the LDL-C goal the initial drug added should be ezetimibe. If far from goal one could add a PCSK9 inhibitor. Once the LDL-C is at goal if the non-HDL-C remains high one can consider the approaches described in the section describing the approach to patients with LDL-C at goal and TG elevated.


Table 9. ASCVD Risk Categories and Treatment Goals

Risk Category

Risk Factors/10-year risk

LDL-C mg/dL

Non-HDL-C mg/dL

Extreme Risk

Diabetes and clinical cardiovascular disease

<55

<80

Very High Risk

Diabetes with one or more risk factors

<70

<100

High Risk

Diabetes and no other risk factors

<100

<130


Secondary Prevention Patients


Patients with ASCVD (secondary prevention patients) should be started on intensive statin therapy (atorvastatin 40-80mg per day or rosuvastatin 20-40mg per day). Given the extensive data showing that the lower the LDL-C the greater the reduction in ASCVD events most secondary prevention patients would benefit from the addition of ezetimibe to maximize LDL-C lowering without markedly increasing costs (146). The goal LDL-C in this patient population is an LDL<70mg/dL but many experts and some guidelines (ACCE, ECS/EAS) would prefer an LDL-C<55mg/dL if possible. If on intensive statin therapy and ezetimibe treatment the LDL-C is far above goal one could consider adding a PCSK9 inhibitor (this is particularly necessary if the LDL-C is greater than 100mg/dL or the patient is at very high risk due to other factors (diabetes, cerebral vascular disease, peripheral vascular disease, recent MI, history of multiple Mis, etc.)) (146).


Patients with LDL Cholesterol at Goal but High TG (>150mg/dL to <500mg/dL)


Patients with an LDL-C at goal but high TG levels (>150mg/dL to <500mg/dL) will often have increased non-HDL-C levels. Numerous studies have shown that the risk of ASCVD events is increased in this patient population (153). The initial step should be to improve lifestyle, treat secondary disorders that may be contributing to the increase in TG, and if possible, discontinue medications that increase TG levels (53). Studies have not demonstrated a reduction in cardiovascular events when niacin is added to statin therapy and given the side effects of niacin enthusiasm for using niacin in combination with statins to reduce ASCVD is limited (140,154). Similarly, the ACCORD-LIPID trial using fenofibrate and the PROMINENT trial using pemafibrate also failed to demonstrate that adding a fibrate to statin therapy reduces cardiovascular disease (155,156). Thus, there is no evidence that adding a fibrate to statin therapy in patients with high TG levels will reduce cardiovascular events. It should also be noted that in patients with diabetes fenofibrate reduces the development of diabetic microvascular disease (130).


Recently, the REDUCE-IT trial demonstrated that adding the omega-3-fatty acid icosapent ethyl (EPA; Vascepa) to statin therapy in patients with elevated TG levels reduced the risk of ASCVD events by 25% while decreasing TG levels by 18% (157). In this trial the reduction in TG levels was relatively modest and would not have been expected to result in the magnitude of the decrease in cardiovascular disease observed in the REDUCE-IT trial. Other actions of EPA, such as decreasing platelet function, anti-inflammation, decreasing lipid oxidation, stabilizing membranes, etc. could account for or contribute to the reduction in cardiovascular events (158). However, a very similar trial using a carboxylic acid formulation of EPA and DHA (STRENGTH Trial) while lowering the TG levels similar to that observed in the REDUCE-IT trial did not reduce cardiovascular events. This has led to controversy; does purified EPA have cardiovascular benefits that are not observed with the combination of DHA/EPA or was the use of mineral oil in the REDUCE-IT trial “toxic” increasing LDL-C levels and increasing inflammation? This controversy is discussed in another Endotext chapters (130) and in other publications (159,160). Ideally, this controversy will be resolved by a new cardiovascular outcome trial using icosapent ethyl without mineral oil serving as the placebo. In the meantime, in selected high-risk patients with LDL-C levels at goal and TG levels between 150-500mg/dL one can use icosapent ethyl therapy to reduce cardiovascular events.


Patients with Very High TG Levels (>500-1000mg/dL)


The main aim is to keep TG levels below 500 mg/dL to prevent TG-induced pancreatitis (161,162). Very high TG levels are frequently due to the coexistence of a genetic predisposition to hypertriglyceridemia with 1 or more secondary causes of hypertriglyceridemia (161,162). Initial treatment is a very low-fat diet to reduce TG levels into a safe range (<1000mg/dL). Treating secondary disorders that raise TG levels and when possible stopping drugs that increase TG levels is essential (161,162). Avoidance of simple sugars and ethanol is also indicated. If the TG levels remain above 500mg/dL the addition of fenofibrate or omega-3-fatty acids is indicated. Many patients with very high TG levels are at high risk for ASCVD and therefore after TG levels are controlled the patient should be evaluated for cardiovascular disease risk and if indicated LDL-C lowering therapy initiated.   


Decreased HDL Cholesterol Levels


There are no studies demonstrating that increasing HDL-C levels reduces cardiovascular disease (163). It should be recognized that the crucial issue with HDL may not be the HDL-C levels per se but rather the function of the HDL particles (163). Assays have been developed to determine the ability of HDL to facilitate cholesterol efflux from macrophages and these studies have shown that the levels of HDL-C do not necessarily indicate the ability to mediate cholesterol efflux (164). Similarly, the ability of HDL to protect LDL from oxidation may also play an important role in the ability of HDL to reduce ASCVD (165). Thus, the functional capability of HDL may be more important than HDL-C levels (164,165).


SUMMARY


In summary, modern therapy of patients with obesity demands that we aggressively treat lipids to reduce the high risk of cardiovascular disease in this susceptible population and in those with very high TG to reduce the risk of pancreatitis.


REFERENCES


  1. Flegal KM. Epidemiologic aspects of overweight and obesity in the United States. Physiol Behav 2005; 86:599-602
  2. Purnell JQ. Definitions, Classification, and Epidemiology of Obesity. In: Feingold KR, Anawalt B, Boyce A, Chrousos G, Dungan K, Grossman A, Hershman JM, Kaltsas G, Koch C, Kopp P, Korbonits M, McLachlan R, Morley JE, New M, Perreault L, Purnell J, Rebar R, Singer F, Trence DL, Vinik A, Wilson DP, eds. Endotext. South Dartmouth (MA)2018.
  3. Flegal KM, Kruszon-Moran D, Carroll MD, Fryar CD, Ogden CL. Trends in Obesity Among Adults in the United States, 2005 to 2014. JAMA 2016; 315:2284-2291
  4. Hedley AA, Ogden CL, Johnson CL, Carroll MD, Curtin LR, Flegal KM. Prevalence of overweight and obesity among US children, adolescents, and adults, 1999-2002. JAMA 2004; 291:2847-2850
  5. Collaborators GBDO, Afshin A, Forouzanfar MH, Reitsma MB, Sur P, Estep K, Lee A, Marczak L, Mokdad AH, Moradi-Lakeh M, Naghavi M, Salama JS, Vos T, Abate KH, Abbafati C, Ahmed MB, Al-Aly Z, Alkerwi A, Al-Raddadi R, Amare AT, Amberbir A, Amegah AK, Amini E, Amrock SM, Anjana RM, Arnlov J, Asayesh H, Banerjee A, Barac A, Baye E, Bennett DA, Beyene AS, Biadgilign S, Biryukov S, Bjertness E, Boneya DJ, Campos-Nonato I, Carrero JJ, Cecilio P, Cercy K, Ciobanu LG, Cornaby L, Damtew SA, Dandona L, Dandona R, Dharmaratne SD, Duncan BB, Eshrati B, Esteghamati A, Feigin VL, Fernandes JC, Furst T, Gebrehiwot TT, Gold A, Gona PN, Goto A, Habtewold TD, Hadush KT, Hafezi-Nejad N, Hay SI, Horino M, Islami F, Kamal R, Kasaeian A, Katikireddi SV, Kengne AP, Kesavachandran CN, Khader YS, Khang YH, Khubchandani J, Kim D, Kim YJ, Kinfu Y, Kosen S, Ku T, Defo BK, Kumar GA, Larson HJ, Leinsalu M, Liang X, Lim SS, Liu P, Lopez AD, Lozano R, Majeed A, Malekzadeh R, Malta DC, Mazidi M, McAlinden C, McGarvey ST, Mengistu DT, Mensah GA, Mensink GBM, Mezgebe HB, Mirrakhimov EM, Mueller UO, Noubiap JJ, Obermeyer CM, Ogbo FA, Owolabi MO, Patton GC, Pourmalek F, Qorbani M, Rafay A, Rai RK, Ranabhat CL, Reinig N, Safiri S, Salomon JA, Sanabria JR, Santos IS, Sartorius B, Sawhney M, Schmidhuber J, Schutte AE, Schmidt MI, Sepanlou SG, Shamsizadeh M, Sheikhbahaei S, Shin MJ, Shiri R, Shiue I, Roba HS, Silva DAS, Silverberg JI, Singh JA, Stranges S, Swaminathan S, Tabares-Seisdedos R, Tadese F, Tedla BA, Tegegne BS, Terkawi AS, Thakur JS, Tonelli M, Topor-Madry R, Tyrovolas S, Ukwaja KN, Uthman OA, Vaezghasemi M, Vasankari T, Vlassov VV, Vollset SE, Weiderpass E, Werdecker A, Wesana J, Westerman R, Yano Y, Yonemoto N, Yonga G, Zaidi Z, Zenebe ZM, Zipkin B, Murray CJL. Health Effects of Overweight and Obesity in 195 Countries over 25 Years. N Engl J Med 2017; 377:13-27
  6. Finkelstein EA, Khavjou OA, Thompson H, Trogdon JG, Pan L, Sherry B, Dietz W. Obesity and severe obesity forecasts through 2030. Am J Prev Med 2012; 42:563-570
  7. Kapoor N. Thin Fat Obesity: The Tropical Phenotype of Obesity. In: Feingold KR, Anawalt B, Blackman MR, Boyce A, Chrousos G, Corpas E, de Herder WW, Dhatariya K, Dungan K, Hofland J, Kalra S, Kaltsas G, Kapoor N, Koch C, Kopp P, Korbonits M, Kovacs CS, Kuohung W, Laferrere B, Levy M, McGee EA, McLachlan R, New M, Purnell J, Sahay R, Singer F, Sperling MA, Stratakis CA, Trence DL, Wilson DP, eds. Endotext. South Dartmouth (MA)2021.
  8. Kumar S, Kelly AS. Review of Childhood Obesity: From Epidemiology, Etiology, and Comorbidities to Clinical Assessment and Treatment. Mayo Clin Proc 2017; 92:251-265
  9. Bays HE, Toth PP, Kris-Etherton PM, Abate N, Aronne LJ, Brown WV, Gonzalez-Campoy JM, Jones SR, Kumar R, La Forge R, Samuel VT. Obesity, adiposity, and dyslipidemia: a consensus statement from the National Lipid Association. J Clin Lipidol 2013; 7:304-383
  10. Grundy SM. Obesity, metabolic syndrome, and cardiovascular disease. J Clin Endocrinol Metab 2004; 89:2595-2600
  11. Kyrou I, Randeva HS, Tsigos C, Kaltsas G, Weickert MO. Clinical Problems Caused by Obesity. In: Feingold KR, Anawalt B, Boyce A, Chrousos G, Dungan K, Grossman A, Hershman JM, Kaltsas G, Koch C, Kopp P, Korbonits M, McLachlan R, Morley JE, New M, Perreault L, Purnell J, Rebar R, Singer F, Trence DL, Vinik A, Wilson DP, eds. Endotext. South Dartmouth (MA)2018.
  12. Mandviwala T, Khalid U, Deswal A. Obesity and Cardiovascular Disease: a Risk Factor or a Risk Marker? Curr Atheroscler Rep 2016; 18:21
  13. Zalesin KC, Franklin BA, Miller WM, Peterson ED, McCullough PA. Impact of obesity on cardiovascular disease. Med Clin North Am 2011; 95:919-937
  14. Franssen R, Monajemi H, Stroes ES, Kastelein JJ. Obesity and dyslipidemia. Med Clin North Am 2011; 95:893-902
  15. Xiao C, Dash S, Morgantini C, Hegele RA, Lewis GF. Pharmacological Targeting of the Atherogenic Dyslipidemia Complex: The Next Frontier in CVD Prevention Beyond Lowering LDL Cholesterol. Diabetes 2016; 65:1767-1778
  16. Berneis KK, Krauss RM. Metabolic origins and clinical significance of LDL heterogeneity. J Lipid Res 2002; 43:1363-1379
  17. Masuda D, Yamashita S. Postprandial Hyperlipidemia and Remnant Lipoproteins. J Atheroscler Thromb 2017; 24:95-109
  18. Klop B, Elte JW, Cabezas MC. Dyslipidemia in obesity: mechanisms and potential targets. Nutrients 2013; 5:1218-1240
  19. Skinner AC, Perrin EM, Moss LA, Skelton JA. Cardiometabolic Risks and Severity of Obesity in Children and Young Adults. N Engl J Med 2015; 373:1307-1317
  20. Cameron AJ, Magliano DJ, Soderberg S. A systematic review of the impact of including both waist and hip circumference in risk models for cardiovascular diseases, diabetes and mortality. Obes Rev 2013; 14:86-94
  21. Grundy SM. Adipose tissue and metabolic syndrome: too much, too little or neither. Eur J Clin Invest 2015; 45:1209-1217
  22. Jensen MD. Role of body fat distribution and the metabolic complications of obesity. J Clin Endocrinol Metab2008; 93:S57-63
  23. Snijder MB, Zimmet PZ, Visser M, Dekker JM, Seidell JC, Shaw JE. Independent and opposite associations of waist and hip circumferences with diabetes, hypertension and dyslipidemia: the AusDiab Study. Int J Obes Relat Metab Disord 2004; 28:402-409
  24. Wohl D, Scherzer R, Heymsfield S, Simberkoff M, Sidney S, Bacchetti P, Grunfeld C, Investigators FS. The associations of regional adipose tissue with lipid and lipoprotein levels in HIV-infected men. J Acquir Immune Defic Syndr 2008; 48:44-52
  25. Bjornson E, Adiels M, Taskinen MR, Boren J. Kinetics of plasma triglycerides in abdominal obesity. Curr Opin Lipidol 2017; 28:11-18
  26. Yu YH, Ginsberg HN. Adipocyte signaling and lipid homeostasis: sequelae of insulin-resistant adipose tissue. Circ Res 2005; 96:1042-1052
  27. Jacome-Sosa MM, Parks EJ. Fatty acid sources and their fluxes as they contribute to plasma triglyceride concentrations and fatty liver in humans. Curr Opin Lipidol 2014; 25:213-220
  28. Li S, Brown MS, Goldstein JL. Bifurcation of insulin signaling pathway in rat liver: mTORC1 required for stimulation of lipogenesis, but not inhibition of gluconeogenesis. Proc Natl Acad Sci U S A 2010; 107:3441-3446
  29. Dash S, Xiao C, Morgantini C, Lewis GF. New Insights into the Regulation of Chylomicron Production. Annu Rev Nutr 2015; 35:265-294
  30. Chan DC, Watts GF, Redgrave TG, Mori TA, Barrett PH. Apolipoprotein B-100 kinetics in visceral obesity: associations with plasma apolipoprotein C-III concentration. Metabolism 2002; 51:1041-1046
  31. Feingold KR, Grunfeld C. Introduction to Lipids and Lipoproteins. In: Feingold KR, Anawalt B, Boyce A, Chrousos G, Dungan K, Grossman A, Hershman JM, Kaltsas G, Koch C, Kopp P, Korbonits M, McLachlan R, Morley JE, New M, Perreault L, Purnell J, Rebar R, Singer F, Trence DL, Vinik A, Wilson DP, eds. Endotext. South Dartmouth (MA)2018.
  32. Jorgensen AB, Frikke-Schmidt R, Nordestgaard BG, Tybjaerg-Hansen A. Loss-of-function mutations in APOC3 and risk of ischemic vascular disease. N Engl J Med 2014; 371:32-41
  33. Tg, Hdl Working Group of the Exome Sequencing Project NHL, Blood I, Crosby J, Peloso GM, Auer PL, Crosslin DR, Stitziel NO, Lange LA, Lu Y, Tang ZZ, Zhang H, Hindy G, Masca N, Stirrups K, Kanoni S, Do R, Jun G, Hu Y, Kang HM, Xue C, Goel A, Farrall M, Duga S, Merlini PA, Asselta R, Girelli D, Olivieri O, Martinelli N, Yin W, Reilly D, Speliotes E, Fox CS, Hveem K, Holmen OL, Nikpay M, Farlow DN, Assimes TL, Franceschini N, Robinson J, North KE, Martin LW, DePristo M, Gupta N, Escher SA, Jansson JH, Van Zuydam N, Palmer CN, Wareham N, Koch W, Meitinger T, Peters A, Lieb W, Erbel R, Konig IR, Kruppa J, Degenhardt F, Gottesman O, Bottinger EP, O'Donnell CJ, Psaty BM, Ballantyne CM, Abecasis G, Ordovas JM, Melander O, Watkins H, Orho-Melander M, Ardissino D, Loos RJ, McPherson R, Willer CJ, Erdmann J, Hall AS, Samani NJ, Deloukas P, Schunkert H, Wilson JG, Kooperberg C, Rich SS, Tracy RP, Lin DY, Altshuler D, Gabriel S, Nickerson DA, Jarvik GP, Cupples LA, Reiner AP, Boerwinkle E, Kathiresan S. Loss-of-function mutations in APOC3, triglycerides, and coronary disease. N Engl J Med 2014; 371:22-31
  34. Wulff AB, Nordestgaard BG, Tybjaerg-Hansen A. APOC3 Loss-of-Function Mutations, Remnant Cholesterol, Low-Density Lipoprotein Cholesterol, and Cardiovascular Risk: Mediation- and Meta-Analyses of 137 895 Individuals. Arterioscler Thromb Vasc Biol 2018; 38:660-668
  35. Gaudet D, Brisson D, Tremblay K, Alexander VJ, Singleton W, Hughes SG, Geary RS, Baker BF, Graham MJ, Crooke RM, Witztum JL. Targeting APOC3 in the familial chylomicronemia syndrome. N Engl J Med 2014; 371:2200-2206
  36. Feingold KR, Grunfeld C. The Effect of Inflammation and Infection on Lipids and Lipoproteins. In: Feingold KR, Anawalt B, Boyce A, Chrousos G, Dungan K, Grossman A, Hershman JM, Kaltsas G, Koch C, Kopp P, Korbonits M, McLachlan R, Morley JE, New M, Perreault L, Purnell J, Rebar R, Singer F, Trence DL, Vinik A, Wilson DP, eds. Endotext. South Dartmouth (MA)2019.
  37. Khovidhunkit W, Kim MS, Memon RA, Shigenaga JK, Moser AH, Feingold KR, Grunfeld C. Effects of infection and inflammation on lipid and lipoprotein metabolism: mechanisms and consequences to the host. J Lipid Res2004; 45:1169-1196
  38. Lara-Castro C, Fu Y, Chung BH, Garvey WT. Adiponectin and the metabolic syndrome: mechanisms mediating risk for metabolic and cardiovascular disease. Curr Opin Lipidol 2007; 18:263-270
  39. Christou GA, Kiortsis DN. Adiponectin and lipoprotein metabolism. Obes Rev 2013; 14:939-949
  40. Rashid S, Kastelein JJ. PCSK9 and resistin at the crossroads of the atherogenic dyslipidemia. Expert Rev Cardiovasc Ther 2013; 11:1567-1577
  41. Lu B, Moser A, Shigenaga JK, Grunfeld C, Feingold KR. The acute phase response stimulates the expression of angiopoietin like protein 4. Biochem Biophys Res Commun 2010; 391:1737-1741
  42. Feingold KR, Grunfeld C. The acute phase response inhibits reverse cholesterol transport. J Lipid Res 2010; 51:682-684
  43. Feingold KR, Grunfeld C. Effect of inflammation on HDL structure and function. Curr Opin Lipidol 2016; 27:521-530
  44. Expert Panel on D. An International Atherosclerosis Society position paper: global recommendations for the management of dyslipidemia: executive summary. Atherosclerosis 2014; 232:410-413
  45. Grundy SM, Stone NJ, Bailey AL, Beam C, Birtcher KK, Blumenthal RS, Braun LT, de Ferranti S, Faiella-Tommasino J, Forman DE, Goldberg R, Heidenreich PA, Hlatky MA, Jones DW, Lloyd-Jones D, Lopez-Pajares N, Ndumele CE, Orringer CE, Peralta CA, Saseen JJ, Smith SC, Jr., Sperling L, Virani SS, Yeboah J. 2018 AHA/ACC/AACVPR/AAPA/ABC/ACPM/ADA/AGS/APhA/ASPC/NLA/PCNA Guideline on the Management of Blood Cholesterol: A Report of the American College of Cardiology/American Heart Association Task Force on Clinical Practice Guidelines. Circulation 2019; 139:e1082-e1143
  46. Jellinger PS, Handelsman Y, Rosenblit PD, Bloomgarden ZT, Fonseca VA, Garber AJ, Grunberger G, Guerin CK, Bell DSH, Mechanick JI, Pessah-Pollack R, Wyne K, Smith D, Brinton EA, Fazio S, Davidson M. American Association of Clinical Endocrinologists and American College of Endocrinology Guidelines for Management of Dyslipidemia and Prevention of Cardiovascular Disease. Endocr Pract 2017; 23:1-87
  47. Mach F, Baigent C, Catapano AL, Koskinas KC, Casula M, Badimon L, Chapman MJ, De Backer GG, Delgado V, Ference BA, Graham IM, Halliday A, Landmesser U, Mihaylova B, Pedersen TR, Riccardi G, Richter DJ, Sabatine MS, Taskinen MR, Tokgozoglu L, Wiklund O, Group ESCSD. 2019 ESC/EAS Guidelines for the management of dyslipidaemias: lipid modification to reduce cardiovascular risk. Eur Heart J 2020; 41:111-188
  48. Jacobson TA, Ito MK, Maki KC, Orringer CE, Bays HE, Jones PH, McKenney JM, Grundy SM, Gill EA, Wild RA, Wilson DP, Brown WV. National Lipid Association recommendations for patient-centered management of dyslipidemia: part 1 - executive summary. J Clin Lipidol 2014; 8:473-488
  49. Handelsman Y JP, Guerin CK, Bloomgarden ZT, Brinton EA, Budoff MJ, Davidson MH, Einhorn D, Fazio S, Fonseca VA, Garber AJ,Grunberger G, Krauss RM, Mechanick JI, Rosenblit PD, Smith DA,  Wyne KL. CONSENSUS STATEMENT BY THE AMERICAN ASSOCIATION OF CLINICAL ENDOCRINOLOGISTS AND AMERICAN COLLEGE OF ENDOCRINOLOGY ON THE MANAGEMENT OF DYSLIPIDEMIA AND PREVENTION OF CARDIOVASCULAR DISEASE ALGORITHM – 2020 EXECUTIVE SUMMARY. Endocrine Practice 2020; 26:1-29
  50. Grundy SM, Feingold KR. Guidelines for the Management of High Blood Cholesterol. In: Feingold KR, Anawalt B, Boyce A, Chrousos G, Dungan K, Grossman A, Hershman JM, Kaltsas G, Koch C, Kopp P, Korbonits M, McLachlan R, Morley JE, New M, Perreault L, Purnell J, Rebar R, Singer F, Trence DL, Vinik A, Wilson DP, eds. Endotext. South Dartmouth (MA)2020.
  51. Bhatt D, Tannock L. Risk of Fasting and Non-Fasting Hypertriglyceridemia in Coronary Vascular Disease and Pancreatitis. In: Feingold KR, Anawalt B, Boyce A, Chrousos G, Dungan K, Grossman A, Hershman JM, Kaltsas G, Koch C, Kopp P, Korbonits M, McLachlan R, Morley JE, New M, Perreault L, Purnell J, Rebar R, Singer F, Trence DL, Vinik A, Wilson DP, eds. Endotext. South Dartmouth (MA)2018.
  52. Berglund L, Brunzell JD, Goldberg AC, Goldberg IJ, Sacks F, Murad MH, Stalenhoef AF, Endocrine s. Evaluation and treatment of hypertriglyceridemia: an Endocrine Society clinical practice guideline. J Clin Endocrinol Metab 2012; 97:2969-2989
  53. Feingold KR. Approach to the Patient with Dyslipidemia. In: Feingold KR, Anawalt B, Boyce A, Chrousos G, Dungan K, Grossman A, Hershman JM, Kaltsas G, Koch C, Kopp P, Korbonits M, McLachlan R, Morley JE, New M, Perreault L, Purnell J, Rebar R, Singer F, Trence DL, Vinik A, Wilson DP, eds. Endotext. South Dartmouth (MA)2020.
  54. Feingold KR. The Effect of Diet on Cardiovascular Disease and Lipid and Lipoprotein Levels. In: Feingold KR, Anawalt B, Blackman MR, Boyce A, Chrousos G, Corpas E, de Herder WW, Dhatariya K, Dungan K, Hofland J, Kalra S, Kaltsas G, Kapoor N, Koch C, Kopp P, Korbonits M, Kovacs CS, Kuohung W, Laferrere B, Levy M, McGee EA, McLachlan R, New M, Purnell J, Sahay R, Singer F, Sperling MA, Stratakis CA, Trence DL, Wilson DP, eds. Endotext. South Dartmouth (MA)2021.
  55. Dwyer JT, Melanson KJ, Sriprachy-anunt U, Cross P, Wilson M. Dietary Treatment of Obesity. In: Feingold KR, Anawalt B, Boyce A, Chrousos G, Dungan K, Grossman A, Hershman JM, Kaltsas G, Koch C, Kopp P, Korbonits M, McLachlan R, Morley JE, New M, Perreault L, Purnell J, Rebar R, Singer F, Trence DL, Vinik A, Wilson DP, eds. Endotext. South Dartmouth (MA)2015.
  56. Dattilo AM, Kris-Etherton PM. Effects of weight reduction on blood lipids and lipoproteins: a meta-analysis. Am J Clin Nutr 1992; 56:320-328
  57. Zomer E, Gurusamy K, Leach R, Trimmer C, Lobstein T, Morris S, James WP, Finer N. Interventions that cause weight loss and the impact on cardiovascular risk factors: a systematic review and meta-analysis. Obes Rev2016; 17:1001-1011
  58. Hasan B, Nayfeh T, Alzuabi M, Wang Z, Kuchkuntla AR, Prokop LJ, Newman CB, Murad MH, Rajjo TI. Weight Loss and Serum Lipids in Overweight and Obese Adults: A Systematic Review and Meta-Analysis. J Clin Endocrinol Metab 2020; 105
  59. Unick JL, Beavers D, Bond DS, Clark JM, Jakicic JM, Kitabchi AE, Knowler WC, Wadden TA, Wagenknecht LE, Wing RR, Look ARG. The long-term effectiveness of a lifestyle intervention in severely obese individuals. Am J Med 2013; 126:236-242, 242 e231-232
  60. Stelmach-Mardas M, Walkowiak J. Dietary Interventions and Changes in Cardio-Metabolic Parameters in Metabolically Healthy Obese Subjects: A Systematic Review with Meta-Analysis. Nutrients 2016; 8
  61. Rajjo T, Almasri J, Al Nofal A, Farah W, Alsawas M, Ahmed AT, Mohammed K, Kanwar A, Asi N, Wang Z, Prokop LJ, Murad MH. The Association of Weight Loss and Cardiometabolic Outcomes in Obese Children: Systematic Review and Meta-regression. J Clin Endocrinol Metab 2016; 101:4764-4768
  62. Sacks FM, Bray GA, Carey VJ, Smith SR, Ryan DH, Anton SD, McManus K, Champagne CM, Bishop LM, Laranjo N, Leboff MS, Rood JC, de Jonge L, Greenway FL, Loria CM, Obarzanek E, Williamson DA. Comparison of weight-loss diets with different compositions of fat, protein, and carbohydrates. N Engl J Med2009; 360:859-873
  63. Foster GD, Wyatt HR, Hill JO, Makris AP, Rosenbaum DL, Brill C, Stein RI, Mohammed BS, Miller B, Rader DJ, Zemel B, Wadden TA, Tenhave T, Newcomb CW, Klein S. Weight and metabolic outcomes after 2 years on a low-carbohydrate versus low-fat diet: a randomized trial. Ann Intern Med 2010; 153:147-157
  64. Hu T, Mills KT, Yao L, Demanelis K, Eloustaz M, Yancy WS, Jr., Kelly TN, He J, Bazzano LA. Effects of low-carbohydrate diets versus low-fat diets on metabolic risk factors: a meta-analysis of randomized controlled clinical trials. Am J Epidemiol 2012; 176 Suppl 7:S44-54
  65. Johnston BC, Kanters S, Bandayrel K, Wu P, Naji F, Siemieniuk RA, Ball GD, Busse JW, Thorlund K, Guyatt G, Jansen JP, Mills EJ. Comparison of weight loss among named diet programs in overweight and obese adults: a meta-analysis. JAMA 2014; 312:923-933
  66. Mansoor N, Vinknes KJ, Veierod MB, Retterstol K. Effects of low-carbohydrate diets v. low-fat diets on body weight and cardiovascular risk factors: a meta-analysis of randomised controlled trials. Br J Nutr 2016; 115:466-479
  67. Naude CE, Schoonees A, Senekal M, Young T, Garner P, Volmink J. Low carbohydrate versus isoenergetic balanced diets for reducing weight and cardiovascular risk: a systematic review and meta-analysis. PLoS One2014; 9:e100652
  68. Schwingshackl L, Hoffmann G. Comparison of effects of long-term low-fat vs high-fat diets on blood lipid levels in overweight or obese patients: a systematic review and meta-analysis. J Acad Nutr Diet 2013; 113:1640-1661
  69. Bueno NB, de Melo IS, de Oliveira SL, da Rocha Ataide T. Very-low-carbohydrate ketogenic diet v. low-fat diet for long-term weight loss: a meta-analysis of randomised controlled trials. Br J Nutr 2013; 110:1178-1187
  70. Norwitz NG, Feldman D, Soto-Mota A, Kalayjian T, Ludwig DS. Elevated LDL Cholesterol with a Carbohydrate-Restricted Diet: Evidence for a "Lean Mass Hyper-Responder" Phenotype. Curr Dev Nutr 2022; 6:nzab144
  71. Norwitz NG, Mindrum MR, Giral P, Kontush A, Soto-Mota A, Wood TR, D'Agostino DP, Manubolu VS, Budoff M, Krauss RM. Elevated LDL-cholesterol levels among lean mass hyper-responders on low-carbohydrate ketogenic diets deserve urgent clinical attention and further research. J Clin Lipidol 2022; 16:765-768
  72. Houttu V, Grefhorst A, Cohn DM, Levels JHM, Roeters van Lennep J, Stroes ESG, Groen AK, Tromp TR. Severe Dyslipidemia Mimicking Familial Hypercholesterolemia Induced by High-Fat, Low-Carbohydrate Diets: A Critical Review. Nutrients 2023; 15
  73. Goldberg IJ, Ibrahim N, Bredefeld C, Foo S, Lim V, Gutman D, Huggins LA, Hegele RA. Ketogenic diets, not for everyone. J Clin Lipidol 2021; 15:61-67
  74. Schaffer AE, D'Alessio DA, Guyton JR. Extreme elevations of low-density lipoprotein cholesterol with very low carbohydrate, high fat diets. J Clin Lipidol 2021; 15:525-526
  75. Schmidt T, Harmon DM, Kludtke E, Mickow A, Simha V, Kopecky S. Dramatic elevation of LDL cholesterol from ketogenic-dieting: A Case Series. Am J Prev Cardiol 2023; 14:100495
  76. Wycherley TP, Moran LJ, Clifton PM, Noakes M, Brinkworth GD. Effects of energy-restricted high-protein, low-fat compared with standard-protein, low-fat diets: a meta-analysis of randomized controlled trials. Am J Clin Nutr2012; 96:1281-1298
  77. Schwingshackl L, Hoffmann G. Long-term effects of low-fat diets either low or high in protein on cardiovascular and metabolic risk factors: a systematic review and meta-analysis. Nutr J 2013; 12:48
  78. Ge L, Sadeghirad B, Ball GDC, da Costa BR, Hitchcock CL, Svendrovski A, Kiflen R, Quadri K, Kwon HY, Karamouzian M, Adams-Webber T, Ahmed W, Damanhoury S, Zeraatkar D, Nikolakopoulou A, Tsuyuki RT, Tian J, Yang K, Guyatt GH, Johnston BC. Comparison of dietary macronutrient patterns of 14 popular named dietary programmes for weight and cardiovascular risk factor reduction in adults: systematic review and network meta-analysis of randomised trials. BMJ 2020; 369:m696
  79. Dansinger ML, Gleason JA, Griffith JL, Selker HP, Schaefer EJ. Comparison of the Atkins, Ornish, Weight Watchers, and Zone diets for weight loss and heart disease risk reduction: a randomized trial. JAMA 2005; 293:43-53
  80. Goff LM, Cowland DE, Hooper L, Frost GS. Low glycaemic index diets and blood lipids: a systematic review and meta-analysis of randomised controlled trials. Nutr Metab Cardiovasc Dis 2013; 23:1-10
  81. Sacks FM, Carey VJ, Anderson CA, Miller ER, 3rd, Copeland T, Charleston J, Harshfield BJ, Laranjo N, McCarron P, Swain J, White K, Yee K, Appel LJ. Effects of high vs low glycemic index of dietary carbohydrate on cardiovascular disease risk factors and insulin sensitivity: the OmniCarb randomized clinical trial. JAMA 2014; 312:2531-2541
  82. DiPietro L, Stachenfeld NS. Exercise Treatment of Obesity. In: Feingold KR, Anawalt B, Boyce A, Chrousos G, Dungan K, Grossman A, Hershman JM, Kaltsas G, Koch C, Kopp P, Korbonits M, McLachlan R, Morley JE, New M, Perreault L, Purnell J, Rebar R, Singer F, Trence DL, Vinik A, Wilson DP, eds. Endotext. South Dartmouth (MA)2015.
  83. Shaw K, Gennat H, O'Rourke P, Del Mar C. Exercise for overweight or obesity. Cochrane Database Syst Rev2006:CD003817
  84. Ahmed HM, Blaha MJ, Nasir K, Rivera JJ, Blumenthal RS. Effects of physical activity on cardiovascular disease. Am J Cardiol 2012; 109:288-295
  85. Sarzynski MA, Burton J, Rankinen T, Blair SN, Church TS, Despres JP, Hagberg JM, Landers-Ramos R, Leon AS, Mikus CR, Rao DC, Seip RL, Skinner JS, Slentz CA, Thompson PD, Wilund KR, Kraus WE, Bouchard C. The effects of exercise on the lipoprotein subclass profile: A meta-analysis of 10 interventions. Atherosclerosis2015; 243:364-372
  86. Kodama S, Tanaka S, Saito K, Shu M, Sone Y, Onitake F, Suzuki E, Shimano H, Yamamoto S, Kondo K, Ohashi Y, Yamada N, Sone H. Effect of aerobic exercise training on serum levels of high-density lipoprotein cholesterol: a meta-analysis. Arch Intern Med 2007; 167:999-1008
  87. Lemes IR, Ferreira PH, Linares SN, Machado AF, Pastre CM, Netto JJ. Resistance training reduces systolic blood pressure in metabolic syndrome: a systematic review and meta-analysis of randomised controlled trials. Br J Sports Med 2016; 50:1438-1442
  88. Tchang BG, Kumar RB, Aronne LJ. Pharmacologic Treatment of Overweight and Obesity in Adults. In: Feingold KR, Anawalt B, Boyce A, Chrousos G, de Herder WW, Dungan K, Grossman A, Hershman JM, Hofland HJ, Kaltsas G, Koch C, Kopp P, Korbonits M, McLachlan R, Morley JE, New M, Purnell J, Singer F, Stratakis CA, Trence DL, Wilson DP, eds. Endotext. South Dartmouth (MA)2020.
  89. Sjostrom L, Rissanen A, Andersen T, Boldrin M, Golay A, Koppeschaar HP, Krempf M. Randomised placebo-controlled trial of orlistat for weight loss and prevention of weight regain in obese patients. European Multicentre Orlistat Study Group. Lancet 1998; 352:167-172
  90. Swinburn BA, Carey D, Hills AP, Hooper M, Marks S, Proietto J, Strauss BJ, Sullivan D, Welborn TA, Caterson ID. Effect of orlistat on cardiovascular disease risk in obese adults. Diabetes Obes Metab 2005; 7:254-262
  91. Mannucci E, Dicembrini I, Rotella F, Rotella CM. Orlistat and sibutramine beyond weight loss. Nutr Metab Cardiovasc Dis 2008; 18:342-348
  92. Nakou ES, Filippatos TD, Georgoula M, Kiortsis DN, Tselepis AD, Mikhailidis DP, Elisaf MS. The effect of orlistat and ezetimibe, alone or in combination, on serum LDL and small dense LDL cholesterol levels in overweight and obese patients with hypercholesterolaemia. Curr Med Res Opin 2008; 24:1919-1929
  93. Mittendorfer B, Ostlund RE, Jr., Patterson BW, Klein S. Orlistat inhibits dietary cholesterol absorption. Obes Res2001; 9:599-604
  94. Alqahtani S, Qosa H, Primeaux B, Kaddoumi A. Orlistat limits cholesterol intestinal absorption by Niemann-pick C1-like 1 (NPC1L1) inhibition. Eur J Pharmacol 2015; 762:263-269
  95. Sahebkar A, Simental-Mendia LE, Reiner Z, Kovanen PT, Simental-Mendia M, Bianconi V, Pirro M. Effect of orlistat on plasma lipids and body weight: A systematic review and meta-analysis of 33 randomized controlled trials. Pharmacol Res 2017; 122:53-65
  96. Blackett P, Tryggestad J, Krishnan S, Li S, Xu W, Alaupovic P, Quiroga C, Copeland K. Lipoprotein abnormalities in compound heterozygous lipoprotein lipase deficiency after treatment with a low-fat diet and orlistat. J Clin Lipidol 2013; 7:132-139
  97. Allison DB, Gadde KM, Garvey WT, Peterson CA, Schwiers ML, Najarian T, Tam PY, Troupin B, Day WW. Controlled-release phentermine/topiramate in severely obese adults: a randomized controlled trial (EQUIP). Obesity (Silver Spring) 2012; 20:330-342
  98. Gadde KM, Allison DB, Ryan DH, Peterson CA, Troupin B, Schwiers ML, Day WW. Effects of low-dose, controlled-release, phentermine plus topiramate combination on weight and associated comorbidities in overweight and obese adults (CONQUER): a randomised, placebo-controlled, phase 3 trial. Lancet 2011; 377:1341-1352
  99. Garvey WT, Ryan DH, Look M, Gadde KM, Allison DB, Peterson CA, Schwiers M, Day WW, Bowden CH. Two-year sustained weight loss and metabolic benefits with controlled-release phentermine/topiramate in obese and overweight adults (SEQUEL): a randomized, placebo-controlled, phase 3 extension study. Am J Clin Nutr 2012; 95:297-308
  100. Apovian CM, Aronne L, Rubino D, Still C, Wyatt H, Burns C, Kim D, Dunayevich E, Group C-IS. A randomized, phase 3 trial of naltrexone SR/bupropion SR on weight and obesity-related risk factors (COR-II). Obesity (Silver Spring) 2013; 21:935-943
  101. Greenway FL, Dunayevich E, Tollefson G, Erickson J, Guttadauria M, Fujioka K, Cowley MA, Group NBS. Comparison of combined bupropion and naltrexone therapy for obesity with monotherapy and placebo. J Clin Endocrinol Metab 2009; 94:4898-4906
  102. Greenway FL, Fujioka K, Plodkowski RA, Mudaliar S, Guttadauria M, Erickson J, Kim DD, Dunayevich E, Group C-IS. Effect of naltrexone plus bupropion on weight loss in overweight and obese adults (COR-I): a multicentre, randomised, double-blind, placebo-controlled, phase 3 trial. Lancet 2010; 376:595-605
  103. Wadden TA, Foreyt JP, Foster GD, Hill JO, Klein S, O'Neil PM, Perri MG, Pi-Sunyer FX, Rock CL, Erickson JS, Maier HN, Kim DD, Dunayevich E. Weight loss with naltrexone SR/bupropion SR combination therapy as an adjunct to behavior modification: the COR-BMOD trial. Obesity (Silver Spring) 2011; 19:110-120
  104. Pi-Sunyer X, Astrup A, Fujioka K, Greenway F, Halpern A, Krempf M, Lau DC, le Roux CW, Violante Ortiz R, Jensen CB, Wilding JP, Obesity S, Prediabetes NNSG. A Randomized, Controlled Trial of 3.0 mg of Liraglutide in Weight Management. N Engl J Med 2015; 373:11-22
  105. Astrup A, Rossner S, Van Gaal L, Rissanen A, Niskanen L, Al Hakim M, Madsen J, Rasmussen MF, Lean ME, Group NNS. Effects of liraglutide in the treatment of obesity: a randomised, double-blind, placebo-controlled study. Lancet 2009; 374:1606-1616
  106. Davies MJ, Bergenstal R, Bode B, Kushner RF, Lewin A, Skjoth TV, Andreasen AH, Jensen CB, DeFronzo RA, Group NNS. Efficacy of Liraglutide for Weight Loss Among Patients With Type 2 Diabetes: The SCALE Diabetes Randomized Clinical Trial. JAMA 2015; 314:687-699
  107. Wilding JPH, Batterham RL, Calanna S, Davies M, Van Gaal LF, Lingvay I, McGowan BM, Rosenstock J, Tran MTD, Wadden TA, Wharton S, Yokote K, Zeuthen N, Kushner RF, Group SS. Once-Weekly Semaglutide in Adults with Overweight or Obesity. N Engl J Med 2021; 384:989-1002
  108. Davies M, Faerch L, Jeppesen OK, Pakseresht A, Pedersen SD, Perreault L, Rosenstock J, Shimomura I, Viljoen A, Wadden TA, Lingvay I, Group SS. Semaglutide 2.4 mg once a week in adults with overweight or obesity, and type 2 diabetes (STEP 2): a randomised, double-blind, double-dummy, placebo-controlled, phase 3 trial. Lancet 2021; 397:971-984
  109. Wadden TA, Bailey TS, Billings LK, Davies M, Frias JP, Koroleva A, Lingvay I, O'Neil PM, Rubino DM, Skovgaard D, Wallenstein SOR, Garvey WT, Investigators S. Effect of Subcutaneous Semaglutide vs Placebo as an Adjunct to Intensive Behavioral Therapy on Body Weight in Adults With Overweight or Obesity: The STEP 3 Randomized Clinical Trial. JAMA 2021; 325:1403-1413
  110. Nauck MA, Meier JJ, Cavender MA, Abd El Aziz M, Drucker DJ. Cardiovascular Actions and Clinical Outcomes With Glucagon-Like Peptide-1 Receptor Agonists and Dipeptidyl Peptidase-4 Inhibitors. Circulation 2017; 136:849-870
  111. Kim TY, Kim S, Schafer AL. Medical Management of the Postoperative Bariatric Surgery Patient. In: Feingold KR, Anawalt B, Boyce A, Chrousos G, Dungan K, Grossman A, Hershman JM, Kaltsas G, Koch C, Kopp P, Korbonits M, McLachlan R, Morley JE, New M, Perreault L, Purnell J, Rebar R, Singer F, Trence DL, Vinik A, Wilson DP, eds. Endotext. South Dartmouth (MA)2017.
  112. O'Brien P. Surgical Treatment of Obesity. In: Feingold KR, Anawalt B, Boyce A, Chrousos G, Dungan K, Grossman A, Hershman JM, Kaltsas G, Koch C, Kopp P, Korbonits M, McLachlan R, Morley JE, New M, Perreault L, Purnell J, Rebar R, Singer F, Trence DL, Vinik A, Wilson DP, eds. Endotext. South Dartmouth (MA)2016.
  113. Gloy VL, Briel M, Bhatt DL, Kashyap SR, Schauer PR, Mingrone G, Bucher HC, Nordmann AJ. Bariatric surgery versus non-surgical treatment for obesity: a systematic review and meta-analysis of randomised controlled trials. BMJ 2013; 347:f5934
  114. Dash S, Xiao C, Lewis GF. Effects of bariatric surgery on hepatic and intestinal lipoprotein particle metabolism. Curr Opin Lipidol 2016; 27:14-18
  115. Heffron SP, Parikh A, Volodarskiy A, Ren-Fielding C, Schwartzbard A, Nicholson J, Bangalore S. Changes in Lipid Profile of Obese Patients Following Contemporary Bariatric Surgery: A Meta-Analysis. Am J Med 2016; 129:952-959
  116. Nguyen NT, Varela E, Sabio A, Tran CL, Stamos M, Wilson SE. Resolution of hyperlipidemia after laparoscopic Roux-en-Y gastric bypass. J Am Coll Surg 2006; 203:24-29
  117. Griffo E, Cotugno M, Nosso G, Saldalamacchia G, Mangione A, Angrisani L, Rivellese AA, Capaldo B. Effects of Sleeve Gastrectomy and Gastric Bypass on Postprandial Lipid Profile in Obese Type 2 Diabetic Patients: a 2-Year Follow-up. Obes Surg 2016; 26:1247-1253
  118. Lin BX, Weiss MC, Parikh M, Berger JS, Fisher EA, Heffron SP. Changes in lipoprotein(a) following bariatric surgery. Am Heart J 2018; 197:175-176
  119. Boman L, Ericson M. Lipoprotein A levels after intestinal bypass operation for morbid obesity. Obes Surg 1997; 7:125-127
  120. Aron-Wisnewsky J, Julia Z, Poitou C, Bouillot JL, Basdevant A, Chapman MJ, Clement K, Guerin M. Effect of bariatric surgery-induced weight loss on SR-BI-, ABCG1-, and ABCA1-mediated cellular cholesterol efflux in obese women. J Clin Endocrinol Metab 2011; 96:1151-1159
  121. Heffron SP, Lin BX, Parikh M, Scolaro B, Adelman SJ, Collins HL, Berger JS, Fisher EA. Changes in High-Density Lipoprotein Cholesterol Efflux Capacity After Bariatric Surgery Are Procedure Dependent. Arterioscler Thromb Vasc Biol 2018; 38:245-254
  122. Osto E, Doytcheva P, Corteville C, Bueter M, Dorig C, Stivala S, Buhmann H, Colin S, Rohrer L, Hasballa R, Tailleux A, Wolfrum C, Tona F, Manz J, Vetter D, Spliethoff K, Vanhoutte PM, Landmesser U, Pattou F, Staels B, Matter CM, Lutz TA, Luscher TF. Rapid and body weight-independent improvement of endothelial and high-density lipoprotein function after Roux-en-Y gastric bypass: role of glucagon-like peptide-1. Circulation 2015; 131:871-881
  123. Peterli R, Wolnerhanssen BK, Peters T, Vetter D, Kroll D, Borbely Y, Schultes B, Beglinger C, Drewe J, Schiesser M, Nett P, Bueter M. Effect of Laparoscopic Sleeve Gastrectomy vs Laparoscopic Roux-en-Y Gastric Bypass on Weight Loss in Patients With Morbid Obesity: The SM-BOSS Randomized Clinical Trial. JAMA 2018; 319:255-265
  124. Salminen P, Helmio M, Ovaska J, Juuti A, Leivonen M, Peromaa-Haavisto P, Hurme S, Soinio M, Nuutila P, Victorzon M. Effect of Laparoscopic Sleeve Gastrectomy vs Laparoscopic Roux-en-Y Gastric Bypass on Weight Loss at 5 Years Among Patients With Morbid Obesity: The SLEEVEPASS Randomized Clinical Trial. JAMA2018; 319:241-254
  125. Schauer PR, Bhatt DL, Kirwan JP, Wolski K, Aminian A, Brethauer SA, Navaneethan SD, Singh RP, Pothier CE, Nissen SE, Kashyap SR, Investigators S. Bariatric Surgery versus Intensive Medical Therapy for Diabetes - 5-Year Outcomes. N Engl J Med 2017; 376:641-651
  126. Li JF, Lai DD, Ni B, Sun KX. Comparison of laparoscopic Roux-en-Y gastric bypass with laparoscopic sleeve gastrectomy for morbid obesity or type 2 diabetes mellitus: a meta-analysis of randomized controlled trials. Can J Surg 2013; 56:E158-164
  127. Puzziferri N, Roshek TB, 3rd, Mayo HG, Gallagher R, Belle SH, Livingston EH. Long-term follow-up after bariatric surgery: a systematic review. JAMA 2014; 312:934-942
  128. Schauer PR, Nissen SE. After 70 Years, Metabolic Surgery Has Earned a Cardiovascular Outcome Trial. Circulation 2021; 143:1481-1483
  129. Feingold KR. Cholesterol Lowering Drugs. In: Feingold KR, Anawalt B, Boyce A, Chrousos G, Dungan K, Grossman A, Hershman JM, Kaltsas G, Koch C, Kopp P, Korbonits M, McLachlan R, Morley JE, New M, Perreault L, Purnell J, Rebar R, Singer F, Trence DL, Vinik A, Wilson DP, eds. Endotext. South Dartmouth (MA)2021.
  130. Feingold KR. Triglyceride Lowering Drugs. In: Feingold KR, Anawalt B, Boyce A, Chrousos G, Dungan K, Grossman A, Hershman JM, Kaltsas G, Koch C, Kopp P, Korbonits M, McLachlan R, Morley JE, New M, Perreault L, Purnell J, Rebar R, Singer F, Trence DL, Vinik A, Wilson DP, eds. Endotext. South Dartmouth (MA)2021.
  131. Preiss D, Sattar N. Statins and the risk of new-onset diabetes: a review of recent evidence. Curr Opin Lipidol2011; 22:460-466
  132. Sattar N, Preiss D, Murray HM, Welsh P, Buckley BM, de Craen AJ, Seshasai SR, McMurray JJ, Freeman DJ, Jukema JW, Macfarlane PW, Packard CJ, Stott DJ, Westendorp RG, Shepherd J, Davis BR, Pressel SL, Marchioli R, Marfisi RM, Maggioni AP, Tavazzi L, Tognoni G, Kjekshus J, Pedersen TR, Cook TJ, Gotto AM, Clearfield MB, Downs JR, Nakamura H, Ohashi Y, Mizuno K, Ray KK, Ford I. Statins and risk of incident diabetes: a collaborative meta-analysis of randomised statin trials. Lancet 2010; 375:735-742
  133. Swerdlow DI, Preiss D, Kuchenbaecker KB, Holmes MV, Engmann JE, Shah T, Sofat R, Stender S, Johnson PC, Scott RA, Leusink M, Verweij N, Sharp SJ, Guo Y, Giambartolomei C, Chung C, Peasey A, Amuzu A, Li K, Palmen J, Howard P, Cooper JA, Drenos F, Li YR, Lowe G, Gallacher J, Stewart MC, Tzoulaki I, Buxbaum SG, van der AD, Forouhi NG, Onland-Moret NC, van der Schouw YT, Schnabel RB, Hubacek JA, Kubinova R, Baceviciene M, Tamosiunas A, Pajak A, Topor-Madry R, Stepaniak U, Malyutina S, Baldassarre D, Sennblad B, Tremoli E, de Faire U, Veglia F, Ford I, Jukema JW, Westendorp RG, de Borst GJ, de Jong PA, Algra A, Spiering W, der Zee AH, Klungel OH, de Boer A, Doevendans PA, Eaton CB, Robinson JG, Duggan D, Diagram Consortium MCIC, Kjekshus J, Downs JR, Gotto AM, Keech AC, Marchioli R, Tognoni G, Sever PS, Poulter NR, Waters DD, Pedersen TR, Amarenco P, Nakamura H, McMurray JJ, Lewsey JD, Chasman DI, Ridker PM, Maggioni AP, Tavazzi L, Ray KK, Seshasai SR, Manson JE, Price JF, Whincup PH, Morris RW, Lawlor DA, Smith GD, Ben-Shlomo Y, Schreiner PJ, Fornage M, Siscovick DS, Cushman M, Kumari M, Wareham NJ, Verschuren WM, Redline S, Patel SR, Whittaker JC, Hamsten A, Delaney JA, Dale C, Gaunt TR, Wong A, Kuh D, Hardy R, Kathiresan S, Castillo BA, van der Harst P, Brunner EJ, Tybjaerg-Hansen A, Marmot MG, Krauss RM, Tsai M, Coresh J, Hoogeveen RC, Psaty BM, Lange LA, Hakonarson H, Dudbridge F, Humphries SE, Talmud PJ, Kivimaki M, Timpson NJ, Langenberg C, Asselbergs FW, Voevoda M, Bobak M, Pikhart H, Wilson JG, Reiner AP, Keating BJ, Hingorani AD, Sattar N. HMG-coenzyme A reductase inhibition, type 2 diabetes, and bodyweight: evidence from genetic analysis and randomised trials. Lancet 2014;
  134. Mikus CR, Boyle LJ, Borengasser SJ, Oberlin DJ, Naples SP, Fletcher J, Meers GM, Ruebel M, Laughlin MH, Dellsperger KC, Fadel PJ, Thyfault JP. Simvastatin impairs exercise training adaptations. J Am Coll Cardiol2013; 62:709-714
  135. Noyes AM, Thompson PD. The effects of statins on exercise and physical activity. J Clin Lipidol 2017; 11:1134-1144
  136. Baigent C, Keech A, Kearney PM, Blackwell L, Buck G, Pollicino C, Kirby A, Sourjina T, Peto R, Collins R, Simes R, Cholesterol Treatment Trialists C. Efficacy and safety of cholesterol-lowering treatment: prospective meta-analysis of data from 90,056 participants in 14 randomised trials of statins. Lancet 2005; 366:1267-1278
  137. Cholesterol Treatment Trialists C, Baigent C, Blackwell L, Emberson J, Holland LE, Reith C, Bhala N, Peto R, Barnes EH, Keech A, Simes J, Collins R. Efficacy and safety of more intensive lowering of LDL cholesterol: a meta-analysis of data from 170,000 participants in 26 randomised trials. Lancet 2010; 376:1670-1681
  138. Ooi CP, Loke SC. Colesevelam for type 2 diabetes mellitus. Cochrane Database Syst Rev 2012; 12:CD009361
  139. Song WL, FitzGerald GA. Niacin, an old drug with a new twist. J Lipid Res 2013; 54:2586-2594
  140. Group HTC, Landray MJ, Haynes R, Hopewell JC, Parish S, Aung T, Tomson J, Wallendszus K, Craig M, Jiang L, Collins R, Armitage J. Effects of extended-release niacin with laropiprant in high-risk patients. N Engl J Med2014; 371:203-212
  141. Cannon CP, Cariou B, Blom D, McKenney JM, Lorenzato C, Pordy R, Chaudhari U, Colhoun HM, Investigators OCI. Efficacy and safety of alirocumab in high cardiovascular risk patients with inadequately controlled hypercholesterolaemia on maximally tolerated doses of statins: the ODYSSEY COMBO II randomized controlled trial. Eur Heart J 2015; 36:1186-1194
  142. Tinahones FJ, Laufs U, Cariou B, Louie MJ, Yang J, Thompson D, Leiter LA. Alirocumab efficacy and safety by body mass index: A pooled analysis from 10 Phase 3 ODYSSEY trials. Diabetes Metab 2019:101120
  143. Ray KK, Wright RS, Kallend D, Koenig W, Leiter LA, Raal FJ, Bisch JA, Richardson T, Jaros M, Wijngaard PLJ, Kastelein JJP, Orion, Investigators O-. Two Phase 3 Trials of Inclisiran in Patients with Elevated LDL Cholesterol. N Engl J Med 2020; 382:1507-1519
  144. Wilson DP. Is Atherosclerosis a Pediatric Disease? In: Feingold KR, Anawalt B, Boyce A, Chrousos G, Dungan K, Grossman A, Hershman JM, Kaltsas G, Koch C, Kopp P, Korbonits M, McLachlan R, Morley JE, New M, Perreault L, Purnell J, Rebar R, Singer F, Trence DL, Vinik A, Wilson DP, eds. Endotext. South Dartmouth (MA)2020.
  145. Ference BA, Ray KK, Catapano AL, Ference TB, Burgess S, Neff DR, Oliver-Williams C, Wood AM, Butterworth AS, Di Angelantonio E, Danesh J, Kastelein JJP, Nicholls SJ. Mendelian Randomization Study of ACLY and Cardiovascular Disease. N Engl J Med 2019; 380:1033-1042
  146. Feingold KR. Maximizing the benefits of cholesterol-lowering drugs. Curr Opin Lipidol 2019; 30:388-394
  147. Cannon CP, Blazing MA, Giugliano RP, McCagg A, White JA, Theroux P, Darius H, Lewis BS, Ophuis TO, Jukema JW, De Ferrari GM, Ruzyllo W, De Lucca P, Im K, Bohula EA, Reist C, Wiviott SD, Tershakovec AM, Musliner TA, Braunwald E, Califf RM, Investigators I-I. Ezetimibe Added to Statin Therapy after Acute Coronary Syndromes. N Engl J Med 2015; 372:2387-2397
  148. Sabatine MS, Giugliano RP, Keech AC, Honarpour N, Wiviott SD, Murphy SA, Kuder JF, Wang H, Liu T, Wasserman SM, Sever PS, Pedersen TR, Committee FS, Investigators. Evolocumab and Clinical Outcomes in Patients with Cardiovascular Disease. N Engl J Med 2017; 376:1713-1722
  149. Ridker PM, Revkin J, Amarenco P, Brunell R, Curto M, Civeira F, Flather M, Glynn RJ, Gregoire J, Jukema JW, Karpov Y, Kastelein JJP, Koenig W, Lorenzatti A, Manga P, Masiukiewicz U, Miller M, Mosterd A, Murin J, Nicolau JC, Nissen S, Ponikowski P, Santos RD, Schwartz PF, Soran H, White H, Wright RS, Vrablik M, Yunis C, Shear CL, Tardif JC, Investigators SCO. Cardiovascular Efficacy and Safety of Bococizumab in High-Risk Patients. N Engl J Med 2017; 376:1527-1539
  150. Schwartz GG, Steg PG, Szarek M, Bhatt DL, Bittner VA, Diaz R, Edelberg JM, Goodman SG, Hanotin C, Harrington RA, Jukema JW, Lecorps G, Mahaffey KW, Moryusef A, Pordy R, Quintero K, Roe MT, Sasiela WJ, Tamby JF, Tricoci P, White HD, Zeiher AM, Committees OO, Investigators. Alirocumab and Cardiovascular Outcomes after Acute Coronary Syndrome. N Engl J Med 2018; 379:2097-2107
  151. Nissen SE, Lincoff AM, Brennan D, Ray KK, Mason D, Kastelein JJP, Thompson PD, Libby P, Cho L, Plutzky J, Bays HE, Moriarty PM, Menon V, Grobbee DE, Louie MJ, Chen CF, Li N, Bloedon L, Robinson P, Horner M, Sasiela WJ, McCluskey J, Davey D, Fajardo-Campos P, Petrovic P, Fedacko J, Zmuda W, Lukyanov Y, Nicholls SJ, Investigators CO. Bempedoic Acid and Cardiovascular Outcomes in Statin-Intolerant Patients. N Engl J Med2023; 388:1353-1364
  152. Jellinger PS, Handelsman Y, Rosenblit PD, Bloomgarden ZT, Fonseca VA, Garber AJ, Grunberger G, Guerin CK, Bell DSH, Mechanick JI, Pessah-Pollack R, Wyne K, Smith D, Brinton EA, Fazio S, Davidson M, Zangeneh F, Bush MA. AMERICAN ASSOCIATION OF CLINICAL ENDOCRINOLOGISTS AND AMERICAN COLLEGE OF ENDOCRINOLOGY GUIDELINES FOR MANAGEMENT OF DYSLIPIDEMIA AND PREVENTION OF CARDIOVASCULAR DISEASE - EXECUTIVE SUMMARYComplete Appendix to Guidelines available at http://journals.aace.com. Endocr Pract 2017; 23:479-497
  153. Sandesara PB, Virani SS, Fazio S, Shapiro MD. The Forgotten Lipids: Triglycerides, Remnant Cholesterol, and Atherosclerotic Cardiovascular Disease Risk. Endocr Rev 2019; 40:537-557
  154. Investigators A-H, Boden WE, Probstfield JL, Anderson T, Chaitman BR, Desvignes-Nickens P, Koprowicz K, McBride R, Teo K, Weintraub W. Niacin in patients with low HDL cholesterol levels receiving intensive statin therapy. N Engl J Med 2011; 365:2255-2267
  155. Group AS, Ginsberg HN, Elam MB, Lovato LC, Crouse JR, 3rd, Leiter LA, Linz P, Friedewald WT, Buse JB, Gerstein HC, Probstfield J, Grimm RH, Ismail-Beigi F, Bigger JT, Goff DC, Jr., Cushman WC, Simons-Morton DG, Byington RP. Effects of combination lipid therapy in type 2 diabetes mellitus. N Engl J Med 2010; 362:1563-1574
  156. Das Pradhan A, Glynn RJ, Fruchart JC, MacFadyen JG, Zaharris ES, Everett BM, Campbell SE, Oshima R, Amarenco P, Blom DJ, Brinton EA, Eckel RH, Elam MB, Felicio JS, Ginsberg HN, Goudev A, Ishibashi S, Joseph J, Kodama T, Koenig W, Leiter LA, Lorenzatti AJ, Mankovsky B, Marx N, Nordestgaard BG, Pall D, Ray KK, Santos RD, Soran H, Susekov A, Tendera M, Yokote K, Paynter NP, Buring JE, Libby P, Ridker PM, Investigators P. Triglyceride Lowering with Pemafibrate to Reduce Cardiovascular Risk. N Engl J Med 2022; 387:1923-1934
  157. Bhatt DL, Steg PG, Miller M, Brinton EA, Jacobson TA, Ketchum SB, Doyle RT, Jr., Juliano RA, Jiao L, Granowitz C, Tardif JC, Ballantyne CM, Investigators R-I. Cardiovascular Risk Reduction with Icosapent Ethyl for Hypertriglyceridemia. N Engl J Med 2019; 380:11-22
  158. Mason RP, Libby P, Bhatt DL. Emerging Mechanisms of Cardiovascular Protection for the Omega-3 Fatty Acid Eicosapentaenoic Acid. Arterioscler Thromb Vasc Biol 2020:ATVBAHA119313286
  159. Goff ZD, Nissen SE. N-3 polyunsaturated fatty acids for cardiovascular risk. Curr Opin Cardiol 2022; 37:356-363
  160. Mason RP, Sherratt SCR, Eckel RH. Omega-3-fatty acids: Do they prevent cardiovascular disease? Best Pract Res Clin Endocrinol Metab 2022:101681
  161. Chait A, Subramanian S. Hypertriglyceridemia: Pathophysiology, Role of Genetics, Consequences, and Treatment. In: Feingold KR, Anawalt B, Boyce A, Chrousos G, Dungan K, Grossman A, Hershman JM, Kaltsas G, Koch C, Kopp P, Korbonits M, McLachlan R, Morley JE, New M, Perreault L, Purnell J, Rebar R, Singer F, Trence DL, Vinik A, Wilson DP, eds. Endotext. South Dartmouth (MA)2019.
  162. Chait A, Eckel RH. The Chylomicronemia Syndrome Is Most Often Multifactorial: A Narrative Review of Causes and Treatment. Ann Intern Med 2019; 170:626-634
  163. Niisuke K, Horvath KV, Asztalos BF. Where next with HDL assays? Curr Opin Lipidol 2018; 29:293-298
  164. Hovingh GK, Rader DJ, Hegele RA. HDL re-examined. Curr Opin Lipidol 2015; 26:127-132
  165. Navab M, Reddy ST, Van Lenten BJ, Anantharamaiah GM, Fogelman AM. The role of dysfunctional HDL in atherosclerosis. J Lipid Res 2009; 50 Suppl:S145-149

Management of Hospitalized Children with Severe Hypertriglyceridemia

ABSTRACT


Severe hypertriglyceridemia (SHTG) is uncommon in children. Those with triglyceride (TG) levels greater than 1,000 mg/dL are likely to have a monogenic disorder affecting TG metabolism or a combination of polygenic and small-effect genetic variants that increase the risk of hypertriglyceridemia (HTG), in addition to other factors such as obesity and insulin resistance, poorly controlled diabetes, or medications that interfere with TG metabolism. When present, SHTG is associated with an increased risk of acute pancreatitis and, long-term, may contribute to ASCVD-related morbid and premature mortality. In 2011 the NHLBI Expert Panel published recommendations for clinical management of children with HTG in the ambulatory setting (1). Presently, however, there are no pediatric guidelines to assist clinical decision-making when aggressive therapy of SHTG in critically ill children who require hospitalization, with or without pancreatitis, might be indicated. In this article we focus on the inpatient management of SHTG. Other Endotext chapters address genetic and secondary causes of HTG and the outpatient management of these disorders (2-5).


INTRODUCTION


Severe HTG is uncommon in children but is most commonly encountered in youth who are obese and insulin resistant, those who have poorly controlled diabetes, or who require medications that interfere with TG metabolism (Table 1). Although rare, those with monogenic disorders have severe elevations of TG, typically >1000 mg/dL, while those with polygenic and small-effect genetic variants that contribute to alternations in lipid and lipoprotein metabolism are more common and in combination with secondary causes of HTG can lead to TG levels >1000 mg/dL (Table 2 and 3). Such severe elevations may cause significant morbidity, including pancreatitis, and occasionally may be life-threatening, necessitating aggressive TG lowering.


Table 1. Common Secondary Causes of Dyslipidemia

Condition

Screening Tests

Hypothyroidism                       

Liver Diseases                        

Kidney diseases                      

Diabetes Mellitus                   


Obesity / Insulin Resistance

Free T4, TSH

CMP

CMP/ UA

CMP/ UA/Fasting or Random Glucose / HgbA1c

CMP/ Fasting Glucose and Insulin

Medications

Steroids, retinoids, oral contraceptives, protease inhibitors

T4, thyroxine; TSH, thyroid-stimulating hormone; CMP, comprehensive metabolic profile; UA, urinalysis; HgbA1c, glycosylated hemoglobin.


Table 2. The Prevalence and Etiology of Extreme HTG (TG > 2,000 mg/dL) in Children

Dallas Children’s Hospital

Total

%

Study Population

30,623

100%

Extreme HTG

31

0.1%

Primary Genetic Causes


·       Type 1 Hyperlipoproteinemia, monogenic (Familial Chylomicronemia Syndrome or FCS)

5

14%

Secondary Causes


·       Uncontrolled Diabetes

11

30%

·       L-ASP and Steroids for Acute Lymphocytic Leukemia

10

28%

·       Sirolimus/Tacrolimus Therapy after solid organ transplantation

5

14%

Data from a tertiary children’s hospital (6).


Table 3. Triglyceride Levels in Children 12-19 Years of Age. NHANES data 1999 to 2008

TG Concentration

Normal

Mild-Mod

High

Missing

Data

Triglyceride Levels (mg/dL)

<150

150-499

> 500

Sample (n)

2872

316

3

57

Weighted to US population (n)

29,168,008

3,464,483

59,946

465,332

Weighted % for each category

88.0%

10.5%

0.2%

1.4%

NHANES, National Health and Nutrition Examination Survey (7)


PANCREATITIS


One of the main concerns in children with SHTG is the development of acute pancreatitis (AP).  When present AP is associated with significant morbidity and can be life-threatening. Although SHTG is a rare cause of AP in children, depending upon the etiology, it may be recurrent. TG-associated AP typically occurs in individuals with a pre-existing lipid abnormality, such as a monogenic disorders of TG metabolism (Familial Chylomicronemia Syndrome) or those with one or more secondary risk factors (e.g., poorly controlled diabetes, alcohol use, or use of a medication that can provoke SHTG) in combination with small-effect genetic variants leading to HTG (Multifactorial Chylomicronemia Syndrome). Compared to other causes, SHTG-related AP is associated with increased severity and mortality, higher frequencies of co-morbidities and systemic complications, longer length of hospitalization, and more frequent recurrence (8). In general, it is believed that a TG level of 1,000 mg/dl or more is needed to precipitate an episode of AP.


AP in children has been defined as having the presence of at least 2 of the following 3 criteria (9):

  1. Abdominal pain compatible with pancreatic origin;
  2. Amylase and/or lipase at least 3 times upper limits of normal; and
  3. Imaging suggestive of or compatible with pancreatic inflammation.


Not all children with AP have abnormal levels of serum amylase and/or lipase. Furthermore, interference with colorimetric reading assays may cause falsely normal results when TG levels are greater than 500 mg/dL. A reasonable estimate of the amylase/lipase levels may be obtained with serial dilutions of the serum. Compared to amylase, serum lipase appears to have higher specificity and sensitivity for AP. To assist in clinical-decision making, Abu-El-Haija published guidelines to help categorize the severity of children with AP (10). Categorization may be a helpful clinical tool in determining how aggressively to treat SHTG in this setting. We have modified this guideline to aid clinicians in determining the potential benefit of aggressive TG management of hospitalized children with SHTG who are critically ill, with or without pancreatitis. (Figure)


Figure. Algorithm to categorize and treat acutely ill hospitalized children, with or without acute pancreatitis, with SHTG (10).

aPresence of at least 2 of the following 3 criteria: 1) abdominal pain compatible with pancreatic origin; 2) amylase and/or lipase at least 3 X ULN; and 3) imaging suggestive of/compatible with pancreatic inflammation (9); bCriteria of organ dysfunction as per the International Pediatric Sepsis Consensus (modified from 11).

  1. Cardiovascular Dysfunction
    1. One or more of the following despite administration of isotopic IV fluid bolus > 40 mL/kg in 1 hr.
      1. Hypotension - Decrease in BP < 5th% for age or systolic BP < 2 SD below normal for age.
      2. Need for vasoactive drug to maintain BP in normal range (dopamine > 5 mcg/kg-1/mL-1 or dobutamine, epinephrine, or norepinephrine at any dose).
    2. Two of the following:
      1. Unexplained metabolic acidosis (BD > 5 mEq/L).
      2. Increased arterial lactate > 2 X ULN.
  • Oliguria: urine output < 0.5 mL/kg-1/hr-1.
  1. Core to peripheral temperature gap > 3° C.
  1. Respiratory Dysfunction
    1. One or more of the following in absence of pre-existing lung disease or cyanotic heart disease.
    2. PaO2/FIO2 < 300 in absence of cyanotic heart disease or pre-existing lung disease.
    3. PaCO2 > 65 torr or 20 mmHg over baseline PaCO2.
    4. Proven need or > 50% FIO2 to maintain saturation > 92%.
    5. Need for non-elective mechanical ventilation.
  • Renal Dysfunction
    1. Serum creatinine ≥ 2 X ULN for age; or
    2. 2-fold increase in baseline creatinine.

BD = base deficit; BP = blood pressure; SD = standard deviation; ULN = upper limit of normal.


The management of acute pancreatitis secondary to HTG is similar to the management of pancreatitis due to other causes (Table 4) except for the need to lower TG levels as quickly as possible. With cessation of food intake plasma TG usually decrease rapidly (approximately 50% decrease in 24 hours). Parenteral feeding with lipid emulsions should be avoided since they will delay the clearance of TG rich lipoproteins and exacerbate the HTG. In patients on ventilators the use of propofol should be avoided. Reduction of TG levels to well below 1,000 mg/dL generally prevents further episodes of pancreatitis.


Table 4. Guidelines for Treatment of Children with Acute Pancreatitis

(Modified from 12)


·       Adequate fluid resuscitation with crystalloid appears key, especially within the first 24 hours.

·       Analgesia may include opioid medications when opioid-sparing measures are inadequate.

·       Pulmonary, cardiovascular, and renal status should be closely monitored, particularly within the first 48 hours.

·       Enteral nutrition should be started as early as tolerated, whether through oral, gastric, or jejunal route. Lipid emulsions should not be used.

·       There is little evidence to support the use of prophylactic antibiotics, antioxidants, probiotics, or protease inhibitors.

·       Esophagogastroduodenoscopy, endoscopic retrograde cholangiopancreatography, and endoscopic ultrasonography have limited roles in diagnosis and management.

·       Children should be carefully followed for development of early or late complications and recurrent attacks.


TREATMENT OF SEVERE HYPERTRIGLYCERIDEMIA IN PATIENTS WITH PANCREATITIS  


Children with SHTG who are symptomatic, especially those with severe pancreatitis, may require rapid TG lowering. In situations where urgent reduction in TG levels is needed, a more aggressive approach than fasting and avoidance of fat may be indicated, including use of intravenous insulin, heparin, or both (13), and TG removal (e.g., plasmapheresis, apheresis) (Table 5). A single session of plasmapheresis has been shown to lower TG levels by up to 70% (14). While apheresis can rapidly lower TG, rigorous proof of efficacy is lacking. Studies comparing technical aspects of apheresis are also limited, such as different apheresis techniques (plasma exchange vs. double-membrane filtration) and proper fluid replacement (fresh frozen plasma vs. albumin). Apheresis is expensive, not widely available and vascular access challenging. Furthermore, a large retrospective study comparing two groups of adults with HTG before and after the availability of apheresis found no benefit (15). However, the authors suggested the timing of apheresis could be a critical factor, based on other reports showing that maximal reduction in morbidity and mortality can be achieved when apheresis is used as early as possible. Randomized trials have not compared the efficacy of insulin and heparin to standard therapy or apheresis for the treatment of pancreatitis secondary to HTG. In patients with poorly controlled diabetes (i.e., elevated plasma glucose levels) insulin should be administered to both lower glucose levels and increase lipoprotein lipase activity thereby accelerating the clearance of TG rich lipoproteins.   


Table 5. More Aggressive Management for HTG

Method

Route

Mechanism

aInsulin

·    Dose: 0.05-0.1/kg/hr by continuous IV infusion.

·    Administer concomitant IV dextrose to avoid hypoglycemia.

·    Consider use of the “2-bag” system to titrate insulin and dextrose delivery.

·    Insulin increases lipoprotein lipase (LPL) activity which can degrade chylomicrons and thus reduce serum TG.

·    Intravenous insulin may be more effective than subcutaneous insulin in severe cases of HTG.

bHeparin

·    Generally, not recommended as a monotherapy.

·        Stimulates release of endothelial LPL into circulation.

·    However, use of heparin may only result in transient rise in LPL followed by increased degradation of plasma stores causing LPL deficiency.

cDouble membrane filtration or plasma exchange

·    Adequate vascular access may be challenging.

·    Expensive procedure; not available in all medical centers.

·    The beneficial effect of plasmapheresis is believed to be due to a rapid decrease in TG levels. 

·    The effects of heparin, the removal of excessive proteases from the plasma, and replacement of consumed protease-inhibitors with new ones from donor plasma may play an additional beneficial role.

·    Use of donor plasma carries risks of transfusion-related allergic reaction or infection.

·    Requires transient anti-coagulation.

a(16), b(17), c(18).


Presently there are no pediatric guidelines to assist clinical decision-making when more aggressive therapy might be appropriate. In general, more aggressive TG-lowering should be considered in symptomatic children who fail to respond to conventional treatment (avoidance of fat intake) and in whom there is evidence of organ dysfunction or failure (Figure). In addition to the parameters listed in the Figure, given the effects of SHTG, alternated sensorium may also be considered as an indication for aggressive TG lowering. Although plasma exchange for treating TG-related AP was included in the 2007 Guidelines on the Use of Therapeutic Apheresis in Clinical Practice from the Apheresis, the strength of the evidence was assigned to category III (“suggestion of benefit or for which existing evidence is insufficient to establish or clarify the risk/benefit”) (19). Therefore, clinical judgement is needed in deciding when use of more aggressive HTG-lowering treatment.


FOLLOW-UP CARE


Following recovery from the acute episode of pancreatitis, the goal is to maintain a TG level of 500mg/dL or less. Management of HTG is discussed in detail in other Endotext chapters (2-5) and therefore will only be briefly discussed here. It is very important to recognize that the treatment of HTG is different in individuals with familiar chylomicronemia syndrome (FCS) vs. multifactorial chylomicronemia syndrome (MCS).


The primary treatment of individuals with FCS is dietary. Dietary fat calories need to be severely restricted to approximately 5-20% of calories. Such a fat restricted diet is very difficult for most patients to follow consistently. Medium-chain triglycerides (MCT), which are not incorporated into chylomicrons and are delivered to the liver via the portal vein, are a potential alternate source of fats for these patients. One should monitor for deficiency of fat-soluble vitamins (A, D, E, K) and recommend appropriate replacement as needed. Pregnancy in adolescents with FCS need to be carefully planned with close monitoring to avoid acute pancreatitis. Similar, to the treatment of MCS described below, drugs that increase TG levels should be discontinued if possible and medical conditions that tend to increase TG levels, optimally treated. Omega-3-fatty acids (fish oils) do not usually lower TG levels in patients with FCS. Fibrates are also not effective; however, a few studies have suggested that orlistat may be beneficial. Volanesorsen (Waylivra ®), an antisense oligonucleotide inhibitor of apolipoprotein C-III mRNA, is approved for treatment of FCS in Europe but not the United States. FCS patients treated with volanesorsen had a 77% decrease at 3 months in TG levels (mean decrease of 1,712 mg/dl) whereas those receiving placebo had an 18% increase in TG levels (20). Volanesorsen can lead to thrombocytopenia and, therefore, was not approved in the US but it is hoped that second generation inhibitors of apolipoprotein C-III will not demonstrate this side effect.


In patients with MCS, it is important to reverse the secondary factors that result in the marked HTG. For example, improving diabetic control, weight loss, eliminating ethanol intake, and discontinuing drugs that raise TG levels. In patients with markedly elevated TG levels (>1000mg/dL) initial management should include a very low-fat diet until the TG levels decrease. Once the TG decreases, a diet that reduces carbohydrate intake, particularly simple sugars, and minimizes alcohol intake should be encouraged. Weight loss can be helpful in lowering TG levels in those who are overweight or obese. If TG remain elevated after the above measures one can consider the use of drugs that lower TG levels such as omega-3-fatty acids and fibrates (Table 6). Many patients with MCS are at high risk for the future development of atherosclerotic cardiovascular disease. Therefore, once the high TG levels are lowered a repeat lipid panel is recommended to determine whether treatment strategies to reduce the risk of ASCVD are needed.


Table 6.  Medications for Primarily Lowering Triglycerides (21)

Medication

Pediatric Dosing

Adult Dosing

Side Effects

Indication / Comments

Fibric Acid Derivatives

Fenofibrate

(Many generic preparations available)

Pediatric safety and efficacy not established. Not FDA approved for use in children.


Product specific. Generally, employ full dose in the setting of normal renal function.

Skin rash, gastrointestinal (nausea, bloating, cramping), myalgia; lowers blood cyclosporine levels; potentially nephrotoxic in cyclosporine treated patients. Avoid in patients with CrCl < 30 mL/min.

Hypertriglyceridemia.

Monitor renal function; avoid in the presence of severe renal function.  Regular monitoring of liver function test is required.  Discontinue if persistent elevation of LFTs > 3 X ULN.

Gemfibrozil

(Lopid)

Pediatric safety and efficacy not established. Not FDA approved for use in children.


1200 mg p.o. daily, divided BID, 30 mins before breakfast and dinner

Potentiates warfarin action. Absorption of gemfibrozil diminished by bile acid sequestrants.

Hypertriglyceridemia.

Use with caution in patients with renal impairment, contraindicated with severe renal impairment; use contraindicated with hepatic impairment. Avoid with concurrent statin therapy.

Nicotinic Acid

Niacin

(Multiple preparations available)

Age ≥ 10

Pediatric safety and efficacy not established. Not FDA approved for use in children.  If used, suggested dose

Initial: 100-250 mg/d (Max: 10 mg/kg/day) divided three times daily with meals

Slowly titrate to max dose of intermediate release niacin (3 g/day) or slow-release niacin) 2 g/day)

Prostaglandin-mediated cutaneous flushing, headache, warm sensation, and pruritus; dry skin; nausea; vomiting; diarrhea; and myositis.

Adjunct therapy to reduce high TG. 

For Ped dosing may titrate weekly by 100 mg/day or every 2 – 3 weeks by 250 mg/day.  No dosing adjustment has been provided by the manufacturer for renal or hepatic impairment.  Contraindicated in the presence of significant unexplained hepatic dysfunction, active liver disease, or unexplained persistent LFT elevation.

Omega 3 Fatty Acids

Ethyl esters

(Lovaza)

Pediatric safety and efficacy not established. Not FDA approved for use in children.


2-4 g EPA + DHA daily, divided BID

Eructation, dyspepsia. Diarrhea (7%-15%) most commonly reported.  May enhance anticoagulant and antiplatelet effects of other medications.

Adjunct therapy to reduce high TG. 

No dosage adjustments required for impaired renal or hepatic function.  Periodic monitoring of ALT and AST is recommended for patients with hepatic impairment.


Icosapent

(Vascepa)

Pediatric safety and efficacy not established. Not FDA approved for use in children.

2-4 g EPA daily, divided BID

Arthralgia, oropharyngeal pain

Statins

Statins (Multiple preparations available)

Not FDA approved for use in children other than familial hypercholesterolemia.

Product specific. 

Headache; nausea; sleep disturbance; elevations in hepatocellular enzymes and alkaline phosphatase. Myositis and rhabdomyolysis, primarily when given with gemfibrozil or cyclosporine; myositis is also seen with severe renal insufficiency (CrCl < 30 mL/min).

If used off label in HTG, statins are most often used in combination with other drugs, such as fibrates, in order to achieve synergistic effects.


CONCLUSION


Aggressive therapy in symptomatic children with SHTG, when indicated, can rapidly lower levels of TG, potentially reducing morbidity and mortality in critically ill hospitalized children with and without acute pancreatitis. An algorithm to categorize severity of illness, the presence of pancreatitis and/or organ dysfunction, and local pancreatic or systemic complications or exacerbations of prior co-morbid disease can assist clinical decision-making in helping to determine appropriate candidates for aggressive TG-lowering therapy. 


ACKNOWLEDGEMENT


The authors would like to acknowledge Suzanne Beckett, Dena Hanson, and Ashley Brock for their assistance in preparing and editing this manuscript.


REFERENCES


  1. Expert Panel on Integrated Guidelines for Cardiovascular Health and Risk Reduction in Children and Adolescents, National Heart, Lung, and Blood Institute. Expert panel on integrated guidelines for cardiovascular health and risk reduction in children and adolescents: Summary report. Pediatrics. 2011;128(Suppl 5):213-256.
  2. Shah AS, Wilson DP. Genetic disorders causing hypertriglyceridemia in children and adolescents. 2023 Feb 22. In: Feingold KR, Anawalt B, Blackman MR, Boyce A, Chrousos G, Corpas E, de Herder WW, Dhatariya K, Dungan K, Hofland J, Kalra S, Kaltsas G, Kapoor N, Koch C, Kopp P, Korbonits M, Kovacs CS, Kuohung W, Laferrère B, Levy M, McGee EA, McLachlan R, New M, Purnell J, Sahay R, Shah AS, Singer F, Sperling MA, Stratakis CA, Trence DL, Wilson DP, editors. Endotext [Internet]. South Dartmouth (MA): MDText.com, Inc
  3. Benuck I, Wilson DP, McNeal C. Secondary hypertriglyceridemia. 2023 May 2. In: Feingold KR, Anawalt B, Blackman MR, Boyce A, Chrousos G, Corpas E, de Herder WW, Dhatariya K, Dungan K, Hofland J, Kalra S, Kaltsas G, Kapoor N, Koch C, Kopp P, Korbonits M, Kovacs CS, Kuohung W, Laferrère B, Levy M, McGee EA, McLachlan R, New M, Purnell J, Sahay R, Shah AS, Singer F, Sperling MA, Stratakis CA, Trence DL, Wilson DP, editors. Endotext [Internet]. South Dartmouth (MA): MDText.com, Inc
  4. Kavey RW. Combined dyslipidemia in children and adolescents. 2023 May 10. In: Feingold KR, Anawalt B, Blackman MR, Boyce A, Chrousos G, Corpas E, de Herder WW, Dhatariya K, Dungan K, Hofland J, Kalra S, Kaltsas G, Kapoor N, Koch C, Kopp P, Korbonits M, Kovacs CS, Kuohung W, Laferrère B, Levy M, McGee EA, McLachlan R, New M, Purnell J, Sahay R, Shah AS, Singer F, Sperling MA, Stratakis CA, Trence DL, Wilson DP, editors. Endotext [Internet]. South Dartmouth (MA): MDText.com, Inc
  5. Williams LA, Wilson DP. Nutritional management of pediatric dyslipidemia. 2023 Apr 30. In: Feingold KR, Anawalt B, Blackman MR, Boyce A, Chrousos G, Corpas E, de Herder WW, Dhatariya K, Dungan K, Hofland J, Kalra S, Kaltsas G, Kapoor N, Koch C, Kopp P, Korbonits M, Kovacs CS, Kuohung W, Laferrère B, Levy M, McGee EA, McLachlan R, New M, Purnell J, Sahay R, Shah AS, Singer F, Sperling MA, Stratakis CA, Trence DL, Wilson DP, editors. Endotext [Internet]. South Dartmouth (MA): MDText.com, Inc
  6. Patni N, Li X, Adams-Huet B, Garg A. The prevalence and etiology of extreme hypertriglyceridemia in children: Data from a tertiary children's hospital. J Clin Lipidol. 2018; 12(2):305-310.
  7. Perak AM, Ning H, Kit BK, de Ferranti SD, Van Horn LV, Wilkins JT, Lloyd-Jones DM. Trends in Levels of Lipids and Apolipoprotein B in US Youths Aged 6 to 19 Years, 1999-2016. JAMA. 2019;321(19):1895-1905.
  8. Zhang X, Li F, Zhen Y, Li A, Fang Y. Clinical study of 224 patients with hypertriglyceridemia pancreatitis. Chin Med J (Engl). 2015;128(15):2045-2049.
  9. Morinville VD, Lowe ME, Ahuja M, Barth B, Bellin MD, Davis H, Durie PR, Finley B, Fishman DS, Freedman SD, Gariepy CE, Giefer MJ, Gonska T, Heyman MB, Himes R, Husain S, Kumar S, Ooi CY, Pohl JF, Schwarzenberg SJ, Troendle D, Werlin SL, Wilschanski M, Yen E, Uc A. Design and implementation of INSPPIRE. J Pediatr Gastroenterol Nutr. 2014;59(3):360-364.
  10. Abu-El-Haija M, Kumar S, Szabo F, Werlin S, Conwell D, Banks P, Morinville VD, NASPGHAN Pancreas Committee. Classification of acute pancreatitis in the pediatric population: Clinical report from the NASPGHAN pancreas committee. J Pediatr Gastroenterol Nutr. 2017;64(6):984-990.
  11. Goldstein B, Giroir B, Randolph A, International Consensus Conference on Pediatric Sepsis. International pediatric sepsis consensus conference: Definitions for sepsis and organ dysfunction in pediatrics. Pediatr Crit Care Med. 2005;6(1):2-8.
  12. Abu-El-Haija M, Kumar S, Quiros JA, Balakrishnan K, Barth B, Bitton S, Eisses JF, Foglio EJ, Fox V, Francis D, Freeman AJ, Gonska T, Grover AS, Husain SZ, Kumar R, Lapsia S, Lin T, Liu QY, Maqbool A, Sellers ZM, Szabo F, Uc A, Werlin SL, Morinville VD. Management of acute pancreatitis in the pediatric population: A clinical report from the North American Society for Pediatric Gastroenterology, Hepatology and Nutrition Pancreas Committee. J Pediatr Gastroenterol Nutr. 2018;66(1):159-176.
  13. Alagözlü H, Cindoruk M, Karakan T, Unal S. Heparin and insulin in the treatment of hypertriglyceridemia-induced severe acute pancreatitis. Dig Dis Sci. 2006;51(5):931-933.
  14. Yeh J, Lee M, Chiu H. Plasmapheresis for severe lipemia: Comparison of serum-lipid clearance rates for the plasma-exchange and double-filtration variants. J Clin Apher. 2003;18(1):32-36.
  15. Chen J, Yeh J, Lai H, Liao C. Therapeutic plasma exchange in patients with hyperlipidemic pancreatitis. World J Gastroenterol. 2004;10(15):2272-2274.
  16. Tsuang W, Navaneethan U, Ruiz L, Palascak JB, Gelrud A. Hypertriglyceridemic pancreatitis: Presentation and management. Am J Gastroenterol. 2009;104(4):984-991.
  17. Ewald N, Kloer H. Treatment options for severe hypertriglyceridemia (SHTG): The role of apheresis. Clin Res Cardiol. 2012;7(Suppl 1):31-35.
  18. Lennertz A, Parhofer KG, Samtleben W, Bosch T. Therapeutic plasma exchange in patients with chylomicronemia syndrome complicated by acute pancreatitis. Ther Apher. 1999;3(3):227-233.
  19. Shaz BH, Linenberger ML, Bandarenko N, Winters JL, Kim HC, Marques MB, Sarode R, Schwartz J, Weinstein R, Wirk A, Szczepiorkowski ZM. Category IV indications for therapeutic apheresis: ASFA fourth special issue. J Clin Apher. 2007;22(3):176-180.
  20. Calcaterra I, Lupoli R, Di Minno A, Di Minno MND. Volanesorsen to treat hypertriglyceridemia: A pooled analysis- of randomized controlled trials. Eur J Clin Invest. 2022 Nov; 52(11):e13841.
  21. Wilson DP, McNeal C, Blackett PR. Children and adolescents: Step-by-step evaluation and management plan. In: Myerson M, ed. Dyslipidemia: A clinical approach. Philadelphia: Lippincott Williams & Wilkins; 2018:245-265.

Metabolic Bone Disease in The Tropics

ABSTRACT


Metabolic bone disease (MBD) encompasses a heterogeneous group of disorders having a diverse spectrum of manifestations varying from asymptomatic to florid. MBD is prevalent globally, but certain unique features characterize those occurring in the tropics. Dietary deviations, including malnutrition, environmental influences, genetic factors, and limited access to healthcare, modify the tropical presentation of MBD. Osteoporosis remains the most prevalent MBD in the tropics. Anti-osteoporotic agents are widely available, but the compliance and follow-up are poor. Fracture liaison services are gaining importance to address the low rates of patient work-up and treatment following a fracture. Though the tropics have long been plagued with communicable diseases, there is a recent increase in noncommunicable lifestyle diseases and obesity, which are major risk factors for sarcopenia. A significant subset of adults over the age of 65 years have sarcopenia complicated by obesity and are at risk of synergistic complications from both obesity and sarcopenia. "Thin-fat obesity" or "sarcopenic obesity," also known as normal weight obesity, is a recognized phenotype in South Asia, with a comparable risk for cardiometabolic disease as obesity. In addition to osteosarcopenia, other MBDs, such as rickets and osteomalacia, still prevail in tropical countries. Symptomatic hyperparathyroidism is still seen in tropical countries, unlike the West, where asymptomatic hyperparathyroidism is more common. Skeletal fluorosis, an MBD caused by chronically ingesting excess fluoride, can be asymptomatic, but a broad range of manifestations can occur, such as diffuse skeletal pain, limited mobility, osteopenia, and ossification of ligaments and interosseous membranes. The oral cavity can be a window to other MBDs like dental fluorosis in the tropics. Several infective disorders that can affect bones and joints, such as tuberculosis, leprosy, treponemal and fungal infections are prevalent in the tropics and should be considered in the differential diagnosis of tropical MBD.


INTRODUCTION


Metabolic bone disease (MBD) encompasses a diverse variety of bone and mineral metabolism disorders that often pose diagnostic and therapeutic challenges. The manifestations might differ in the tropics because of nutritional, environmental, and genetic factors. The presentation is often late and severe because of limited access to healthcare facilities and a lack of routine screening practices. Osteoporosis, the most prevalent MBD globally, is also widespread in the tropics. Despite ample sunlight exposure, vitamin D deficiency continues to be common. Certain conditions, such as fluorosis, lead, and cadmium toxicity, and infective skeletal disorders e.g., tuberculosis, syphilis, and leprosy, are unique to these regions. The altered presentation of the globally prevalent MBDs and conditions specific to the tropics have been highlighted here.


OSTEOPOROSIS IN THE TROPICS


Osteoporosis is the most common MBD globally and in tropical countries. Different studies in the South Asian region have suggested the prevalence of osteoporosis to be 30 to 50% among postmenopausal women and up to 20% in men above 50 years (1, 2). With increasing life expectancy in tropical countries, this prevalence will likely increase in the coming years. Several factors contribute to the high frequency and unique features of osteoporosis in tropical countries. These are summarized in table 1.


Table 1. Unique Features of Osteoporosis in the Tropical Region (3)

1.

Lower peak bone mass

2.

Poor dietary intake of calcium

3.

A large proportion of individuals with vitamin D deficiency

4.

Paucity of dual-energy X-ray absorptiometry scanners leading to delayed diagnosis

5.

Relatively earlier age of menopause

6.

Limited food fortification for calcium and vitamin D

7.

Lower bone mineral density threshold for developing a fragility fracture

8.

Less awareness and knowledge about osteoporosis


Despite the high mortality from hip fractures and the immense costs associated with its management, awareness about osteoporosis and its screening is poor among patients and physicians. In a study from southern India, 60% of postmenopausal women (n =302, mean age of 58 years) lacked knowledge of osteoporosis. In another study among general practitioners (n = 220), the total mean score on awareness was only 22% (1, 4).


Given the limitation of the diagnostic facilities, simple, cost-effective screening tools have been validated for use in the tropics. These may range from simple clinical findings like dental health assessment to more comprehensive evaluation through the FRAX tool. Easy-to-follow clinical practice guidelines have been developed that help manage patients with osteoporosis despite the above-mentioned constraints (5, 6).


Given poor dietary calcium intake and low levels of 25-hydroxyvitamin D [25(OH)D] despite abundant sunlight, adequate calcium and vitamin D is an essential component of osteoporosis management in these patients. Anti-osteoporotic agents are widely available, but compliance and follow-up are poor. The usage of bone turnover markers is still emerging and may evolve as a cost-effective tool. Moreover, strategies such as the fracture liaison service (FLS) will be helpful to enhance care for secondary prevention of fragility fractures (7).


DISORDERS OF BONE MINERAL METABOLISM IN THE TROPICS


Rickets And Osteomalacia


Rickets and osteomalacia are also prevalent in tropical countries. In children, the prevalence of nutritional calcipenic rickets has decreased significantly but remains the usual cause of a rachitic presentation. It’s a bit paradoxical for tropical countries with abundant sunlight to have a high occurrence of vitamin D deficiency. Though rare, the genetic causes of calcipenic and phosphopenic rickets may be more frequent in specific pockets where consanguinity is practiced.


Like children, dietary deficiency is the usual etiology of osteomalacia in adults. However, certain acquired causes are common and must be ruled out. These include renal tubular dysfunction caused by heavy metal exposure, often from native medications. Moreover, Fanconi syndrome can result from certain drugs used to treat infectious disorders. For example, tenofovir used to treat hepatitis B can lead to proximal renal tubular acidosis. The rampant use of glucocorticoids in different over-the-counter products enhances the risk of glucocorticoid-induced osteomalacia. Furthermore, a gradual increase in chronic kidney disease (CKD) in tropical countries, is leading to a higher incidence of renal osteodystrophy (8).


Vitamin D deficiency in the tropics is widespread and ranges from 40 to 80%. Several postulates have been proposed to explain the lower vitamin D levels despite adequate sunlight. These include increased melanin in the skin, predominant indoor habits, and lack of vitamin D fortification. The relatively higher amount of fat for a given body mass index affects the redistribution of vitamin D. Lastly, air pollution in certain metropolitan cities reduces exposure to sunlight. Other causes of osteomalacia in tropical countries include renal tubular dysfunction and acquired hypophosphatemic disorders, covered in the “Diseases of Bone and Mineral Metabolism” section in Endotext.


Hyperparathyroidism


Parathyroid disorders could be classified as primary – wherein the parathyroid gland is diseased and secretes excessive parathyroid hormone (PTH), or secondary – where excess PTH secretion occurs as a compensatory response to systemic conditions such as vitamin D deficiency, chronic kidney disease, etc. The third variety, tertiary hyperparathyroidism, is characterized by the autonomous transformation of the parathyroid gland during prolonged secondary PTH hypersecretion (9).


Hyperparathyroidism differs in clinical presentation in tropical countries and often manifests as florid disease. Parathyroid disorders are usually slowly evolving, and overt skeletal defects are declining as more facilities start to screen for calcium in the tropics routinely. Thus, the prevalence of asymptomatic disease is gradually increasing (10). The salient differences in tropical countries are summarized in table 2.


Table 2. Difference in Parathyroid Disorders in Tropical Countries

1.

Symptomatic hyperparathyroidism is still seen in tropical countries, unlike the West, where asymptomatic hyperparathyroidism is more common

2.

Higher calcium and parathyroid hormone levels are found in tropics

3.

Higher prevalence of vitamin D deficiency in the tropics

4.

Intraoperatively a larger tumor/gland size in the tropics is usually observed

5.

Brown tumors and severe bone diseases seen in the tropics are rare in the West


Scurvy


Nutritional deficiencies are rare in the developed world but are observed in tropical countries. Vitamin C deficiency is a rare cause of MBD but should be considered while evaluating patients with suggestive symptoms and radiological features. It may affect the bone and joints, but initial diagnosis is often missed due to nonspecific symptoms and signs. Initial manifestations include irritability, decreased appetite, and delayed development followed by a pseudo-paralysis-like state wherein the patient lies still with little movement because of generalized pain, most apparent in bones due to subperiosteal hemorrhages. Swelling may be noted along the shaft of long bones.


Radiological changes in the long bones, particularly around the knee, are peculiar to scurvy. The bones are often fragile, with bone mineral density (BMD) in the osteopenic range. Fracture healing is often associated with large callus formation. Moreover, the epiphyses and periosteum are easily detachable due to the sub-periosteal bleeding. A classical feature on radiography known as the Wimberger ring is a circular, opaque radiologic shadow surrounded by a white line, seen in the growth centers around the epiphysis, as shown in Figure 1. The cortical bone in vitamin C deficiency is characterized by thinning, often described as a “pencil-point” cortex.


Figure 1. Illustration of the radiological features of scurvy.


The physis exhibits the Frankel line, characterized by thickening and sclerosis accompanied by a subjacent zone of lucency. The physeal thickening is known as a Frankel line, and the adjacent lucent zone on its diaphyseal side is the Trümmerfeld zone or the scurvy line. Metaphyseal “beaks” and transverse lines of increased or decreased opacity may be seen in scurvy. The “beaks,” known as Pelkan spurs, are associated with healing fractures of the Trümmerfeld zone at the periphery of the site of calcification. Costochondral junctions of the first six or eight thoracic ribs may be expanded; this change may be related to fracturing of the zone of provisional calcification during normal respiration. The costochondral junctions are rounded and appear smooth, knobby, and steplike. The enlargement of the costochondral junctions simulates findings seen in rickets but is often painful.


The diagnosis of scurvy is based on a combination of clinical and radiographic findings. A dietary history suggestive of poor vitamin C intake for at least one to three months is required for the appearance of clinical symptoms. Unlike other MBDs, accurate laboratory measurement of vitamin C levels is unreliable as it does not reflect the tissue levels. Healing occurs rapidly with the oral administration of 100 to 200 mg/d of vitamin C (11).


Paget’s Disease Of The Bone


Paget’s disease of the bone is a rare disorder in the tropics compared to the temperate regions but has been reported in certain pockets, especially in southern India. The overall global prevalence seems to be declining. Several viruses, such as paramyxoviridae, respiratory syncytial virus, canine distemper virus, and measles virus, have been linked to its etiopathogenesis. Given the high prevalence of many of these viruses in the tropics, the tropical connection of Paget’s disease has received renewed attention.


An underlying genetic etiology also predisposes to a higher occurrence in consanguineous populations. Due to the nonspecific symptoms, poor awareness among treating physicians, and limited availability of bone scans, the diagnosis is often missed. Thus, its true prevalence is unlikely to be determined. In a study from southern India, the mean age was 60 years in a cohort of 48 patients. It was reported predominantly in men (65%), and about one-fifth of them were asymptomatic. Among the symptomatic patients, 87% have polyostotic involvement. Sixty-nine percent of them were treated with zoledronic acid, and all achieved remission immediately after therapy (12).


Renal Tubular Disorders (Acquired & Genetic)


Different varieties of genetic and acquired renal tubular acidosis (RTA) are known to occur in the tropics. Specifically, the SLC4A1 (solute carrier family 4 A1) gene mutation-induced dysfunction of the erythroid and kidney isoforms of anion exchanger 1 (AE1 or band 3) causes distal RTA in some areas of the tropics. The mutation is prevalent in Thailand, Malaysia, the Philippines, and Papua New Guinea. The inheritance is autosomal recessive and can result from either homozygous or compound heterozygous SLC4A1 mutations (13). Wilson’s disease, sickle cell anemia, and medullary sponge kidney are the other genetic causes of RTA more frequently encountered in regions where consanguinity is common.


Among the acquired causes, several drugs have been implicated in the pathogenesis of RTA. Some of these are used in managing common infective disorders in tropical countries, for example, tenofovir, for treating hepatitis B. One study reported lower bone mass (12.3%) in patients with hepatitis B on tenofovir compared to those not on the drug or those without hepatitis B (8). Among other acquired causes of RTA, amphotericin B, analgesic abuse, recurrent urinary tract infection, and hyperparathyroidism have been commonly reported in some tropical countries.


INFECTIVE DISORDERS ASSOCIATED WITH METABOLIC BONE DISEASE


Several infective disorders affect bones and joints, causing debilitating disease. Given the high incidence of infectious conditions in the tropical countries, the concurrence of bone lesions is expected. 


Tuberculosis


Tuberculosis is an unusual cause of bony lesions, but immunocompromised states such as human immunodeficiency virus (HIV) infection and diabetes increase the risk. Spine involvement can present insidiously, with progressive back pain in endemic areas, especially when consecutive thoracic vertebrae are affected with relative disc preservation. Paravertebral and epidural soft tissue lesions may present as a cold abscess. Atypical tubercular osteoarticular manifestations involving the extraspinal skeleton, a prosthetic joint, or the trochanteric area, and nontuberculous mycobacterial infections should raise suspicion for immunocompromised states. Surgery combined with prolonged antitubercular therapy is indicated for neurological manifestations or deformities and provides satisfactory results in most cases. Because of the increasing resistance to antitubercular treatment, appropriate culture and sensitivity testing should be ordered whenever indicated (14).


Leprosy


Mycobacterium leprae primarily affects the skin and nerves. Effective antimicrobial therapy has improved outcome in the acute stage of infection. However, long-term sequelae such as foot drop are not unusual if the diagnosis is delayed. Ineffective penetration of antimycobacterial therapy into neural tissue can predispose to continued nerve damage and result in Charcot’s neuroarthropathy. Other chronic effects include male osteoporosis and hypogonadism. Testicular atrophy following invasion by Mycobacterium leprae have caused osteoporosis in a few cases (15).


Treponemal Diseases


The spirochete Treponema pallidum causes syphilis. Earlier published series have described three broad types of skeletal malformations. They include - group I: metaphyseal dystrophy, group II: osteitis-like dystrophy, and group III: periosteal dystrophy. Advances in case detection, treatment, and prevention have significantly lowered the incidence of the disease and its associated complications (16). Contrary to the earlier view that the malformations are inflammatory, newer evidence suggests that dystrophic changes are responsible. In a series of 55 cases, the most frequent osseous findings were metaphysitis, zone of rarefaction, periostitis, disorganized metaphysis, bone erosion, and Wimberger sign. The bones commonly affected were the long bones such as radius, ulna, tibia, femur, humerus, and fibula (17).


Fungal Infection


Osteoarticular mycoses are uncommon in clinical practice and Aspergillus and Candida are the organisms involved usually. Dimorphic fungi such as Histoplasma, Blastomyces, Coccidiosis, and Paracoccidiodes can affect the bones in endemic areas. They occur predominantly in immunocompetent hosts and are characterized by hematogenous dissemination. The natural history is typically indolent but occasionally the organisms behave virulently.


While mucormycosis is highly aggressive and destructive in the lung, sinuses, and brain, it is relatively indolent in the bone. Mucormycosis can affect any bones and joints without specific predilection for any particular site. Most cases occur from direct inoculation of the bone rather than through systemic seeding. Osteoarticular mucormycosis can sometimes necessitate bony amputation to prevent the nidus from spreading through the systemic circulation. A high index of suspicion, early diagnosis, and intensive treatment are the key to successful management (18).


Skeletal Fluorosis


Skeletal fluorosis is caused by chronically ingesting excess fluoride, usually from natural sources. Skeletal fluorosis can be asymptomatic, but a broad range of manifestations, including diffuse skeletal pain, limited mobility, osteopenia, and ossification of ligaments and interosseous membranes, are known to occur. The severity of the disease depends on the amount and duration of fluoride exposure. The portal of entry is oral, and after absorption from the gastrointestinal tract, it is deposited in the skeleton, where it has a half-life of more than seven years. Incorporation of the fluoride in the hydroxyapatite crystal affects bone strength, and influences bone remodeling through the Runt-related transcription factor 2 (Runx2) and receptor activator of nuclear factor kappa-В ligand (RANKL). This alters the expression of osteocalcin and osteoprotegerin with resultant increased osteoblastic activity (19).


The usual clinical features are dental mottling, bony pains, chronic fatigue, joint stiffness with restricted range of motion, flexion contractures, radiculo-myelopathy, and increased fracture risk. The diagnosis is based on a high index of clinical suspicion and confirmed by a 24-hour estimation of the urinary fluoride level. There is no effective treatment for established skeletal fluorosis. Management consists of symptomatic therapy with analgesics and provision of adequate calcium and vitamin D. Decompressive laminectomy may be performed to relieve neurological deficits due to spine involvement. Identifying the source of high fluoride intake, defluoridation, or changing the water source helps prevent worsening.


Lead Toxicity And Its Effect On Bone


Lead toxicity remains a substantial public health problem globally and in tropical countries. Bone is a major reservoir of lead in both adults and children, accounting for 75-90% of the total body lead. The accumulated lead can gradually be released to other soft tissues and pathological sites. Bone lead accrual occurs after both environmental and occupational exposure. It is a marker of past lead exposure with a half-life of 20 years and thus increases gradually with age. (20)


Lead exerts a detrimental effect by reducing osteocalcin production and inhibiting alkaline phosphatase activity in osteoblasts. Lead suppresses type II and type X collagen expression in chondrocytes and alters growth factors and second messenger signaling responses during chondrocyte maturation. Lead stimulates the osteoclasts to enhance bone resorption. Strict vigilance and robust policy decisions to decrease lead exposure will improve skeletal health in the tropics.


Cadmium Toxicity And Metabolic Bone Disease


Exposure to cadmium is associated with kidney, bone, and cardiovascular disorders. Like lead, cadmium is stored in the renal tissue for many years (half-life 10–30 years), which could result in renal tubular dysfunction, glomerular damage, and renal failure. A population-based study among postmenopausal women showed a clear link between a high burden of cadmium and low BMD (21). There are two proposed mechanisms for bone loss; a direct action on bone cells and an indirect action on the kidney resulting in phosphate and calcium excretion. In vitro studies have demonstrated that cadmium can increase the RANKL expression, tartarate-resistant acid phosphatase (TRAP) activity, and formation of TRAP-positive cells in the presence of RANKL, resulting in increased osteoclastic activity.


In tropical countries, silversmiths have exposure to cadmium in the absence of personal protective equipment. Case reports of exposure to cadmium and consequent renal osteodystrophy have been reported (22).


Alcohol And Metabolic Bone Disease


Alcohol consumption can, directly and indirectly, affect bone health. The mechanisms are summarized in Figure 2. In a study by Peris et al., vertebral fractures were observed in 36% of those consuming alcohol chronically, but only 6.5% had BMD below the fracture threshold. Thus chronic alcohol consumption may lead to a higher propensity for vertebral fractures without impacting the BMD (23). The evaluation and treatment would depend upon the clinical profile.


Figure 2. Impact of chronic alcohol consumption on metabolic bone disease.


NEPHROLITHIASIS IN TROPICS


Renal stone disease is a common problem worldwide. The prevalence and composition of renal stones differ according to country, climate, and culture (24). Conforming to that trend, renal stone diseases in tropical countries exhibit some unique features. The usual constituents of stones include calcium oxalate, calcium phosphate, uric acid, cysteine, struvite, or a mixture of these. In many tropical countries, local factors influence the composition of the stone. Nephrolithiasis, in general, has been reviewed elsewhere in endotext.org (25).


The prevalence of renal stone disease in older reports ranged from 7 to 13% in North America, 5–9% in Europe, and 1–5% in Asia (26). The lower frequency in Asia could be partially from underreporting. Recent findings demonstrate that the incidence of renal stones has increased by 48.5% in the last three decades across the globe (26, 27). The age-standardized incidence rate (ASIR) was greater in countries with high, middle, and low-middle sociodemographic index (SDI) than in low SDI regions. Some African countries, such as Madagascar, South Sudan, and Burundi, had a lower incidence of renal stones (27). An increased oxalate-degrading bacteria count in the gut of black South Africans could be a possible explanation (28).


The tropical region of Asia, spanning West Asia, South Asia, and Southeast Asia, constitutes a stone-forming belt with high prevalence (5% to 19.1%) (29). Higher temperatures and sunlight exposure increase the risk in these regions (30). Similar trends are also described in Latin America (31). Globally, the peak incidence of nephrolithiasis occurs between 50 to 70 years, though in Asians, the maximum incidence is around 30 years. Males are affected more often globally and in Asia (27, 29).


Unique Aspects In Tropics


TROPICAL CLIMATE AND STONE FORMATION


Higher ambient temperature and low humidity in the tropics increase fluid loss through sweating. Urinary concentration increases as compensation, and relatively insoluble salts such as calcium oxalate and urates tend to precipitate and serve as foci of stone formation. Sweating-induced reduction in urinary pH favors the crystallization of uric acid and further enhances the risk of urate stone (32). Renal colic is thus more common during warmer months (33). Additionally, studies suggest that males are more susceptible to developing kidney stones due to increased temperature. However, whether this is related to the total cumulative heat exposure or differential pathophysiological response is unclear (34, 35).


METABOLIC SYNDROME AND NEPHROLITHIASIS


The prevalence of metabolic syndrome in topical countries is on the rise (36-38). The upsurge in the frequency of nephrolithiasis could be attributed somewhat to the increasing burden of metabolic disorders. A consistent association between the prevalence of metabolic syndrome and renal stones has been demonstrated (39). Obesity, diabetes, hypertension, and insulin resistance, all components of metabolic syndrome, are risk factors for stone formation (40). Hyperuricemia, another manifestation of insulin resistance, is a recognized pathophysiologic link. Insulin resistance decreases urinary ammonium production leading to the formation of acidic urine, augmenting the potential for lithogenesis (41, 42). However, the predominant stone type in metabolic syndrome is oxalate. Hyperoxaluria in metabolic syndrome is multifactorial in etiology and could be related to changes in gut flora, increased renal oxidative stress, and alteration in the balance between promoters and inhibitors of lithogenesis (43, 44).


CHILDHOOD ENDEMIC BLADDER STONES


The incidence of vesical calculus has declined significantly over the last few decades in developed nations but is still prevalent in the tropics. Reliance on carbohydrate-rich food and lack of protein early in life results in a relative deficiency of phosphates and leads to the formation of insoluble urinary salts. The boys are predisposed as their long tortuous urethra is a hindrance to clearing the debris (45, 46).


OTHER VARIETIES OF RENAL STONE SPECIFIC TO TROPICS       


In a study from Taiwan, environmental melamine exposure was found to be associated with nephrolithiasis (47). Betel nut chewing is also linked to stone formation. The pathogenesis could be mediated by arecoline, an alkaloid in betel nut (48).


DENTAL DISORDERS IN THE TROPICS


Tropical oral disorders include a wide range of conditions that may be manifestations of systemic diseases. Osteoporosis continues to be one of the most underdiagnosed and under-reported conditions in the tropics. Though the diagnosis of osteoporosis is based on DXA, it has been suggested that signs in the oral cavity and dental X-rays can be used for primary screening in resource-limited settings. Several radiographic indices, such as mandibular cortical index, mandibular cortical width, antegonial Index, gonial index, panoramic mandibular index, and alveolar crest resorption degree (M/M ratio), have been explored as screening tools for osteoporosis (49).


The oral cavity can be a window to many other MBDs in the tropics. Vitamin D is crucial for the mineralization of bones and teeth. Low vitamin D levels lead to malformed, hypomineralized teeth that are brittle and vulnerable to decay, also known as “rachitic teeth (50). Dental abscesses are characteristic of vitamin D-resistant rickets (VDRR). Other characteristic manifestations of VDRR include dentin defects, unusually large pulp chambers, enlarged pulp horns, and enamel hypoplasia (51). Brown tumor, loss of bone density, soft tissue calcification, and dental abnormalities, such as developmental defects and changes in tooth eruption, are common oral symptoms in hyperparathyroidism. Malocclusion due to the drifting of teeth and spacing of the teeth may be the first signs of hyperparathyroidism (52).


Tropical infective diseases such as tuberculosis can atypically present with oral manifestations. Lesions in the jaw in the form of osteomyelitis or simple bone radiolucency, as well as superficial ulcers, patches, and indurated soft tissue lesions, are described (53). Dental fluorosis is caused by excessive fluoride ingestion during tooth development. Dental fluorosis is common in the tropics and is described in the previous section (54, 55). Clinically, mild cases of dental fluorosis manifest as an opaque white appearance of the enamel from increased subsurface porosity. Moderate dental fluorosis manifests as yellow to light brown staining in the areas of enamel damage. Severe dental fluorosis results in a porous enamel that is poorly mineralized and stains brown (56). Preventive strategies involve control of fluoride levels in drinking water (57).


SARCOPENIA AND BONE – A TROPICAL PERSPECTIVE


Sarcopenia, defined as the loss of muscle mass and strength, is an emerging global health problem. In a recent meta-analysis on the worldwide prevalence of sarcopenia, using different classifications and cut-off points, the prevalence of sarcopenia varied between 10 to 27% (58). Multi-center research from nine nations (Finland, Poland, Spain, China, Ghana, India, Mexico, Russia, and South Africa) across three continents revealed an overall frequency of 15.2% (59).


Types Of Sarcopenia


When no other etiology other than aging is apparent, the condition is called "primary" (or age-related) sarcopenia.  The term "secondary" sarcopenia refers to sarcopenia from one more additional cause (60). Many tropical countries are seeing a rapid increase in the aging population owing to improved healthcare facilities (61, 62). Hence, primary sarcopenia can potentially become a serious health concern globally, particularly in the developing world. Secondary sarcopenia could be activity related (resulting from bed rest, a sedentary lifestyle), disease-related (associated with endocrine diseases, advanced organ failure, malignancy, inflammatory disease), or nutrition-related (inadequate dietary intake of energy/protein, malabsorption, use of medications that cause anorexia, etc.) (60).


Risk Factors For Sarcopenia In The Tropics


Though the tropics have been plagued with communicable diseases for a long time, there is a recent increase in noncommunicable lifestyle diseases and obesity, major risk factors for sarcopenia (63, 64). A significant subset of adults over 65 years have sarcopenia complicated by obesity and are at risk of synergistic complications from obesity and sarcopenia (65). "Thin-fat obesity" or "sarcopenic obesity," also known as normal-weight obesity, is a recognized phenotype in South Asia with a comparable risk for cardiometabolic disease to conventional obesity. It is described as a condition in which a person has a normal body mass index (BMI) but a higher body fat percentage (based on ethnicity and gender-specific cut-offs) (66).


Muscle mass and strength are lower in South Asians than in Caucasians (67). The South Asian Working Action Group on Sarcopenia (SWAG-SARCO) consensus has been developed for diagnosing sarcopenia in South Asian nations while considering these ethnic characteristics (64). Malnutrition is still a significant public health issue in underdeveloped nations, notwithstanding the rise in obesity (68-70). In addition to the traditional risk factors, HIV-associated sarcopenia is prevalent in Africa. In a study from Brazil, HIV-infected patients had a 4.95 higher risk for sarcopenia than the controls, which persisted even following adjustments for age and BMI (71).


Osteosarcopenia


Numerous studies support the concept of a bone-muscle unit, in which molecules released by the skeletal muscle secretome influence bone, and the osteokines secreted by osteoblasts and osteocytes modulate the muscle cells (72). Duque et al. originally used the term "osteosarcopenia" to refer to an older population subgroup having both sarcopenia and osteoporosis. Clinically, unfavorable outcomes such as falls, fractures, loss of function, and frailty arise when both illnesses coexist. Resistance training, adequate protein and calcium consumption, and maintenance of optimum levels of vitamin D are simple therapies that have a dual favorable effect on bone and muscle and decrease falls, fractures, and disability (73).


CHALLENGES IN THE DIAGNOSIS AND MANAGEMENT OF MBD IN THE TROPICS


Prevalence Of Vitamin D Deficiency


Since skin exposure to ultraviolet radiation is the major source of vitamin D, it has long been believed that residing in tropical countries ensures adequate vitamin D levels. However, there is overwhelming evidence for widespread vitamin D deficiency in the tropics. Several other factors which could affect vitamin D levels, such as adiposity, skin pigmentation, genetic factors, clothing habits, sun avoidance, regular use of sunscreen, cloud cover and pollution, have been implicated (74).


Most studies have defined vitamin D insufficiency as serum 25(OH)D less than 50 nmol/L (20 ng/mL). Using this diagnostic cut-off, South Asia has a prevalence of vitamin D insufficiency of 70% or more, and the prevalence in Southeast Asia ranges from 6-70% (75).


Diagnosis Of Osteoporosis: Pitfalls And Challenges


The diagnosis and management of MBD in the tropics is fraught with challenges. The gold standard tool for measuring BMD is the dual-energy X-ray absorptiometry (DXA) scan (76). However, the limited availability of DXA and the associated costs continue to be  a major hurdle (77). The World Health Organization (WHO) defined T-score of ≤-2.5 SD, originally designed as an epidemiological tool, has been widely adopted as both a diagnostic and intervention threshold for osteoporosis (78). The (National Health and Nutrition Examination (NHANES III) Survey was employed to create the Caucasian reference database. NHANES III is a nationally representative sample of 14,646 women and men in the United States. The data from this survey is used as the reference database in most DXA machines (79, 80). There is a need to have country-specific reference ranges appropriate for the representative population (81, 82).


Utility Of Cost-Effective Screening Tools


To circumvent the challenges associated with the cost and availability of DXA machines, a number of cost-effective screening tools for osteoporosis have been explored. FRAX®, developed by the former WHO Collaborating Centre at the University of Sheffield, is the most widely validated and used fracture risk assessment tool (83). The risk of hip fracture and other osteoporotic fractures varies greatly globally. The FRAX models are calibrated to countries where fracture and death epidemiology is known to adjust for these fluctuations (84). Currently, FRAX is available in 65 countries, including two Asian, 35 European, nine Middle East and African, two North American, seven Latin American, and two Oceanian. However, country-specific FRAX thresholds are unavailable in many tropical countries (85, 86). Another screening tool of note, the Osteoporosis Self-Assessment Tool for Asians (OSTA),  has been validated in multiethnic population in Asian countries (87,88).These screening tools identify patients at high risk for osteoporosis and optimize use of DXA in resource-limited settings (89).


Osteoporosis Awareness


Studies in multiethnic populations across Asia have consistently demonstrated poor knowledge of osteoporosis among women (90-92). Similarly, poor awareness among at-risk populations is a major concern across regions of Africa and South America (93-95). Low awareness among physicians and healthcare authorities contributes to the enormous treatment gap in osteoporosis (93,96-98). Though osteoporosis and osteoporosis-related fractures have consumed significant health resources, it is not recognized as a health priority in tropical countries due to the ‘more’ essential diseases such as tuberculosis, malaria, and human immunodeficiency virus (94). Supporting research, raising awareness and establishing public health services will go a long way in preventing the enormous morbidity and mortality associated with fractures in these regions.


Fracture Liaison Services


FLS are gaining importance to address the low rates of patient work-up and treatment following a fracture. The FLS model attempts to avoid future fractures because there is at least a two-fold risk of refracture (99). The International Osteoporosis Foundation recommends the establishment of FLS to identify and treat patients with fractures properly. Universal FLS implementation in Brazil, Mexico, Colombia, and Argentina was predicted to prevent 31,400 fractures, avoid 292,281 bed days, and save 58.4 million USD in 2019 (100). However, FLS programs are yet to be universally established (100-102). Educating and engaging both private and public sectors in the efficient delivery of FLS could be a pragmatic solution to prevent osteoporotic fractures.


CONCLUSION


MBD is widely prevalent but often ignored in the tropics. Understanding the spectrum of MBD in the tropics will not only address the gap but may also throw light on unique pathophysiological aspects of bone metabolism. Nutrition, environment, infections, and genetic traits are responsible for the development of a diverse array of MBD in the tropics. Optimum utilization of resources is a key to tackle this challenge.


REFERENCES


  1. Senthilraja M, Cherian KE, Jebasingh FK, Kapoor N, Paul TV, Asha HS. Osteoporosis knowledge and beliefs among postmenopausal women: A cross-sectional study from a teaching hospital in southern India. J Family Med Prim Care. 2019;8(4):1374-8.
  2. Shetty S, Kapoor N, Naik D, Asha HS, Prabu S, Thomas N, et al. Osteoporosis in healthy South Indian males and the influence of life style factors and vitamin d status on bone mineral density. J Osteoporos. 2014;2014:723238.
  3. Malhotra N, Mithal A. Osteoporosis in Indians. Indian J Med Res. 2008;127(3):263-8.
  4. Thakur P, Kuriakose C, Cherian KE, Asha HS, Kapoor N, Paul TV. Knowledge gap regarding osteoporosis among medical professionals in Southern India. J Eval Clin Pract. 2020;26(1):272-80.
  5. Cherian KE, Kapoor N, Shetty S, Naik D, Thomas N, Paul TV. Evaluation of Different Screening Tools for Predicting Femoral Neck Osteoporosis in Rural South Indian Postmenopausal Women. J Clin Densitom. 2018;21(1):119-24.
  6. Cherian KE, Kapoor N, Meeta M, Paul TV. Screening Tools for Osteoporosis in India: Where Do We Place Them in Current Clinical Care? J Midlife Health. 2021;12(4):257-62.
  7. Bhadada SK, Chadha M, Sriram U, Pal R, Paul TV, Khadgawat R, et al. The Indian Society for Bone and Mineral Research (ISBMR) position statement for the diagnosis and treatment of osteoporosis in adults. Arch Osteoporos. 2021;16(1):102.
  8. Sajith KG, Kapoor N, Shetty S, Goel A, Zachariah U, Eapen CE, et al. Bone Health and Impact of Tenofovir Treatment in Men with Hepatitis-B Related Chronic Liver Disease. J Clin Exp Hepatol. 2018;8(1):23-7.
  9. Mukherjee S, Arya AK, Bhadada SK, Pal R, Lohani S, Gupta A, et al. Characterization of primary hyperparathyroidism based on target organ involvement: An analysis from the Indian PHPT registry. Clin Endocrinol (Oxf). 2023.
  10. Shetty S, Cherian KE, Shetty S, Kapoor N, Jebasingh FK, Cherian A, et al. Does Baseline PTH Influence Recovery of Bone Mineral Density, Trabecular Bone Score and Bone Turnover Markers? A Prospective Study Following Curative Parathyroidectomy in Primary Hyperparathyroidism. Endocr Pract. 2020;26(12):1442-50.
  11. Fain O. Musculoskeletal manifestations of scurvy. Joint Bone Spine. 2005;72(2):124-8.
  12. Cherian KE, Kapoor N, Shetty S, Jebasingh FK, Asha HS, Hephzibah J, et al. Paget's Disease of Bone: An Entity Still Exists in India. Indian J Endocrinol Metab. 2018;22(3):368-72.
  13. Khositseth S, Bruce LJ, Walsh SB, Bawazir WM, Ogle GD, Unwin RJ, et al. Tropical distal renal tubular acidosis: clinical and epidemiological studies in 78 patients. Qjm. 2012;105(9):861-77.
  14. Pigrau-Serrallach C, Rodríguez-Pardo D. Bone and joint tuberculosis. Eur Spine J. 2013;22 Suppl 4(Suppl 4):556-66.
  15. Ishikawa S, Ishikawa A, Yoh K, Tanaka H, Fujiwara M. Osteoporosis in Male and Female Leprosy Patients. Calcified Tissue International. 1999;64(2):144-7.
  16. Koliou M, Chatzicharalampous E, Charalambous M, Aristeidou K. Congenital syphilis as the cause of multiple bone fractures in a young infant case report. BMC Pediatr. 2022;22(1):728.
  17. Sachdev M, Bery K, Chawla S. Osseous manifestations in congenital syphilis: a study of 55 cases. Clin Radiol. 1982;33(3):319-23.
  18. Taj-Aldeen SJ, Gamaletsou MN, Rammaert B, Sipsas NV, Zeller V, Roilides E, et al. Bone and joint infections caused by mucormycetes: A challenging osteoarticular mycosis of the twenty-first century. Med Mycol. 2017;55(7):691-704.
  19. Joseph A, Rajan R, Paul J, Cherian KE, Kapoor N, Jebasingh F, et al. The continuing crippling challenge of skeletal fluorosis – Case series and review of literature. Journal of Clinical and Translational Endocrinology: Case Reports. 2022;24:100114.
  20. Monir AU, Gundberg CM, Yagerman SE, van der Meulen MC, Budell WC, Boskey AL, et al. The effect of lead on bone mineral properties from female adult C57/BL6 mice. Bone. 2010;47(5):888-94.
  21. Akesson A, Bjellerup P, Lundh T, Lidfeldt J, Nerbrand C, Samsioe G, et al. Cadmium-induced effects on bone in a population-based study of women. Environ Health Perspect. 2006;114(6):830-4.
  22. Paul J, Cherian KE, Thomas N, Paul TV. Hypophosphataemic osteomalacia due to cadmium exposure in the silver industry. Occupational Medicine. 2020;70(3):207-10.
  23. Peris P, Guañabens N, Parés A, Pons F, del Rio L, Monegal A, et al. Vertebral fractures and osteopenia in chronic alcoholic patients. Calcif Tissue Int. 1995;57(2):111-4.
  24. Amato M, Lusini ML, Nelli F. Epidemiology of nephrolithiasis today. Urol Int. 2004;72 Suppl 1:1-5.
  25. Song L, Maalouf NM. Nephrolithiasis. In: Feingold KR, Anawalt B, Blackman MR, Boyce A, Chrousos G, Corpas E, et al., editors. Endotext. South Dartmouth (MA): MDText.com, Inc. Copyright © 2000-2023, MDText.com, Inc.; 2000.
  26. Sorokin I, Mamoulakis C, Miyazawa K, Rodgers A, Talati J, Lotan Y. Epidemiology of stone disease across the world. World J Urol. 2017;35(9):1301-20.
  27. Qian X, Wan J, Xu J, Liu C, Zhong M, Zhang J, et al. Epidemiological Trends of Urolithiasis at the Global, Regional, and National Levels: A Population-Based Study. Int J Clin Pract. 2022;2022:6807203.
  28. Magwira CA, Kullin B, Lewandowski S, Rodgers A, Reid SJ, Abratt VR. Diversity of faecal oxalate-degrading bacteria in black and white South African study groups: insights into understanding the rarity of urolithiasis in the black group. J Appl Microbiol. 2012;113(2):418-28.
  29. Liu Y, Chen Y, Liao B, Luo D, Wang K, Li H, et al. Epidemiology of urolithiasis in Asia. Asian J Urol. 2018;5(4):205-14.
  30. Yanagawa M, Kawamura J, Onishi T, Soga N, Kameda K, Sriboonlue P, et al. Incidence of urolithiasis in northeast Thailand. Int J Urol. 1997;4(6):537-40.
  31. Ahmad F, Nada MO, Farid AB, Haleem MA, Razack SM. Epidemiology of urolithiasis with emphasis on ultrasound detection: a retrospective analysis of 5371 cases in Saudi Arabia. Saudi J Kidney Dis Transpl. 2015;26(2):386-91.
  32. Fakheri RJ, Goldfarb DS. Ambient temperature as a contributor to kidney stone formation: implications of global warming. Kidney Int. 2011;79(11):1178-85.
  33. Basiri A, Moghaddam SM, Khoddam R, Nejad ST, Hakimi A. Monthly variations of urinary stone colic in Iran and its relationship to the fasting month of Ramadan. J Pak Med Assoc. 2004;54(1):6-8.
  34. Stamatelou K, Goldfarb DS. Epidemiology of Kidney Stones. Healthcare (Basel). 2023;11(3).
  35. Vicedo-Cabrera AM, Goldfarb DS, Kopp RE, Song L, Tasian GE. Sex differences in the temperature dependence of kidney stone presentations: a population-based aggregated case-crossover study. Urolithiasis. 2020;48(1):37-46.
  36. Cuevas A, Alvarez V, Carrasco F. Epidemic of metabolic syndrome in Latin America. Curr Opin Endocrinol Diabetes Obes. 2011;18(2):134-8.
  37. Okafor CI. The metabolic syndrome in Africa: Current trends. Indian J Endocrinol Metab. 2012;16(1):56-66.
  38. Pandit K, Goswami S, Ghosh S, Mukhopadhyay P, Chowdhury S. Metabolic syndrome in South Asians. Indian J Endocrinol Metab. 2012;16(1):44-55.
  39. Soligo M, Morlacco A, Zattoni F, Valotto C, G DEG, Beltrami P. Metabolic syndrome and stone disease. Panminerva Med. 2022;64(3):344-58.
  40. Khan SR, Pearle MS, Robertson WG, Gambaro G, Canales BK, Doizi S, et al. Kidney stones. Nat Rev Dis Primers. 2016;2:16008.
  41. Abate N, Chandalia M, Cabo-Chan AV, Jr., Moe OW, Sakhaee K. The metabolic syndrome and uric acid nephrolithiasis: novel features of renal manifestation of insulin resistance. Kidney Int. 2004;65(2):386-92.
  42. Fuster DG, Bobulescu IA, Zhang J, Wade J, Moe OW. Characterization of the regulation of renal Na+/H+ exchanger NHE3 by insulin. Am J Physiol Renal Physiol. 2007;292(2):F577-85.
  43. Domingos F, Serra A. Metabolic syndrome: a multifaceted risk factor for kidney stones. Scand J Urol. 2014;48(5):414-9.
  44. Boyd C, Wood K, Whitaker D, Assimos DG. The influence of metabolic syndrome and its components on the development of nephrolithiasis. Asian J Urol. 2018;5(4):215-22.
  45. Halstead SB. Epidemiology of bladder stone of children: precipitating events. Urolithiasis. 2016;44(2):101-8.
  46. Ashworth M. Endemic bladder stones. Bmj. 1990;301(6756):826-7.
  47. Liu CC, Wu CF, Chen BH, Huang SP, Goggins W, Lee HH, et al. Low exposure to melamine increases the risk of urolithiasis in adults. Kidney Int. 2011;80(7):746-52.
  48. Chang CK, Lee JI, Chang CF, Lee YC, Jhan JH, Wang HS, et al. Betel Nut Chewing Is Associated with the Risk of Kidney Stone Disease. J Pers Med. 2022;12(2).
  49. Rajendra Santosh AB, Jones T. Tropical Oral Disease: Analysing Barriers, Burden, Nutrition, Economic Impact, and Inequalities. Front Nutr. 2021;8:729234.
  50. Botelho J, Machado V, Proença L, Delgado AS, Mendes JJ. Vitamin D Deficiency and Oral Health: A Comprehensive Review. Nutrients. 2020;12(5).
  51. Souza AP, Kobayashi TY, Lourenço Neto N, Silva SM, Machado MA, Oliveira TM. Dental manifestations of patient with vitamin D-resistant rickets. J Appl Oral Sci. 2013;21(6):601-6.
  52. Mittal S, Gupta D, Sekhri S, Goyal S. Oral manifestations of parathyroid disorders and its dental management. Journal of Dental and Allied Sciences. 2014;3(1):34-8.
  53. Jain P, Jain I. Oral Manifestations of Tuberculosis: Step towards Early Diagnosis. J Clin Diagn Res. 2014;8(12):Ze18-21.
  54. Unde MP, Patil RU, Dastoor PP. The Untold Story of Fluoridation: Revisiting the Changing Perspectives. Indian J Occup Environ Med. 2018;22(3):121-7.
  55. Dissanayake CB, Chandrajith R. Medical geology in tropical countries with special reference to Sri Lanka. Environ Geochem Health. 2007;29(2):155-62.
  56. DenBesten P, Li W. Chronic fluoride toxicity: dental fluorosis. Monogr Oral Sci. 2011;22:81-96.
  57. Niazi FC, Pepper T. Dental fluorosis.StatPearls [Internet]: StatPearls Publishing; 2022.
  58. Petermann-Rocha F, Balntzi V, Gray SR, Lara J, Ho FK, Pell JP, et al. Global prevalence of sarcopenia and severe sarcopenia: a systematic review and meta-analysis. J Cachexia Sarcopenia Muscle. 2022;13(1):86-99.
  59. Tyrovolas S, Koyanagi A, Olaya B, Ayuso-Mateos JL, Miret M, Chatterji S, et al. Factors associated with skeletal muscle mass, sarcopenia, and sarcopenic obesity in older adults: a multi-continent study. J Cachexia Sarcopenia Muscle. 2016;7(3):312-21.
  60. Cruz-Jentoft AJ, Baeyens JP, Bauer JM, Boirie Y, Cederholm T, Landi F, et al. Sarcopenia: European consensus on definition and diagnosis: Report of the European Working Group on Sarcopenia in Older People. Age Ageing. 2010;39(4):412-23.
  61. Organization WH. Noncommunicable diseases in the South-East Asia Region, 2011: situation and response. 2012.
  62. Chidakel A, Eb C, Child B. The comparative financial and economic performance of protected areas in the Greater Kruger National Park, South Africa: Functional diversity and resilience in the socio-economics of a landscape-scale reserve network. Journal of Sustainable Tourism. 2020;28(8):1100-19.
  63. Nyirenda MJ. Noncommunicable diseases in sub-Saharan Africa: understanding the drivers of the epidemic to inform intervention strategies. Int Health. 2016;8(3):157-8.
  64. Dhar M, Kapoor N, Suastika K, Khamseh ME, Selim S, Kumar V, et al. South Asian Working Action Group on SARCOpenia (SWAG-SARCO) - A consensus document. Osteoporos Sarcopenia. 2022;8(2):35-57.
  65. Batsis JA, Villareal DT. Sarcopenic obesity in older adults: aetiology, epidemiology and treatment strategies. Nat Rev Endocrinol. 2018;14(9):513-37.
  66. Kapoor N. Thin Fat Obesity: The Tropical Phenotype of Obesity. In: Feingold KR, Anawalt B, Blackman MR, Boyce A, Chrousos G, Corpas E, et al., editors. Endotext. South Dartmouth (MA): MDText.com, Inc.

Copyright © 2000-2023, MDText.com, Inc.; 2000.

  1. Pal R, Bhadada SK, Aggarwal A, Singh T. The prevalence of sarcopenic obesity in community-dwelling healthy Indian adults - The Sarcopenic Obesity-Chandigarh Urban Bone Epidemiological Study (SO-CUBES). Osteoporos Sarcopenia. 2021;7(1):24-9.
  2. Akhtar S. Malnutrition in South Asia-A Critical Reappraisal. Crit Rev Food Sci Nutr. 2016;56(14):2320-30.
  3. Modjadji P, Madiba S. The double burden of malnutrition in a rural health and demographic surveillance system site in South Africa: a study of primary schoolchildren and their mothers. BMC Public Health. 2019;19(1):1087.
  4. Gassmann F, de Groot R, Dietrich S, Timar E, Jaccoud F, Giuberti L, et al. Determinants and drivers of young children’s diets in Latin America and the Caribbean: Findings from a regional analysis. PLOS Global Public Health. 2022;2(7):e0000260.
  5. Pinto Neto LF, Sales MC, Scaramussa ES, da Paz CJ, Morelato RL. Human immunodeficiency virus infection and its association with sarcopenia. Braz J Infect Dis. 2016;20(1):99-102.
  6. Reginster JY, Beaudart C, Buckinx F, Bruyère O. Osteoporosis and sarcopenia: two diseases or one? Curr Opin Clin Nutr Metab Care. 2016;19(1):31-6.
  7. Hirschfeld HP, Kinsella R, Duque G. Osteosarcopenia: where bone, muscle, and fat collide. Osteoporos Int. 2017;28(10):2781-90.
  8. Mendes MM, Hart K, Botelho P, Lanham‐New S. Vitamin D status in the tropics: is sunlight exposure the main determinant? : Wiley Online Library; 2018.
  9. Nimitphong H, Holick MF. Vitamin D status and sun exposure in southeast Asia. Dermatoendocrinol. 2013;5(1):34-7.
  10. Consensus development conference: diagnosis, prophylaxis, and treatment of osteoporosis. Am J Med. 1993;94(6):646-50.
  11. Varthakavi PK, Joshi AS, Bhagwat NM, Chadha MD. Osteoporosis treatment in India: Call for action. Indian J Endocrinol Metab. 2014;18(4):441-2.
  12. Mithal A, Bansal B, Kyer CS, Ebeling P. The Asia-Pacific Regional Audit-Epidemiology, Costs, and Burden of Osteoporosis in India 2013: A report of International Osteoporosis Foundation. Indian J Endocrinol Metab. 2014;18(4):449-54.
  13. Looker AC, Wahner HW, Dunn WL, Calvo MS, Harris TB, Heyse SP, et al. Updated data on proximal femur bone mineral levels of US adults. Osteoporos Int. 1998;8(5):468-89.
  14. Looker AC, Orwoll ES, Johnston CC, Jr., Lindsay RL, Wahner HW, Dunn WL, et al. Prevalence of low femoral bone density in older U.S. adults from NHANES III. J Bone Miner Res. 1997;12(11):1761-8.
  15. Cherian KE, Kapoor N, Asha HS, Thomas N, Paul TV. Influence of Different Reference Databases on Categorization of Bone Mineral Density: A Study on Rural Postmenopausal Women from Southern India. Indian J Endocrinol Metab. 2018;22(5):579-83.
  16. Balachandran K, Asirvatham AR, Mahadevan S. The Impact of GE Lunar vs ICMR Database in Diagnosis of Osteoporosis among South Indian Subjects. Indian J Endocrinol Metab. 2019;23(5):525-8.
  17. Kanis JA, McCloskey EV, Johansson H, Oden A, Ström O, Borgström F. Development and use of FRAX in osteoporosis. Osteoporos Int. 2010;21 Suppl 2:S407-13.
  18. Kanis JA, Odén A, McCloskey EV, Johansson H, Wahl DA, Cooper C. A systematic review of hip fracture incidence and probability of fracture worldwide. Osteoporos Int. 2012;23(9):2239-56.
  19. Lekamwasam S. The diversity of Fracture Risk Assessment Tool (FRAX)-based intervention thresholds in Asia. Osteoporos Sarcopenia. 2019;5(4):104-8.
  20. Kanis JA, Harvey NC, Cooper C, Johansson H, Odén A, McCloskey EV. A systematic review of intervention thresholds based on FRAX : A report prepared for the National Osteoporosis Guideline Group and the International Osteoporosis Foundation. Arch Osteoporos. 2016;11(1):25.
  21. Chandran M, Chin YA, Choo KS, Ang WC, Huang XF, Liu XM, et al. Comparison of the Osteoporosis Self-Assessment Tool for Asians and the fracture risk assessment tool - FRAX to identify densitometric defined osteoporosis: A discriminatory value analysis in a multi-ethnic female population in Southeast Asia. Osteoporos Sarcopenia. 2020;6(2):53-8.
  22. Agarwal K, Cherian KE, Kapoor N, Paul TV. OSTA as a screening tool to predict osteoporosis in Indian postmenopausal women - a nationwide study. Arch Osteoporos. 2022;17(1):121.
  23. Nagendra L, Bhavani N, Menon VU, Pavithran PV, Menon AS, Abraham N, et al. FRAX-based osteoporosis treatment guidelines for resource-poor settings in India. Arch Osteoporos. 2021;16(1):69.
  24. Cheung EYN, Tan KCB, Cheung CL, Kung AWC. Osteoporosis in East Asia: Current issues in assessment and management. Osteoporos Sarcopenia. 2016;2(3):118-33.
  25. Nguyen NV, Dinh TA, Ngo QV, Tran VD, Breitkopf CR. Awareness and knowledge of osteoporosis in Vietnamese women. Asia Pac J Public Health. 2015;27(2):Np95-105.
  26. Tan HC, Seng JJB, Low LL. Osteoporosis awareness among patients in Singapore (OASIS)-a community hospital perspective. Arch Osteoporos. 2021;16(1):151.
  27. Albergaria BH, Chalem M, Clark P, Messina OD, Pereira RMR, Vidal LF. Consensus statement: osteoporosis prevention and treatment in Latin America-current structure and future directions. Arch Osteoporos. 2018;13(1):90.
  28. Sitati FC, Obimbo MM, Gichangi P. Knowledge and Beliefs on Osteoporosis among African Postmenopausal Women in a Kenyan Semi-Rural County of Kiambu. J Bone Metab. 2021;28(1):91-8.
  29. Njeze Ngozi R, Ikechukwu O, Miriam A, Olanike AU, Akpagbula Ulugo D, Njeze Nneze C. Awareness of osteoporosis in a polytechnic in Enugu, South East Nigeria. Arch Osteoporos. 2017;12(1):51.
  30. Tay CL, Ng WL, Beh HC, Lim WC, Hussin N. Screening and management of osteoporosis: a survey of knowledge, attitude and practice among primary care physicians in Malaysia. Arch Osteoporos. 2022;17(1):72.
  31. Kim JH, Park YS, Oh KJ, Lee SY, Lee SY, Lee SK, et al. Perception of severe osteoporosis amongst medical doctors in South Korea: Awareness, impact, and treatment. Osteoporos Sarcopenia. 2016;2(1):45-63.
  32. Paruk F, Tsabasvi M, Kalla AA. Osteoporosis in Africa-where are we now. Clin Rheumatol. 2021;40(9):3419-28.
  33. Bonanni S, Sorensen AA, Dubin J, Drees B. The Role of the Fracture Liaison Service in Osteoporosis Care. Mo Med. 2017;114(4):295-8.
  34. Aziziyeh R, Perlaza JG, Saleem N, Guiang H, Szafranski K, McTavish RK. Benefits of fracture liaison services (FLS) in four Latin American countries: Brazil, Mexico, Colombia, and Argentina. J Med Econ. 2021;24(1):96-102.
  35. Chang Y, Huang C, Hwang J, Kuo J, Lin K, Huang H, et al. Fracture liaison services for osteoporosis in the Asia-Pacific region: current unmet needs and systematic literature review. Osteoporos Int. 2018;29(4):779-92.
  36. Bernstein BP, Duma MTN, Or O, Fisher-Negev T, Weil Y. Fragility fracture management and FLS models in South Africa and Israel. OTA Int. 2022;5(3 Suppl):e171.

Adrenal Cortex: Embryonic Development, Anatomy, Histology and Physiology

ABSTRACT


The adrenal glands consist of the adrenal cortex and medulla, which have distinct, albeit interdependent functional properties. The adrenal cortex contains the zona glomerulosa that produces mineralocorticoids, the zona fasciculatathat is the site of glucocorticoid biosynthesis, and the zona reticularis, which is responsible for the production of adrenal androgens. In this chapter, we discuss the embryonic development, anatomy, histology and physiology of the adrenal cortex.


INTRODUCTION


The adrenal gland was first described by Eustachius in 1563 and its importance was later recognized by the work of Thomas Addison in 1855 and Brown-Sequard in 1856 (1-3). The latter performed a series of bilateral adrenalectomies in dogs, demonstrating that these endocrine glands were necessary for life (2, 3). In the midst of the 19th century, newly emerged histochemical techniques showed that the adrenal consists of a cortex and medulla and have divergent albeit interdependent cellular and functional properties. Indeed, the adrenal cortex consists of the zona glomerulosa, the zona fasciculata, and the zona reticularis, which respectively produce mineralocorticoids (aldosterone), glucocorticoids (cortisol in man and corticosterone in rodents), and adrenal androgens (4, 5). On the other hand, the adrenal medulla contains chromaffin cells, which are responsible for the biosynthesis and secretion of the catecholamines epinephrine and norepinephrine. Adrenal cortex hormones are steroid molecules, which are derived from cholesterol through serial conversions catalyzed by specific enzymes, the “steroid hydroxylases” that belong to the cytochrome P450 (CYP) superfamily. This biochemical process is known as “adrenal steroidogenesis” (4, 5). At the molecular and cellular level, adrenal cortex hormones mediate their pleiotropic actions through binding to their cognate receptors, which are nuclear receptors that function as ligand-activated transcription factors, influencing gene expression in a positive or negative fashion (4, 5).  


EMBRYONIC DEVELOPMENT OF ADRENAL CORTEX


The adrenal gland is composed of two embryologically distinct tissues, the cortex and medulla, arising from the mesoderm of the urogenital ridge and ectodermal neural chromaffin cells, respectively (6, 7). An isolated clump of cells appears within the urogenital ridge, known as the adrenal-gonadal primordium, at 28-30 days post conception. These cells express the transcription factor steroidogenic factor-1 (SF1 or Ad4BP or NR5A1), which contributes substantially to adrenal development and steroidogenesis. Adrenal-gonadal primordium gives rise to the fetal adrenal cortex and to Leydig cells. At 7-8 weeks of gestation, the adrenal cortex consists of a large inner zone, the fetal zone (FZ), and a small outer zone, the definitive zone (DZ) (8, 9). At the end of the 9th week of gestation, adrenals become fully encapsulated (10). The main steroid of the FZ is dehydroepiandrosterone (DHEA), as cells within this zone express the enzyme cytochrome P450 17α (CYP17A1) (7). Corticotropin-releasing hormone (CRH) secreted by the human placenta and the chromaffin cells of the adrenal medulla stimulates DHEA secretion by the FZ (11). DHEA is converted into 16-hydroxy-DHEA by the fetal liver and is converted into estriol by the placenta (12).


After birth, shrinkage of the fetal zone due to increased apoptotic activity occurs, leading to a decrease of the weight of adrenal glands by 50% (13). In the next three years, cells of the DZ and, to a lesser extent, cellular remnants of the FZ differentiate into the three functionally and histologically distinct zones: the outer zona glomerulosa, the intermediate zona fasciculata, and the inner zona reticularis (4, 5).


ANATOMY OF THE ADRENAL CORTEX


The adrenal glands are located in the retroperitoneum on the top of the kidneys. They are surrounded by a stroma of connective tissue that maintains adrenal structure, termed the “capsule” (4, 5).


Blood Supply


With an estimated flow rate of about 5 ml per minute, though small in size, the adrenal glands are among the most extensively vascularized organs (Fig. 1). Blood supply is maintained by up to fifty arterial branches for each adrenal gland, which arise directly from the aorta, the renal arteries, and the inferior phrenic arteries. Blood is channeled into the subcapsular arteriolar plexus, and subsequently distributed to the sinusoids, that then supply the adrenal cortex and medulla.


Endothelial cells were demonstrated to interfere with adrenocortical cells through specific factors and the vasculature seems to play a crucial role for the zonation and function of the adrenal cortex.


A direct blood supply of the medulla is maintained by shunt arterioles (14, 15). After supplying the cortex and medulla, blood collects at the cortico-medullary junction and drains through the central adrenal vein to the renal vein or directly into the inferior vena cava.


Figure 1. Extensively vascularized adrenal cortex.


Innervation


The adrenal cortex receives afferent and efferent innervation (Fig 2). A direct contact of nerve terminals with adrenocortical cells has been suggested (16) and chemoreceptors and baroreceptors present in the adrenal cortex infer efferent innervation (17, 18). Diurnal variation in cortisol secretion and compensatory adrenal hypertrophy are influenced by adrenal innervation (19, 20). Splanchnic nerve innervation has an effect in the regulation of adrenal steroid release (20).


Figure 2. Silver-stained nerve cells (dark spots) and fibers (dark lines).


HISTOLOGY OF THE ADRENAL CORTEX


In contrast to the fetal cortex, which is constructed from primarily the zona fetalis, the adult adrenal cortex consists of three anatomically distinct zones (Fig. 3):

  1. The outer zona glomerulosa, site of mineralocorticoid production (e.g., aldosterone), mainly regulated by angiotensin II, potassium, and ACTH. In addition, dopamine, atrial natriuretic peptide (ANP) and other neuropeptides modulate adrenal zona glomerulosa function.
  2. The central zona fasciculata, responsible mainly for glucocorticoid synthesis, is regulated by ACTH. In addition, several cytokines (IL-1, IL-6, TNF), neuropeptides, and catecholamines influence the biosynthesis of glucocorticoids.
  3. The inner zona reticularis, site of adrenal androgen (predominantly dehydroepiandrostenedione [DHEA], DHEA sulfate [DHEA-S] and Δ4-androstenedione) secretion, as well as some glucocorticoid production (cortisol and corticosterone).

Figure 3. Double immunostained cross-section of a human adrenal gland for 17-α-Hydroxylase and chromogranin A. zM = adrenal medulla, zR = zona reticularis, zF = zona fasciculata, zG = zona glomerulosa, Caps = adrenal capsule.


Adrenocortical cells are arranged in a cord-like manner, extending from the adrenal capsule to the medulla, and are embedded within a widespread capillary network. These cells are rich in mitochondria and smooth endoplasmic reticulum, which form an extended network of anastomosing tubules. Zona glomerulosa cells are scattered and produce and secrete aldosterone (5). The zona fasciculata contains large cells replete with lipids, the “clear cells”, which synthesize and release cortisol (5). The zona reticularis consists of cells containing lipofuscin granules, termed “compact” cells that are responsible for adrenal androgen biosynthesis and secretion. This cellular zone develops at the age of 5 years in females and 6 years in males, a physiologic process termed as “adrenarche” (5). 


In some rat species, a fourth zone can further be distinguished, the zona intermedia, between the glomerulosa and the fasciculata currently postulated to be a site of initiation of adrenocyte proliferation and differentiation and a zone containing the adrenal cortical stem cells.


However, evidence suggests that adrenocortical cells arise within or underneath the capsule under the influence of sonic hedghog signaling and move centripetally along gradients towards the border to the adrenal medulla where they form cortical islets and / or undergo apoptosis (14, 21, 22). It may even be possible that cortical cells adopt different functional states as they “wander” from their origin somewhere in the outer cortex and pass along blood vessels into the direction of the innermost cortex through the different zones.


In addition to adrenocortical cells, macrophages are distributed throughout the adrenal cortex (23). In addition to their phagocytic activity, they produce and secrete cytokines (TNFb, IL-1, IL-6) and peptides (VIP), which interact with adrenocortical cells and influence their functions (24-26). Lymphocytes are scattered in the adrenal cortex (Fig. 4), and have been shown to produce ACTH-like substances (27). It has also been shown, that immuno-endocrine interactions between lymphocytes and adrenal zona reticularis cells can stimulate dehydroepiandrosterone production (28, 29).


Figure 4. Lymphocytes (dark spots), immunostained for CD 45.


PHYSIOLOGY OF THE ADRENAL CORTEX


The most important function of the adrenal cortex is adrenal steroidogenesis that occurs in all three cellular zones (5). This physiologic process is regulated by distinct systems, depending on steroid type produced. Aldosterone production by the zona glomerulosa depends on the activity of the renin-angiotensin system and serum potassium concentrations, and, to a lesser extent on plasma ACTH concentrations. Cortisol biosynthesis by the zona fasciculata is triggered by ACTH. Adrenal androgens are produced by the zona reticularis, which is also regulated by ACTH and other as yet unknown factors (5).


All adrenal steroids are biosynthesized from cholesterol molecules, which are derived primarily from low-density lipoprotein (LDL) or from cholesterol esters hydrolyzed in adrenocortical cells (Fig. 5). To initiate steroidogenesis, adrenocortical cells are stimulated by several signals to increase their uptake of lipoproteins from the systemic circulation to provide the appropriate concentrations of cholesterol (30, 31). The latter is then converted into steroid molecules in serial biochemical reactions that are mediated by the “steroid hydroxylases” (5). The first and rate-limiting step in steroidogenesis begins when ACTH and/or other signals increase the expression of the “steroidogenic acute regulatory protein” (StAR), which facilitates the import of cholesterol to the inner mitochondrial membrane (30, 32, 33). Within the mitochondria, the C27 cholesterol loses six carbons and is converted into the C21 pregnenolone through the enzyme CYP11A or cholesterol desmolase (P450scc) (34). Pregnenolone moves to the cytoplasm to undergo further enzymatic conversions.


In the zona glomerulosa, pregnenolone is converted to progesterone by 3β-hydroxysteroid dehydrogenase (3β-HSD) (35). Progesterone is converted to deoxycorticosterone (DOC) through 21-hydroxylation by CYP21 or 21-hydroxylase (P450c21). DOC is then11β-hydroxylated to form corticosterone, which is converted to aldosterone through 18-hydroxylation and 18-oxidation. The last three reactions are catalyzed by the P450 enzyme CYP11B2 or aldosterone synthase (P450aldo) (Fig. 5) (36).


In the zona fasciculata, pregnenolone is converted to 17α-hydroxypregnenolone in the endoplasmic reticulum by the enzyme CYP17 or 17α-hydroxylase/17,20-lyase (P450c17) (37). 17α-Hydroxypregnenolone is then converted to 17α-hydroxyprogesterone by 3β-HSD, and the latter steroid molecule is 21-hydroxylated to form 11-deoxycortisol by CYP21. Finally, 11-deoxycortisol is enzymatically converted to cortisol by CYP11B1 or 11β-hydroxylase (P450c11), a reaction that occurs within the mitochondria (5) (Fig. 5).


In the zona reticularis, both pregnenolone and progesterone are 17α-hydroxylated (5). 17α-Hydroxypregnenolone forms dehydroepiandrosterone (DHEA) by the enzyme CYP17. DHEA is converted to Delta4-androstenedione by 3β-HSD. Importantly, DHEA may become sulfonated to form DHEAS by the enzyme sulfotransferase SULT2A1. In the gonads, Delta4-androstenedione is converted to testosterone by 17β-hydroxysteroid dehydrogenase (38). In the ovaries of pubertal girls, CYP19 or aromatase (P450c19) catalyzes the conversion of both Delta4-androstenedione to estrone, and testosterone to 17β-estradiol (39). In androgen-target tissues, testosterone is converted to dihydrotestosterone by 5α-reductase (40) (Fig. 5).


The adrenal glands also biosynthesize 11-oxyandrogens, which are androgens that share an oxygen atom on carbon position 11 (41-44). Among them, 11- hydroxyandrostenedione is the most abundant. The C11-oxy biochemical pathway begins when Delta4-androstenedione and testosterone are converted to 11β-hydroxyandrostenedione and 11β-hydroxytestosterone, respectively, by CYP11B1 (Fig. 5). 11β-Hydroxy-testosterone is converted to 11β-hydroxy-dihydrotestosterone by the enzyme SRD5A1. 11β-Hydroxy-androstenedione forms 11-ketoandrostenedione by HSD11B. 11-Ketoandrostenedione forms 11-ketotestosterone by ACR1C3, and, then, 11-ketodihydrotestosterone by SRD5A (Fig. 5). Moreover, 11OH-dihydrotestosterone can be converted to 11-ketodihydrotestosterone by HSD11B (Fig.5) (41-44).


Figure 5. Schematic presentation of adrenal steroidogenesis.


Adrenal cortex hormones bind onto specific steroid receptors that belong to the nuclear receptor superfamily of transcription factors, and play fundamental roles in all physiologic functions. Indeed, glucocorticoids bind onto the glucocorticoid receptor (GR) (45), mineralocorticoids signal through the mineralocorticoid receptor (MR) (46), and adrenal androgens may bind onto the androgen receptor (AR), or, following aromatization, onto the estrogen receptor (ER) (47).


ADRENAL CORTEX-MEDULLA INTERACTIONS


With regard to function, there is no strict separation between the steroid-producing adrenal cortex and the catecholamine-producing medulla. Several studies have provided evidence that chromaffin cells once thought to be located exclusively in the medulla, are found in all zones of the adult adrenal cortex, and that cortical cells are found in the medulla (48-50). This close anatomical co-localization is a prerequisite for paracrine interactions (Fig. 6). The interaction between adrenal cortex and medulla is also supported by clinical data (reviewed in 51). Patients with congenital adrenal hyperplasia or Addison’s disease display dysfunction of the adrenal medulla (52-54).


Figure 6. Electromicrograph of rat adrenal gland. Chromafine cell with characteristic granules (G) in direct contact with adrenal cortical cell with characteristic mitochondria (M).


REFERENCES


  1. Hiatt JR, Hiatt N. The conquest of Addison's disease. Am J Surg. 1997;174(3):280-283.
  2. Brown-Sequard E. Recherches experimentales sur le physiologie et la pathologie des capsules surrénales. Arch Gen de Med. 1856;8:385-401.
  3. Brown-Sequard E. Recherches experimentales sur le physiologie et la pathologie des capsules surrénales. Arch Gen de Med. 1856;8:572-598.
  4. Nicolaides NC, Charmandari E, Chrousos GP. Adrenal Steroid Hormone Secretion: Physiologic and Endocrine Aspects. In Reference Module in Biomedical Sciences. Elsevier; 2014.
  5. Nicolaides NC, Chrousos GP. Adrenal cortex hormones. In: Hormonal Signaling in Biology and Medicine (2019) Academic Press. pp 619-633.
  6. Xing Y, Lerario AM, Rainey W, Hammer GD. Development of adrenal cortex zonation. Endocrinol Metab Clin North Am. 2015;44(2):243-274.
  7. Pitsava G, Stratakis CA. Adrenal hyperplasias in childhood: An update. Front Endocrinol (Lausanne).2022;13:937793.
  8. Hanley NA, Rainey WE, Wilson DI, Ball SG, Parker KL. Expression profiles of SF-1, DAX1, and CYP17 in the human fetal adrenal gland: potential interactions in gene regulation. Mol Endocrinol. 2001;15(1):57-68.
  9. Goto M, Hanley KP, Marcos J, Wood PJ, Wright S, Postle AD, et al.. In humans, early cortisol biosynthesis provides a mechanism to safeguard female sexual development. J Clin Invest. 2006;116(4):953-960.
  10. Keegan CE, Hammer GD. Recent insights into organogenesis of the adrenal cortex. Trends Endocrinol Metab.2002;13(5):200-208.
  11. Smith R, Mesiano S, Chan EC, Brown S, Jaffe RB. Corticotropin-releasing hormone directly and preferentially stimulates dehydroepiandrosterone sulfate secretion by human fetal adrenal cortical cells. J Clin Endocrinol Metab. 1998;83(8):2916-2920.
  12. Kitada M, Kamataki T, Itahashi K, Rikihisa T, Kanakubo Y. P-450 HFLa, a form of cytochrome P-450 purified from human fetal livers, is the 16 alphahydroxylase of dehydroepiandrosterone 3-sulfate, J. Biol. Chem. 262 (1987) 13534–13537.
  13. Fuqua JS. Adrenal tumors in childhood. Adv Pediatr. 2021;68:227-244.
  14. Hornsby PJ. Adrenarche: a cell biological perspective. J Endocrinol. 2012;214:113-119.
  15. Vinson GP, Pudney JA, Whitehouse BJ. The mammalian adrenal circulation and the relationship between adrenal blood flow and steroidogenesis. J Endocrinol. 1985; 105:285-294.
  16. Vinson GP, Hinson JP, Tσth IE. The neuroendocrinology of the adrenal cortex. J Neuroendocrinol. 1994;6:235-246.
  17. Niijima A, Winter DL. Chemosensitive receptors in the adrenal gland. Fed Proc. 1967;26: 544.
  18. Niijima A, Winter DL. Baroreceptors in the adrenal gland. Science 1968;159:434-435.
  19. Dallman MF, Engeland WC, McBride MH. The neural regulation of compensatory adrenal growth. Ann NY Acad Sci. 1977;297:373-392.
  20. Dijkstra I, Binnekade R, Tilders FJH. Diurnal variation in resting levels of corticosterone is not mediated by variation in adrenal responsiveness to adrenocorticotropin but involves splanchnic nerve integrity. Endocrinology1996;137:540-547.
  21. Wood MA, Hammer GD. Adrenocortical stem and progenitor cells: unifying model of two proposed origins. Mol Cell Endocrinol. 2011;336:206-222.
  22. Dringenberg T, Schwitalla M, Haase M, Scherbaum WA, Willenberg HS. Control of CYP11B2/CYP11B1 Expression Ratio and Consequences for the Zonation of the Adrenal Cortex. Horm Metab Res. 2013;45:81-85.
  23. Gonzαlez-Hernαndez JA, Bornstein SR, Ehrhart-Bornstein M, Geschwend JE, Adler G, Scherbaum WA. Macrophages within the human adrenal gland. Morphological data for a possible local immune-neuroendocrine interaction. Cell Tissue Res. 1994;278:201-205.
  24. Dinarello CA. The biology of interleukin 1. In: Kishimoto T (ed) Interleukins: Molecular Biology and Immunology. Karger, (1992) Basel, pp 1-32.
  25. Ottaway CA. Vasoactive intestinal peptide and immune function. In: Ader R, Felten DL, Cohen N (eds) Psychoneuroimmunology. Academic Press, (1991), San Diego, CA, pp 225-262.
  26. Woloski BMRNJ, Smith EM, Meyer III WJ, Fuller GM, Blalock JE. Corticotropin-releasing activity of monokines. Science. 1985;230:1035-1037.
  27. Bornstein SR, Ehrhart-Bornstein M, Scherbaum WA, Pfeiffer EF, Holst JJ. Effects of splanchnic nerve stimulation on the adrenal cortex may be mediated by chromaffin cells in a paracrine manner. Endocrinology 1990;127:900-906.
  28. Wolkersdorfer GW, Lohmann T, Marx C, Schrφder S, Pfeiffer R, Stahl H-D, Scherbaum WA, Chrousos GP, Bornstein SR. Lymphocytes stimulate dehydroepiandrosterone production through direct cellular contact with adrenal zona reticularis cells: a novel mechanism of immune-endocrine interaction. J Clin Endocrinol Metab.1999;84:4220-4227.
  29. Bornstein SR, Chrousos GP. Adrenocorticotropin ACTH- and Non-ACTH-Mediated Regulation of the Adrenal Cortex: Neural and Immune Inputs. J Clin Endo Metab. 1999; 84:1729-1736.
  30. Simpson ER, Waterman MR. Steroid biosynthesis in the adrenal cortex and its regulation by adrenocorticotropin. In DeGroote, L.J., Besser, M., Burger, H.G., Jameson, J.L., Loriaux, D.L., Marshall, J.C., Odell, W.D., Potts, J.T.Jr & Rubenstein, A.H. (eds) Endocrinology, 1995, pp 1630-1641. Philadelphia: W. B. Saunders.
  31. Stewart PM and Newell-Price JDC. The adrenal cortex. In Williams Textbook of Endocrinology, Larsen PR, Kronenberg HM, Melmed S, Polansky KS (Eds), 13th edition. Elsevier Science (USA). 2016; Chapter 15, pages 489-555.
  32. Arakane F, Kallen CB, Watari H, Foster JA, Sepuri NB, Pain D, Stayrook SE, Lewis M, Gerton GL, Strauss JF. The mechanism of action of steroidogenic acute regulatory protein (StAR). StAR acts on the outside of mitochondria to stimulate steroidogenesis. J Biol Chem. 1998;273:16339 – 16345.
  33. Stocco DM, Clark BJ. Regulation of the acute production of steroids in steroidogenic cells. Endocr Rev. 1996;17:221-244.
  34. Nebert DW, Nelson DR, Coon MJ, Estabrook RW, Feyereisen R, Fujii – Kuriyama Y, Gonzalez FJ, Guengerich FP, Gunsalus IC, Johnson EF, Loper JC, Sato R, Waterman MR, Waxman DJ. The P450 superfamily: update on new sequences, gene mapping, and recommended nomenclature. DNA Cell Biol 1991;10:1-14.
  35. Cherradi N, Rossier MF, Vallotton MB, Timberg R, Friedberg I, Orly J, Wang XJ, Stocco DM, Capponi AM. Submitochondrial distribution of three key steroidogenic proteins (steroidogenic acute regulatory protein and cytochrome P450 scc and 3β-hydroxysteroid dehydrogenase isomerase enzymes) upon stimulation by intracellular calcium in adrenal glomerulosa cells. J Biol Chem. 1997;272:7899-7909.
  36. White PC, Curnow KM, Pascoe L. Disorders of steroid 11β-hydroxylase isozymes. Endocr Rev. 1994;15:421-438.
  37. Yanase T, Simpson ER, Waterman MR. 17α-hydroxylase/17,20-lyase deficiency: from clinical investigation to molecular definition. Endocr Rev. 1991;12:91-108.
  38. Penning TM. Molecular endocrinology of hydroxysteroid dehydrogenases. Endocr Rev. 1997;18:281-305.
  39. Simpson ER, Mahendroo MS, Means GD, Kilgore MW, Hinshelwood MM, Graham-Lorence S, Amarneh B, Ito Y, Fisher CR, Michael MD, Mendelson CR, Bulun SE. Aromatase cytochrome P450, the enzyme responsible for estrogen biosynthesis. Endocr Rev. 1994;15:342-355.
  40. Wilson JD, Griffin JE, Russell DW. Steroid 5α-reductase 2 deficiency. Endocr Rev. 1993;14:577-593.
  41. Turcu AF, Rege J, Auchus RJ, Rainey WE. 11-Oxygenated androgens in health and disease. Nat Rev Endocrinol. 2020;16(5):284-296.
  42. Elzenaty RN, du Toit T, Flück CE. Basics of androgen synthesis and action. Best Pract Res Clin Endocrinol Metab. 2022;36(4):101665.
  43. Fukami M. 11-Oxyandrogens from the viewpoint of pediatric endocrinology. Clin Pediatr Endocrinol.2022;31(3):110-115.
  44. Storbeck KH, O'Reilly MW. The clinical and biochemical significance of 11-oxygenated androgens in human health and disease. Eur J Endocrinol. 2023;188(4):R98-R109.
  45. Nicolaides NC, Chrousos G, Kino T. Glucocorticoid Receptor. 2020 Nov 21. In: Feingold KR, Anawalt B, Blackman MR, Boyce A, Chrousos G, Corpas E, de Herder WW, Dhatariya K, Dungan K, Hofland J, Kalra S, Kaltsas G, Kapoor N, Koch C, Kopp P, Korbonits M, Kovacs CS, Kuohung W, Laferrère B, Levy M, McGee EA, McLachlan R, New M, Purnell J, Sahay R, Shah AS, Singer F, Sperling MA, Stratakis CA, Trence DL, Wilson DP, editors. Endotext [Internet]. South Dartmouth (MA): MDText.com, Inc.; 2000–.
  46. Lother A, Jaisser F, Wenzel UO. Emerging fields for therapeutic targeting of the aldosterone-mineralocorticoid receptor signaling pathway. Br J Pharmacol. 2022;179(13):3099-3102.
  47. Chaturvedi AP, Dehm SM. Androgen receptor dependence. Adv Exp Med Biol. 2019; 1210:333e50.
  48. Bornstein SR, Ehrhart-Bornstein M, Usadel H, Bockmann M, Scherbaum WA (1991) Morphological evidence for a close interaction of chromaffin cells with cortical cells within the adrenal gland. Cell Tissue Res 265:1-9.
  49. Bornstein SR, Gonzαlez-Hernαndez JA, Ehrhart-Bornstein M, Adler G, Scherbaum WA (1994) Intimate contact of chromaffin and cortical cells within the human adrenal gland forms the cellular basis for important intraadrenal interactions. J Clin Endocrinol Metab 78:225-232.
  50. Ehrhart-Bornstein M, Hinson JP, Bornstein SR, Scherbaum WA, Vinson GP (1998) Intraadrenal interactions in the regulation of adrenocortical steroidogenesis. Endocrine Reviews 19(2):101-143.
  51. Bechmann N, Berger I, Bornstein SR, Steenblock C. Adrenal medulla development and medullary-cortical interactions. Mol Cell Endocrinol. 2021;528:111258.
  52. Bornstein SR, Allolio B, Arlt W, Barthel A, Don-Wauchope A, Hammer GD, Husebye ES, Merke DP, Murad MH, Stratakis CA, et al., Diagnosis and treatment of primary adrenal insufficiency: an endocrine society clinical practice guideline. Clin. Endocrinol. Metab. 2016;101:364-389.
  53. Merke DP, Chrousos GP, Eisenhofer G, Weise M, Keil MF, Rogol AD, Van Wyk JJ, Bornstein SR. Adrenomedullary dysplasia and hypofunction in patients with classic 21-hydroxylase deficiency. Engl. J. Med.2000;343:1362-1368.
  54. Merke DP, Bornstein SR. 2005. Congenital adrenal hyperplasia. Lancet 2005;365:2125-2136.

Disorders of Adrenal Glands and Sex Development in Children: Insights From the Tropics

ABSTRACT


The adrenal gland is essential for survival and its function is compartmentalized into specific zones. Disorders of the adrenal gland can be classified as those affecting the adrenal cortex or medulla. Pediatric adrenal disorders can have distinct presentations and etiologies in comparison to adults, such as adrenal insufficiency associated with genetic syndromes or Cushing’s syndrome associated with adrenocortical tumors and primary pigmented nodular adrenocortical disease. Congenital adrenal hyperplasia (CAH) has been commonly reported from the tropics, and rare variants of CAH have also been recognized in populations where consanguinity is prevalent. Pheochromocytomas and paragangliomas (PPGL) have been reported from tropical countries, some with rare presentations. The frequent rate of heritability and mutations in PPGL highlights the importance of genetic studies among children. The role of functional imaging is evolving for PPGLs as data is emerging from cohort studies. Disorders of Sex Development (DSD) comprise a heterogeneous group of disorders that can present in any age group. DSDs in childhood usually present with ambiguous genitalia and a multidisciplinary approach is required for its management. The diagnosis of adrenal disorders can sometimes pose a challenge in tropical countries due to resource constraints, lack of awareness, and access to medical care. However, available data from cohort studies and case reports have highlighted differences in etiology and presentation as compared to other parts of the world and the need for further studies.


INTRODUCTION


Adrenal disorders commonly seen in the tropics include adrenal insufficiency, congenital adrenal hyperplasia, adrenal Cushing’s syndrome, and pheochromocytoma/paragangliomas


Adrenal Insufficiency


It is characterized by decreased production of cortisol by the adrenals. The identification of adrenal insufficiency in children requires a high index of suspicion. This is important not only to prevent an adrenal crisis but to identify the associated comorbidities.  Acute adrenal crisis can present in infancy as a salt-wasting crisis or precipitated in children due to stressors such as illness, trauma, or surgery. They often present as an emergency with abdominal pain, vomiting, hypotension, hypoglycemia with seizures, and hyponatremia which eventually leads to shock and cardiovascular collapse if undiagnosed. Chronic adrenal insufficiency presents as prolonged neonatal jaundice, failure to thrive, hyperpigmentation, anorexia, fatigue, nausea and vomiting, salt craving, diarrhea, abdominal pain, postural hypotension, and tachycardia. A study from Pakistan characterized the presentation of children with adrenal insufficiency of which 19% presented with an adrenal crisis following an acute illness (1). The chronic symptoms reported were not different from that seen in another cohort form South Africa (2). Rare primary presentations of adrenal insufficiency as infantile cholestasis (3) and gigantism with motor delay have been reported (4).


The causes of adrenal insufficiency in children are different as compared to adults.  Etiologically it can be divided into primary and secondary adrenal insufficiency. It can also be seen as an isolated condition or in association with specific syndromes.


Primary adrenal insufficiency may be related to an underlying genetic or metabolic cause. Congenital Adrenal Hyperplasia (CAH) is the most common cause of primary adrenal insufficiency. Autoimmunity, infections, and hemorrhage are also important causes of primary adrenal insufficiency. The largest cohort study from Sudan diagnosed 80 children with adrenal insufficiency. The etiology ranged from Allgrove syndrome (36%), auto-immune polyendocrinopathy syndrome (11%), adrenoleukodystrophy (9 %), bilateral hemorrhage (1%), to unspecified (42%) (5). Case reports and series also reported similar causes such as Allgrove syndrome (6-8), adrenoleukodystrophy (9), to rare causes such as familial primary glucocorticoid deficiency (3), Steroidogenic acute regulatory protein (StAR) deficiency (10), Nuclear receptor subfamily 0, group B, member 1 (NR0B1) gene or DAX1 gene mutation (11) as well as primary multidrug-resistant adrenal tuberculosis (12).


The diagnosis of adrenal insufficiency is made by a peak cortisol value less than 18 mcg/dl on ACTH (Synacthen) stimulation test. A raised plasma ACTH level confirms primary adrenal insufficiency. The dose of Synacthen recommended for children less than 2 years is 15 µg/kg body weight and for children more than 2 years 250 µg im. However, Synacthen is not easily available in many countries. Acton Prolongatum, a long-acting synthetic ACTH preparation of the 39-amino acid native porcine sequence in a carboxymethylcellulose base has been studied and validated in India for the diagnosis of adrenal insufficiency in children > 5 years (13).


Table 1. Acton Prolongatum (ACTH Stimulation) Test

Indication

To diagnose adrenal insufficiency *

Preparation

Injection Acton Prolongatum® Ferring pharmaceuticals (Saint Prex, Switzerland) is available as a 5-mL vial with a concentration of 60 IU/mL.

To prepare 25 IU** of Acton Prolongatum, 0.4 ml of Acton Prolongatum is taken in 1 ml syringe and diluted with 0.5 ml NS

Performing the test

After overnight fast, basal sample for cortisol is taken at 8 AM and 25 IU of Acton Prolongatum is injected intramuscularly over the deltoid.

One hour (9 AM) post stimulation, a second cortisol sample is taken

Interpretation

Peak cortisol (at 60 minutes) <18 mcg/dl: suggestive of adrenal insufficiency (94% specific and 57% sensitive)

Peak cortisol (at 60 minutes) >22 mcg/dl : rules out adrenal insufficiency

 NB: * Test is validated for children above 5 years (13). ** Studies in adults have also been done with 30 IU of Acton Prolongatum (0.5 ml) (95) (96).


Congenital Adrenal Hyperplasia


CAH is a group of autosomal recessive disorders characterized by enzymatic defects in adrenal steroidogenesis and diminished cortisol synthesis. The accumulation of precursors proximal to the blocked pathway and hypocortisolemia are responsible for the clinical features of these disorders. The presentation is varied and includes early classic presentation of salt-wasting (SW) and simple virilizing (SV) disorder to the non-classical presentation. Rare presentations of CAH as adrenal insufficiency (14), genital ambiguity (15) (16), hypoglycemia (17, 18), and precocious puberty (19) due to enzyme defects other than 21 hydroxylase deficiency have also been reported.


Newborn screen (NBS) for CAH from India revealed a prevalence of 1 in 576 (20). However retrospective data in the absence of NBS revealed the presentation of adrenal crisis in >80% of subjects with 70% presenting as SW-CAH and a delayed diagnosis in boys as compared to girls highlighting the importance of NBS (21).


CAH due to 21 hydroxylase deficiency (21OHD) accounts for 90-95% of the cases followed by 11β-hydroxylase deficiency (11βOHD), and 3β-hydroxysteroid dehydrogenase 2 (3βHSD2). Regional differences in the prevalence of enzyme deficiencies confirmed by genetic tests have been described from Cameroon (n=24) which found that 11βOHD was more common (66.6%) followed by 21OHD and as well from Algeria (n=273) which showed that 3βHSD2 (5%) was the second most common form after 21OHD. These differences may be attributed to the founder mutations (22, 23).


Diagnosis is made by screening for 17 OH Progesterone (OHP) which is elevated, followed by 17 OHP and other steroid responses to synacthen test. However, confirmation of specific enzyme deficiency requires genetic testing. The spectrum of genetic mutations has been described in various cohorts for CYP21A2, which was able to diagnose mutations in 80-96% of the subjects, and genotype-phenotype correlations have been established for various forms of CAH (24-27). Additionally, allele-specific PCR for screening common CYP21A2 mutations has been suggested as a cost-effective tool, especially in resource-constraint settings (28). The diagnosis of other enzyme deficiencies is often challenging due to a lack of genetic tests and steroid precursor assays. However, studies are emerging for other CAH variants such as 11βOHD from India (29) and 3β-hydroxysteroid dehydrogenase 2 (3βHSD2) deficiency from Algeria (23) with the discovery of novel mutations indicating genetic heterogeneity. Combined genetic mutations have also been reported (30).


A child diagnosed with CAH requires lifelong treatment and monitoring. A longitudinal data from Egypt indicated that CAH subjects with older age, poor hormonal control, and frequent hospitalizations have relatively poorer health-related quality of life. The challenges faced in the management of CAH include late diagnosis, poor follow-up (31), and the development of adrenal rest tumors (23, 29).


Cushing Syndrome


Cushing syndrome is suspected in a child who presents with weight gain and growth failure. The characteristic cushingoid features described in adults are usually not seen and they often present with generalized obesity. Endogenous Cushing syndrome varies with the age of diagnosis with adrenal tumors predominating in children < 7 years and Cushing disease after 7 years. However, it is important to note that the most common cause of Cushing’s syndrome is exogenous and even topical routes of administration have been implicated in children (32-34).


Of the ACTH-independent Cushing syndrome, primary pigmented nodular adrenocortical disease (PPNAD) has been the most frequently described from the tropics in case series and reports some of which have been found in association with Carney’s complex (35-39). The other important cause reported is in association with Adrenocortical tumors as described below.


Adrenocortical Tumors


These tumors account for 0.2% of all pediatric tumors. The largest case series from India with 17 cases reported that 82% presented with endocrine dysfunction, of which the most common was Cushing syndrome with or without virilization seen in 53% of the subjects (40). Another cohort of 7 children from Sri Lanka also reported peripheral precocious puberty in all the subjects and one boy had the phenotypic features of Beckwith–Wiedemann syndrome (41). Case reports have also reported similar presentations some of which are the rare variants of adrenocortical oncocytoma (42-49). Large non-functioning adrenal cortical carcinoma can present with mass effects without any features (40, 50). The prognosis depends on the diagnosis with adenomas having complete remission. However, the prognosis of subjects with carcinoma was poor (40) (41).


Pheochromocytomas and Paragangliomas


Pheochromocytoma (PCC) refers to the catecholamine-producing tumor of the adrenal medulla whereas paragangliomas (PGL) are extra-adrenal tumors of sympathetic and parasympathetic ganglia. Of the PPGLs, 10-20% occur in the pediatric age group. There is a high rate of germline mutations and heritability in pediatric PPGLs. A cohort of 30 children from India with PPGL showed that 26.7% of the subjects had syndromic or familial association, of which Von Hippel-Lindau was the most common. Fourteen (46.7%) children had germline mutations (VHL 10 (33.3%), SDHB 2 (6.6%), and SDHD 2 (6.6%). Bilateral pheochromocytomas and symptomatic presentation was more frequent in children as compared to adult PPGL. Children with VHL mutation had more frequent bilateral PCC, coexisting PGL and recurrence (51).


PPGLs often mimic other diseases and rare presentations such as myocarditis (52), diabetes insipidus (53), hypertensive encephalopathy (54) (55), Cushing syndrome (56), pseudo renal artery stenosis (57), and papilledema (58) have been described.  

After biochemical confirmation, imaging studies are advised for anatomical localization. Functional imaging is recommended for larger tumors, suspected multifocal or extra adrenal tumors, succinate dehydrogenase subunit B (SDHB) or alpha-thalassemia/mental retardation syndrome X-linked mutations (ATRX) and dopamine secreting PPGLs. A cohort study from India revealed that 68Ga-DOTATATE PET/CT (95%) had a higher sensitivity than 18F-FDG-PET/CT (80%) and 131I-MIBG (65%) for overall lesions. 68Ga-DOTATATE PET/CT was more sensitive than 131I-MIBG (93 vs. 42%) for detecting metastases (59).  The definitive management of PPGL is surgical resection. Pre-operative preparation with experienced anesthetic (60) and surgical team (61) is important for successful outcomes following surgery. The management of metastatic PPGL is challenging especially in countries with limited resources. Fractionated low dose 131 I-metaiodobenzylguanidine (MIBG) therapy has been used in the treatment of metastatic paraganglioma (62). Lifelong surveillance is recommended in children to detect early recurrence (63).


DISORDERS OF SEX DEVELOPMENT (DSD)


DSD is a condition in which chromosomal, gonadal, or anatomical sex is atypical (64). Observational studies from Egypt and Cameroon reported that these constitute 2-9.4% of the subjects presenting to endocrine clinics (65, 66).


Epidemiology


DSDs can be broadly classified into sex chromosomes, 46 XX and 46 XY DSDs. Cohort studies have revealed a prevalence of 5-15 % for sex chromosomal DSDs, 33.7-71% for 46 XY DSD, and 24-51% for 46 XX DSD (65-67). Regional differences were observed in the prevalence of these disorders attributed to consanguinity and endogamous marriages (66).


Table 2. Classification of DSDs

SEX CHROMOSOME DSD

46 XY DSD

46 XX DSD

Turner’s syndrome (and 45X variants)

Disorders of testis development


Complete testicular dysgenesis (Swyer syndrome)

Partial gonadal dysgenesis

Testicular regression

Disorders of ovarian development

Gonadal dysgenesis

Ovotesticular DSD

·         RSPO gene mutation

·         NR5A1 gene mutation

Testicular DSD

·         SRY+

·         SOX9/SOX3 duplication

·         WNT 4 mutation

Klinefelter’s syndrome (and 47XXY variants)

Disorders of androgen synthesis

STAR mutation    

CAH

·         3β-hydroxysteroid dehydrogenase 2

·         17α-hydroxylase/17,20-lyase

·         P450 oxidoreductase

Isolated testosterone deficiency

·         17β-hydroxysteroid dehydrogenase

·         5α-reductase 2

Androgen excess

CAH

·         21-hydroxylase

·         3β-hydroxysteroid dehydrogenase 2

·         P450 oxidoreductase

·         11β-hydroxylase

·         Glucocorticoid receptor mutations


Maternal

·         Virilising tumors

·         Exogenous androgens


Mixed gonadal dysgenesis Ovotesticular DSD

Disorders of androgen action

Androgen insensitivity syndrome

Luteinizing hormone receptor defects

Others

Mullerian agenesis (MRKH syndrome)

Uterine abnormalities

Syndromic associations (cloacal exostrophy)


Others

Persistent mullerian duct syndrome

Complex syndromic disorders

Isolated hypospadias


Clinical Features


DSDs have a varied presentation which includes ambiguous genitalia of varying severity, primary amenorrhea, and virilization at puberty to infertility in adulthood. The recognition of DSDs has critical implications due to their syndromic associations such as Wilm’s tumor and renal failure with Denys-Drash syndrome, adrenal insufficiency with CAH, and future risk of gonadoblastoma. In addition, there are long-term social and psychological impacts such as gender of rearing and fertility prospects. 


46 XY DSD


46 XY DSD can be classified as disorders of testis development, androgen synthesis, or androgen action.


The most common DSD reported among these are disorders of androgen synthesis of which 5 alpha reductase deficiency is the most commonly reported with a prevalence of 10%- 33% with a presentation as ambiguous genitalia (65-68). The higher rates reported in recent literature are attributed to the genetic confirmation some of which are novel and founder mutations, as opposed to the earlier diagnosis based on biochemical ratios of Testosterone: Dihydrotestosterone (69-71). Rare variants of CAH with presentation as infertility, hypertension, or virilization been reported (15, 72-74).


Androgen insensitivity syndrome (AIS); partial (PAIS) or complete (CAIS) is the next most commonly reported 46 XY DSD from various countries with a prevalence of 5-28% (65-67, 75, 76). However, cohort studies with genetic confirmation reported a prevalence of 10-38% (77, 78). A point to be noted was that only 31% of patients with a provisional diagnosis of PAIS had pathogenic variants in the AR gene (78). Patients with CAIS are reared as females and have a later presentation with primary amenorrhea. The presentation of PAIS may be earlier with atypical genitalia or gynecomastia.


The third most commonly reported cause is gonadal dysgenesis which can be partial or complete with a prevalence of 4-10% (65-67, 79), Case reports of gonadal development disorders with dysgenesis are also emerging which include WT-1 mutation (80-82), Desert hedgehog (DHH) gene (83), and Mitogen‐activated protein 3 kinase 1 (MAP3K1) gene (84). 


Other rare causes such as persistent Mullerian duct syndrome (85, 86) and Leydig cell hypoplasia (87) have been reported from the Middle-eastern countries.


Syndromic causes of 46 XY DSD accounts for 1-1.8% of the cohort studies cited earlier.


46 XX DSD


In contrast to the 46 XY DSDs which can have variable presentation and etiology, the most common cause of 46 XX DSD is CAH of which 21 hydroxylase deficiency is the most common cause. However, Sap et al from Cameroon reported 11 hydroxylase was the most common cause of CAH in their population (66). The prevalence of 46 XX DSD ranges from 20%-55% (65-67). 


The other important causes of 46 XX DSD are ovotesticular DSD (16.2%) and vaginal atresia (2%). Rare case reports of aromatase deficiency (88) and isodicentric Y chromosome in 45 X individuals have been reported (89). 


Management


The diagnosis and management of DSDs are challenging, especially in countries with low resources. The most important step in the initial evaluation of ambiguous genitalia is the presence of gonads which gives us a clue in narrowing the cause and guiding further workup. Karyotyping, imaging by pelvic USG or MRI, followed by biochemical evaluation helps in establishing a diagnosis. The emergence of genetic tests has further simplified the evaluation of such patients and will prove to be a valuable tool in the future.


Diagnosis of DSD and gender assignment has lifelong implications for the patients. There have been reports of gender change and gender identity confusion especially in 46 XY DSDs (90-92). However, patients with AIS have less prevalence of gender dysphoria (77, 92).


For 46 XX DSDs with virilization, feminizing genitoplasty is an important concern especially the timing of surgery. An observational study from Malaysia of 59 females with CAH who had undergone feminizing genitoplasty (FG) reported that infancy and early childhood as the best timing for first FG, most preferring single-stage over 2-stage surgery (93).


Data regarding the risk of gonadoblastoma and prophylactic gonadectomy is scarce. A case series of 5 subjects of 46 XY DSD reared as females revealed malignancy in only one patient with CAIS (94).


REFERENCES


  1. Laghari TM, Ibrahim MN, Khoso Z, Hanif MI, Meher-Un-Nisa null, Raza J. Spectrum of Addison’s Disease in Children. J Coll Physicians Surg--Pak JCPSP. 2020 Oct;30(10):1086–9.
  2. Ross IL, Levitt NS. Addison’s disease symptoms--a cross sectional study in urban South Africa. PloS One. 2013;8(1):e53526.
  3. Alsaedi A, Kamal NM, Bakkar A, Althobaiti E, Naeem M, Kamal M. Novel Melano-Cortin-2-Receptor Gene Mutation Presenting With Infantile Cholestasis: A Case Report. Clin Med Insights Case Rep. 2022;15:11795476221091388.
  4. Uyangoda K, Kamalanathan P, Mettananda S. Familial glucocorticoid deficiency presenting with hyperpigmentation, gigantism, and motor development delay: a case report. J Med Case Reports. 2019 Sep 4;13(1):280.
  5. Musa SA, Hassan SS, Ahmed AI, Ngwiri T, Fadlalbari GF, Ibrahim AA, et al. Clinical profile, etiology, and diagnostic challenges of primary adrenal insufficiency in Sudanese children: 14-years’ experience from a resource limited setting. J Pediatr Endocrinol Metab. 2022 Feb 1;35(2):231–7.
  6. Singh K, Puri RD, Bhai P, Arya AD, Chawla G, Saxena R, et al. Clinical heterogeneity and molecular profile of triple A syndrome: a study of seven cases. J Pediatr Endocrinol Metab. 2018 Jul 1;31(7):799–807.
  7. Jayant SS, Gupta R, Agrawal K, Das L, Dutta P, Bhansali A. Triple A (Allgrove) syndrome due to AAAS gene mutation with a rare association of amyotrophy. Horm Athens Greece. 2021 Mar;20(1):197–205.
  8. Yadav P, Kumar D, Bohra GK, Garg MK. Triple A syndrome (Allgrove syndrome) - A journey from clinical symptoms to a syndrome. J Fam Med Prim Care. 2020 May;9(5):2531–4.
  9. Supornsilchai V, Wacharasindhu S, Desudchit T. Adrenal functions in children with adrenoleukodystrophy. J Med Assoc Thail Chotmaihet Thangphaet. 2002 Jun;85 Suppl 1:S286-292.
  10. Achermann JC, Meeks JJ, Jeffs B, Das U, Clayton PE, Brook CGD, et al. Molecular and Structural Analysis of Two Novel STAR Mutations in Patients with Lipoid Congenital Adrenal Hyperplasia. Mol Genet Metab. 2001 Aug 1;73(4):354–7.
  11. Mohan S, Danda S, Mathai S, Simon A. Novel mutation in the nuclear receptor subfamily 0, group B, member 1 (NR0B1) gene associated with intrafamilial heterogeneity in three boys with X-linked adrenal hypoplasia congenita and hypogonadotropic hypogonadism from India. Natl Med J India. 2019 May 1;32:141.
  12. Sharma S, Joshi R, Kalelkar R, Agrawal P. Tuberculous Adrenal Abscess Presenting as Adrenal Insufficiency in a 4-Year-Old Boy. J Trop Pediatr. 2019 Jun 1;65(3):301–4.
  13. Sharma R, Madathil S, Maheshwari V, Roy K, Kumar B, Jain V. Long-acting intramuscular ACTH stimulation test for the diagnosis of secondary adrenal insufficiency in children. J Pediatr Endocrinol Metab. 2019 Jan 28;32(1):57–63.
  14. Sarathi V, Nagalingam C. Normal male external genitalia do not rule out CYP11A1 deficiency. BMJ Case Rep. 2019 Jul;12(7):e228235.
  15. Pant V, Baral S, Shrestha B, Tumbapo A. A child with hypertension and ambiguous genitalia - an uncommon variant of congenital adrenal hyperplasia: a case report. J Med Case Reports. 2017 Jun 23;11(1):168.
  16. Sheikh WH, Asif N, Younas M, Basharat N, Qurat-Ul-Ain  null, Noreen  null. A Child with Ambiguous Genitalia: An Atypical Presentation. J Coll Physicians Surg--Pak JCPSP. 2019 Jun;29(6):S54–5.
  17. Garg M, Chugh V, Dutt Sharma S, Mitharwal P, Mangla A. Non-classical lipoid adrenal hyperplasia presenting as hypoglycemic seizures. J Pediatr Endocrinol Metab JPEM. 2020 Nov 26;33(11):1507–9.
  18. Konar MC, Goswami S, Babu BG, Mallick AK. Hypoglycemia due to 3β-Hydroxysteroid Dehydrogenase type II Deficiency in a Newborn. Indian Pediatr. 2015 Nov;52(11):981–3.
  19. Majumder S, Chakraborty PP, Ghosh PC, Bera M. Differentiating 11β-hydroxylase deficiency from primary glucocorticoid resistance syndrome in male precocity: real challenge in low-income countries. BMJ Case Rep. 2020 Feb 28;13(2):e233722.
  20. ICMR Task Force on Inherited Metabolic Disorders. Newborn Screening for Congenital Hypothyroidism and Congenital Adrenal Hyperplasia. Indian J Pediatr. 2018 Nov;85(11):935–40.
  21. Seneviratne SN, Sandakelum U, Jayawardena CH, Weerasinghe AM, Wickramarachchi PS, Silva S de. Presenting status of children with classical congenital adrenal hyperplasia over two decades (1999–2018) in the absence of newborn screening in Sri Lanka. J Pediatr Endocrinol Metab. 2021 Sep 1;34(9):1131–7.
  22. Um SSN, Betoko RM, Mekone I, Chetcha AB, Tardy V, Dahoun S, et al. Clinical, biochemical, and biomolecular aspects of congenital adrenal hyperplasia in a group of Cameroonian children and adolescents. J Pediatr Endocrinol Metab. 2022 Jun 1;35(6):777–83.
  23. Ladjouze A, Donaldson M, Plotton I, Djenane N, Mohammedi K, Tardy-Guidollet V, et al. Genotype, Mortality, Morbidity, and Outcomes of 3β-Hydroxysteroid Dehydrogenase Deficiency in Algeria. Front Endocrinol. 2022 Jun 10;13:867073.
  24. Khan AH, Nasir MI, Moatter T. Characterization of pathogenic mutations in 21-hydroxylase gene of Pakistani patients with congenital adrenal hyperplasia and their family members--a preliminary report. JPMA J Pak Med Assoc. 2002 Jul;52(7):287–91.
  25. Ganesh R, Suresh N, Janakiraman L, Ravikumar K. CYP21A2 gene mutation in South Indian children with congenital adrenal hyperplasia. Indian Pediatr. 2015 Aug;52(8):710–1.
  26. Khajuria R, Walia R, Bhansali A, Prasad R. The spectrum of CYP21A2 mutations in Congenital Adrenal Hyperplasia in an Indian cohort. Clin Chim Acta. 2017 Jan;464:189–94.
  27. Essawi M, Mazen I, Fawaz L, Hassan H, ElBagoury N, Peter M, et al. Assessment of the most common CYP21A2 point mutations in a cohort of congenital adrenal hyperplasia patients from Egypt. J Pediatr Endocrinol Metab JPEM. 2020 Jul 28;33(7):893–900.
  28. Ravichandran L, Korula S, Asha HS, Varghese D, Parthiban R  null, Johnson J, et al. Allele-specific PCR and Next-generation sequencing based genetic screening for Congenital Adrenal Hyperplasia in India. Eur J Med Genet. 2021 Dec;64(12):104369.
  29. Karlekar MP, Sarathi V, Lila A, Rai K, Arya S, Bhandare VV, et al. Expanding genetic spectrum and discriminatory role of steroid profiling by LC-MS/MS in 11β-hydroxylase deficiency. Clin Endocrinol (Oxf). 2021 Apr;94(4):533–43.
  30. Aljabri A, Alnaim F, Alsaleh Y. Combined homozygous 21 hydroxylase with heterozygous P450 oxidoreductase mutation in a Saudi boy presented with hypertension. BMJ Case Rep. 2020 Sep 29;13(9):e233942.
  31. Maiti A, Chatterjee S. Congenital adrenal hyperplasia: An Indian experience: Congenital adrenal hyperplasia Indian series. J Paediatr Child Health. 2011 Dec;47(12):883–7.
  32. Alkhuder L, Mawlawi H. Infantile Iatrogenic Cushing Syndrome due to Topical Steroids. Case Rep Pediatr. 2019 Dec 2;2019:2652961.
  33. Oluwayemi IO, Oduwole AO, Oyenusi E, Onyiriuka AN, Abdullahi M, Fakeye-Udeogu OB, et al. Iatrogenic Cushing’s syndrome in children following nasal steroid. Pan Afr Med J. 2014;17:237.
  34. Dutta D, KS S, Ghosh S, Mukhopadhyay S, Chowdhury S. Iatrogenic Cushing’s Syndrome Following Short-Term Intranasal Steroid Use. J Clin Res Pediatr Endocrinol. 2012 Sep;4(3):157–9.
  35. Jeyaraman K, Jyotsna VP, Ammini AC. A Child with Cushing’s Syndrome – Etiological Clue from Adrenal Imaging (Pediatric Cushing’s Syndrome). J Pediatr Endocrinol Metab [Internet]. 2010 Jan [cited 2023 May 5];23(12). Available from: https://www.degruyter.com/document/doi/10.1515/jpem.2010.195/html
  36. Patarakijvanich N, Kayasut K, Mitarnun W, Pathrapinyokul S, Ayudya SSN. Primary pigmented nodular adrenocortical disease with synaptophysin immunoreactivity in two thai children. J Med Assoc Thail Chotmaihet Thangphaet. 2007 Jun;90(6):1208–13.
  37. Memon SS, Thakkar K, Patil V, Jadhav S, Lila AR, Fernandes G, et al. Primary pigmented nodular adrenocortical disease (PPNAD): single centre experience. J Pediatr Endocrinol Metab. 2019 Apr 1;32(4):391–7.
  38. Alruwaili TK, Alkanhal KI, AlShoomi AM, Almanie DA, Alahmed MH. A 14-Year-Old Saudi Boy with Gynecomastia, Cushing Syndrome, Large-Cell Calcifying Sertoli Cell Tumor of the Testis, and Carney Complex. Am J Case Rep. 2022 Dec 27;23:e937404.
  39. Oza CM, Mehta S, Khadilkar V, Khadilkar A. Primary pigmented nodular adrenal disease presenting as hypertensive crisis. BMJ Case Rep. 2022 Jun 1;15(6):e250023.
  40. Das S, Sengupta M, Islam N, Roy P, Datta C, Mishra PK, et al. Weineke criteria, Ki-67 index and p53 status to study pediatric adrenocortical tumors: Is there a correlation? J Pediatr Surg. 2016 Nov;51(11):1795–800.
  41. Naotunna NPGCR, Siriwardana HVDN, Lakmini BC, Gamage DS, Gunarathna S, Samarasinghe M, et al. Adrenocortical tumors in children: Sri Lankan experience from a single center, and a mini review. J Med Case Reports. 2023 Apr 13;17:137.
  42. Regmi N, Al-Nahian S. A rare form of Cushing’s syndrome in a 10 year old child. J Nepal Health Res Counc. 2013 Sep;11(25):296–9.
  43. Al Badi MK, Al-Alwan I, Al-Dubayee M, Al-Anzi A, Al Turki MS, Aloudah N, et al. Testosterone- and Cortisol-secreting Oncocytic Adrenocortical Adenoma in the Pediatric Age-group. Pediatr Dev Pathol Off J Soc Pediatr Pathol Paediatr Pathol Soc. 2018;21(6):568–73.
  44. Narayanan N, Kamalanathan S, Sahoo J, Naik D, Kumaravel S, Ganesh RN. Pediatric Adrenocortical Oncocytoma presenting as Cushing’s Syndrome and Peripheral Precocious Puberty: A Case Report and Review of Literature. J ASEAN Fed Endocr Soc. 2021;36(2):205–8.
  45. Mittal A, Aggarwal M, Debata P. Large adrenocortical carcinoma presenting as an adenoma with precocious puberty. Indian J Pediatr. 2012 Jun;79(6):820–1.
  46. Pal DK, Kundu AK, Chakrabortty S, Das S. Virilising adrenocortical carcinoma. J Indian Med Assoc. 2002 Apr;100(4):251–2.
  47. Subbiah S, Nahar U, Samujh R, Bhansali A. Heterosexual precocity: rare manifestation of virilizing adrenocortical oncocytoma. Ann Saudi Med. 2013;33(3):294–7.
  48. Kanjilal B, Ghosh M, Mitra A, Kar S, Bisht J, Das RN, et al. Cytological diagnosis of adrenocortical carcinoma: A report of 2 cases in children. Diagn Cytopathol. 2018 Dec;46(12):1064–7.
  49. Verma S, Mandelia A, Jain M, Bhatia V, Lal H. Feminizing adrenocortical oncocytoma presenting as precocious puberty: a case report and literature review. J Pediatr Endocrinol Metab JPEM. 2022 Jun 27;35(6):827–30.
  50. Mirsharifi A, Vasei M, Sadeghian E, Ghorbani-Abdehgah A, Naybandi Atashi S. Extra-adrenal, non-functional adrenocortical carcinoma presenting with acute abdomen: a case report. J Med Case Reports. 2020 Jul 8;14(1):107.
  51. Khadilkar K, Sarathi V, Kasaliwal R, Pandit R, Goroshi M, Shivane V, et al. Genotype-phenotype correlation in paediatric pheochromocytoma and paraganglioma: a single centre experience from India. J Pediatr Endocrinol Metab JPEM. 2017 May 1;30(5):575–81.
  52. Molaei A, Abarzadeh-Bairami V, Sadat-Ebrahimi SR. A case of pheochromocytoma presenting with cardiac manifestation: case report. BMC Pediatr. 2020 Jun 17;20(1):299.
  53. Jain V, Yadav J, Satapathy AK. Pheochromocytoma presenting as diabetes insipidus. Indian Pediatr. 2013 Nov 8;50(11):1056–7.
  54. Aftab S, Yasmeen T, Hamid MH, Sarwar M, Sipra H, Qureshi A, et al. Pheochromocytoma: a rare cause of childhood hypertensive encephalopathy. J Coll Physicians Surg--Pak JCPSP. 2012 Aug;22(8):536–8.
  55. Yeung L, Kwan E, Cheung P, Low L. Phaeochromocytoma in children.
  56. Kumar M, Kumar V, Talukdar B, Mohta A, Khurana N. Cushing syndrome in an infant due to cortisol secreting adrenal pheochromocytoma: a rare association. J Pediatr Endocrinol Metab JPEM. 2010 Jun;23(6):621–5.
  57. Vaze D, Trehan A, Saxena A, Joshi K, Narasimhan KL. Extraadrenal Pheochromocytoma With Renal Artery “Pseudostenosis”—An Important Pitfall. Urology. 2012 Oct;80(4):925–7.
  58. Ba-Abbad RA, Nowilaty SR. Bilateral Optic Disc Swelling as the Presenting Sign of Pheochromocytoma in a Child. Medscape J Med. 2008 Jul 29;10(7):176.
  59. Jaiswal SK, Sarathi V, Malhotra G, Hira P, Shah R, Patil VA, et al. The utility of 68Ga-DOTATATE PET/CT in localizing primary/metastatic pheochromocytoma and paraganglioma in children and adolescents - a single-center experience. J Pediatr Endocrinol Metab JPEM. 2021 Jan 27;34(1):109–19.
  60. Maurya RG, Gautam S, Singh GP, Srinivas C. Anaesthetic challenges in perioperative management of thoracic paraganglioma in an 8-year-old child. BMJ Case Rep. 2021 Aug;14(8):e243521.
  61. Singh J, Rana SS, Sharma R, Ghai B, Puri GD. A rare cause of hypertension in children: intrathoracic pheochromocytoma. Pediatr Surg Int. 2008 Jul;24(7):865–7.
  62. Basu S, Nair N. Stable disease and improved health-related quality of life (HRQoL) following fractionated low dose 131I-metaiodobenzylguanidine (MIBG) therapy in metastatic paediatric paraganglioma: observation on false “reverse” discordance during pre-therapy work up and its implication for patient selection for high dose targeted therapy. Br J Radiol. 2006 Aug;79(944):e53-58.
  63. Jain V, Bishnoi A, Meena K, Aggarwal V, Chadha R, Puri A, et al. Metachronous occurrence of multifocal phaeochromocytoma. Indian J Pediatr. 2011 May;78(5):620–2.
  64. Hughes IA, Houk C, Ahmed SF, Lee PA, LWPES Consensus Group, ESPE Consensus Group. Consensus statement on management of intersex disorders. Arch Dis Child. 2006 Jul;91(7):554–63.
  65. Shamma RA, Atef S, Arafa N. Etiological classification and clinical spectrum of Egyptian pediatric patients with disorder of sex development, single center experience. Endokrynol Pol. 2021;72(5):558–65.
  66. Sap SNU, Mbono Betoko R, Etoa Etoga M, Mure PY, Morel Y, Dahoun S, et al. Observational study of disorders of sex development in Yaounde, Cameroon. J Pediatr Endocrinol Metab JPEM. 2020 Mar 26;33(3):417–23.
  67. Joshi RR, Rao S, Desai M. Etiology and clinical profile of ambiguous genitalia an overview of 10 years experience. Indian Pediatr. 2006 Nov;43(11):974–9.
  68. Di Marco C, Bulotta AL, Varetti C, Dosa L, Michelucci A, Baldinotti F, et al. Ambiguous external genitalia due to defect of 5-α-reductase in seven Iraqi patients: prevalence of a novel mutation. Gene. 2013 Sep 10;526(2):490–3.
  69. Kumar A, Sharma R, Faruq M, Suroliya V, Kumar M, Sharma S, et al. Spectrum of Pathogenic Variants in SRD5A2 in Indian Children with 46,XY Disorders of Sex Development and Clinically Suspected Steroid 5α-Reductase 2 Deficiency. Sex Dev. 2019;13(5–6):228–39.
  70. Arya S, Tiwari A, Lila AR, Sarathi V, Bhandare VV, Kumbhar BV, et al. Homozygous p.Val89Leu plays an important pathogenic role in 5α-reductase type 2 deficiency patients with homozygous p.Arg246Gln in SRD5A2. Eur J Endocrinol. 2020 Sep;183(3):275–84.
  71. Rafigh M, Salmaninejad A, Sorouri Khorashad B, Arabi A, Milanizadeh S, Hiradfar M, et al. Novel Deleterious Mutation in Steroid-5α-Reductase-2 in 46, XY Disorders of Sex Development: Case Report Study. Fetal Pediatr Pathol. 2022 Feb;41(1):141–8.
  72. Afsar J, Kachuei A, Hashemipour M, Larki-Harchegani A, Shabib S. A rare enzymatic defect, true isolated 17,20-lyase deficiency leading to endocrine disorders and infertility: case report. Gynecol Endocrinol Off J Int Soc Gynecol Endocrinol. 2020 Apr;36(4):297–302.
  73. Omrani MD, Adamovic T, Grandell U, Saleh-Gargari S, Nordenskjöld A. 17-β-hydroxysteroid dehydrogenase type 3 deficiency in three adult Iranian siblings. Sex Dev Genet Mol Biol Evol Endocrinol Embryol Pathol Sex Determ Differ. 2011;5(6):273–6.
  74. Maheshwari M, Arya S, Lila AR, Sarathi V, Barnabas R, Rai K, et al. 17α-Hydroxylase/17,20-Lyase Deficiency in 46,XY: Our Experience and Review of Literature. J Endocr Soc. 2022 Jan 29;6(3):bvac011.
  75. Vasu VR, Saranya B, Jayashankar M, Munirajan AK, Santhiya ST. A novel splice site and two known mutations of androgen receptor gene in sex-reversed XY phenotype. Genet Test Mol Biomark. 2012 Jul;16(7):749–55.
  76. Gad YZ, Mazen I, Lumbroso S, Temtamy SA, Sultan C. A novel point mutation of the androgen receptor (F804L) in an Egyptian newborn with complete androgen insensitivity associated with congenital glaucoma and hypertrophic pyloric stenosis. Clin Genet. 2003 Jan;63(1):59–63.
  77. Arya S, Barnabas R, Lila AR, Sarathi V, Memon SS, Bhandare VV, et al. Clinical, Hormonal, Genetic, and Molecular Characteristics in Androgen Insensitivity Syndrome in an Asian Indian Cohort from a Single Centre in Western India. Sex Dev Genet Mol Biol Evol Endocrinol Embryol Pathol Sex Determ Differ. 2021;15(4):253–61.
  78. Kumar A, Sharma R, Faruq M, Kumar M, Sharma S, Werner R, et al. Clinical, Biochemical, and Molecular Characterization of Indian Children with Clinically Suspected Androgen Insensitivity Syndrome. Sex Dev Genet Mol Biol Evol Endocrinol Embryol Pathol Sex Determ Differ. 2022;16(1):34–45.
  79. Correya MA, Babu R, Archana B, Ravirajendiran S. Disorders of sexual differentiation: Report of two rare cases. Indian J Pathol Microbiol. 2021;64(2):390–3.
  80. Arya S, Kumar S, Lila AR, Sarathi V, Memon SS, Barnabas R, et al. Exonic WT1 pathogenic variants in 46,XY DSD associated with gonadoblastoma. Endocr Connect. 2021 Dec 1;10(12):1522–30.
  81. Mazen I, Hassan H, Kamel A, Mekkawy M, McElreavey K, Essawi M. WT1 Gene Mutation, p.R462W, in a 46,XY DSD Patient from Egypt with Gonadoblastoma and Review of the Literature. Sex Dev Genet Mol Biol Evol Endocrinol Embryol Pathol Sex Determ Differ. 2017;11(5–6):280–3.
  82. Wongwaisayawan S, Boonpucknavig V, Boonpucknavig S, Hattirat P. Wilms’ tumor, male pseudohermaphroditism and glomerulonephritis: the Drash syndrome. First case report in Thailand and review the literatures. J Med Assoc Thail Chotmaihet Thangphaet. 1992 Jan;75 Suppl 1:147–52.
  83. Das DK, Sanghavi D, Gawde H, Idicula-Thomas S, Vasudevan L. Novel homozygous mutations in Desert hedgehog gene in patients with 46,XY complete gonadal dysgenesis and prediction of its structural and functional implications by computational methods. Eur J Med Genet. 2011;54(6):e529-534.
  84. Al Shamsi A, Al Hassani N, Hamchou M, Almazrouei R, Mhanni A. A novel missense heterozygous mutation in MAP3K1 gene causes 46, XY disorder of sex development: case report and literature review. Mol Genet Genomic Med. 2020 Sep 28;8(11):e1514.
  85. Mazen I, El-Gammal M, McElreavey K, Elaidy A, Abdel-Hamid MS. Novel AMH and AMHR2 Mutations in Two Egyptian Families with Persistent Müllerian Duct Syndrome. Sex Dev Genet Mol Biol Evol Endocrinol Embryol Pathol Sex Determ Differ. 2017;11(1):29–33.
  86. Farag TI. Familial persistent Müllerian Duct syndrome in Kuwait and neighboring populations. Am J Med Genet. 1993 Sep 1;47(3):432–4.
  87. Hassan HA, Essawi ML, Mekkawy MK, Mazen I. Novel mutations of the LHCGR gene in two families with 46,XY DSD causing Leydig cell hypoplasia I. Horm Athens Greece. 2020 Dec;19(4):573–9.
  88. Mazen I, McElreavey K, Elaidy A, Kamel AK, Abdel-Hamid MS. Aromatase Deficiency due to a Homozygous CYP19A1 Mutation in a 46,XX Egyptian Patient with Ambiguous Genitalia. Sex Dev Genet Mol Biol Evol Endocrinol Embryol Pathol Sex Determ Differ. 2017;11(5–6):275–9.
  89. Mekkawy M, Kamel A, El-Ruby M, Mohamed A, Essawi M, Soliman H, et al. Isodicentric Y chromosomes in Egyptian patients with disorders of sex development (DSD). Am J Med Genet A. 2012 Jul;158A(7):1594–603.
  90. Praveen EP, Desai AK, Khurana ML, Philip J, Eunice M, Khadgawat R, et al. Gender identity of children and young adults with 5alpha-reductase deficiency. J Pediatr Endocrinol Metab JPEM. 2008 Feb;21(2):173–9.
  91. Ediati A, Juniarto AZ, Birnie E, Drop SLS, Faradz SMH, Dessens AB. Gender Development in Indonesian Children, Adolescents, and Adults with Disorders of Sex Development. Arch Sex Behav. 2015 Jul;44(5):1339–61.
  92. Khorashad BS, Roshan GM, Reid AG, Aghili Z, Moghadam MD, Khazai B, et al. Childhood Sex-Typed Behavior and Gender Change in Individuals with 46,XY and 46,XX Disorders of Sex Development: An Iranian Multicenter Study. Arch Sex Behav. 2018 Nov;47(8):2287–98.
  93. Zainuddin AA, Grover SR, Soon CH, Ghani NAA, Mahdy ZA, Manaf MRA, et al. A Multicenter Cross-Sectional Study of Malaysian Females With Congenital Adrenal Hyperplasia: Their Body Image and Their Perspectives on Feminizing Surgery. J Pediatr Adolesc Gynecol. 2020 Oct;33(5):477–83.
  94. Basri NI, Soon CH, Ali A, Abdul Ghani NA, Zainuddin AA. Prophylactic gonadectomy in 46 XY females; why, where and when? Horm Mol Biol Clin Investig. 2021 Sep 24;42(3):325–8.
  95. Nair A, Jayakumari C, George GS, Jabbar PK, Das DV, Jessy SJ, et al. Long acting porcine sequence ACTH in the diagnosis of adrenal insufficiency. Eur J Endocrinol. 2019 Dec;181(6):639–45.
  96. Inder WJ. Long-acting porcine sequence ACTH in the diagnosis of adrenal insufficiency: a cost-effective alternative to the ACTH1-24 test. Eur J Endocrinol. 2020 Feb;182(2):C5–7.


Combined Dyslipidemia in Children and Adolescents

ABSTRACT


Combined dyslipidemia (CD) is now the predominant hyperlipidemic pattern in childhood, characterized by moderate to severe elevation in triglycerides (TG) and non-high-density lipoprotein cholesterol (non-HDL-C) with reduced high-density lipoprotein cholesterol (HDL-C).  In youth, CD occurs almost exclusively with obesity and is highly prevalent, seen in 30-60% of obese adolescents. With nuclear magnetic resonance spectroscopy, the CD pattern is represented as increased small, dense LDL and overall LDL particle number and decreased total HDL-C and large HDL particles, a highly atherogenic pattern. CD in childhood is associated with pathologic evidence of atherosclerosis and ultrasound findings of vascular dysfunction in children, adolescents, and young adults; it is also predictive of early clinical cardiovascular events in adult life. CD is strongly associated with visceral adiposity, insulin resistance, non-alcoholic fatty liver disease (NAFLD), and the metabolic syndrome, suggesting an underlying, integrated pathophysiologic response to excessive weight gain. In almost all cases, CD responds well to lifestyle intervention including weight loss, changes in dietary composition, and increased physical activity. Evidence-based recommendations for management of CD are provided. Rarely, drug therapy is needed and the evidence for drug treatment of CD in childhood is reviewed.


DEFINITION, ATHEROGENICITY, AND PREVALENCE


The pediatric obesity epidemic has resulted in a large population of children and adolescents with secondary combined dyslipidemia (CD). This is now the predominant hyperlipidemic pattern in childhood, characterized by moderate to severe elevation in triglycerides (TG) and non-high-density lipoprotein cholesterol (non-HDL-C) with reduced high-density lipoprotein cholesterol (HDL-C) (1).


Analysis by nuclear magnetic resonance spectroscopy (NMR) shows that the combined dyslipidemia pattern on standard lipid profile is represented at the lipid subpopulation level as increased small, dense LDL and LDL particle number with decreased total HDL-C and large HDL particles (2,3,4). High LDL particle number and elevated small, dense LDL particles have each been shown to predict clinical cardiovascular disease (5-11). The atherogenicity of this lipid sub-population pattern is complex and includes the high concentration of circulating LDL particles, decreased binding of small, dense LDL particles to the LDL receptor, prolonged residence time in plasma and therefore prolonged arterial wall exposure, greater binding of small, dense LDL particles to arterial wall proteoglycans, and increased susceptibility to oxidation (12-18). Consistent with these findings, genetic evidence from mutational analyses, genome-wide association studies, and Mendelian randomization studies indicates that triglycerides and triglyceride-rich lipoproteins are an important source of increased small, dense LDL particle populations. The combined dyslipidemia pattern on traditional lipid profile analysis identifies the atherogenic pattern on lipid sub-population analysis.


Obesity is highly prevalent, affecting 18.5% of all-American youth and 20.6% in adolescents based on NHANES data from 2015-2016; up to 85% of overweight adolescents become obese adults (19,20). In the short term, 50% of obese adolescents have at least one, and 10% have 3 or more cardiovascular risk factors, including combined dyslipidemia, hypertension, and insulin resistance (21,22). In the long term, childhood obesity predicts type 2 diabetes mellitus, premature cardiovascular disease (CVD), and early mortality (23).  NHANES data from 1999-2006 indicated CD was highly prevalent in obese youth, present in more than 40% of adolescents with body mass index (BMI) >95th%ile (24). A 2019 analysis of trends in fasting serum lipids using NHANES data from 1999-2000 to 2015-2016 in US adolescents aged 12 to 19 years showed significant favorable changes in mean levels of all lipid parameters for the sample population as a whole. By contrast, when analyzed by BMI category, obese adolescents showed no significant trend towards improvement in mean HDL-C or LDL-C levels. Although there was a trend towards improvement among obese subjects in total cholesterol, TGs, and non-HDL-C, the prevalence of adverse levels in the last survey in 2015-2016 remained high: 22.3% for TGs, 29% for HDL-C and 10% for LDL-C (25). In cross-sectional data from multiple populations, 30 to 60% of obese youth have elevated TGs, usually associated with reduced HDL-C (26-28). The prevalence of CD increases as obesity severity increases (29-31).  


In addition, selected second generation antipsychotic medications, increasingly prescribed in pediatric patients, are associated with severe weight gain and significant increases in triglycerides and reductions in HDL-C (32,33). Thus, CD is a prevalent and important problem.


LIPID PROFILE MEASURES


Normal lipid values in childhood are shown in Table 1 (1). In children younger than 10 years, the 95th%ile for TG is 100 mg/dL and at 10-18 years, the 95th%ile is 130 mg/dL. Normal non-HDL-C levels are <145 mg/dL. HDL-C averages 55 mg/dL in males and females before puberty, after which mean HDL-C drops to a mean of 45 mg/dL in males. The diagnosis of CD requires that the average of a least 2 measurements of TG and/or non-HDL-C fall above the 95th%ile, plus HDL-C at or below the 5th%ile. TC and LDL-C levels may also be mildly elevated. In the typical lipid profile of a child or adolescent with CD, TG levels are between 150 and 400 mg/dL, HDL-C is < 40mg/dL, non-HDL-C is >145 mg/dL and TG/HDL-C ratio exceeds 3 in whites and 2.5 in blacks.


Table 1.  Acceptable, Borderline, and High Plasma Lipid and Lipoprotein Concentrations (mg/dL) for Children and Adolescents* (1)

Category

Acceptable

Borderline

High

TC

< 170

170-199

> 200

LDL-C

< 110

110-129

> 130

Non-HDL-C

< 120

120-144

> 145

Triglycerides

0-9 years

< 75

75-99

> 100

10-19 years

< 90

90-129

> 130

Category    

Acceptable    

Borderline

Low

HDL-C

>45

40-45

<40

NOTE: Values given are in mg/dL; to convert to SI units, divide the results for TC, LDL-C, HDL-C and non-HDL-C by 38.6; for TG, divide by 88.6.

* Values for plasma lipid and lipoprotein levels are from the 2011 NHLBI Expert Panel Guidelines (1). The cut points for high and borderline high represent the 95th and 75th percentiles, respectively. The low-cut point for HDL-C represents the 10th percentile.

www.nhlbi.nih.gov/guidelines/cvd_ped/index.htm.


In addition to the standard lipid profile measures, non-HDL-C and the TG/HDL-C ratio are useful measures in patients being evaluated for CD. Non-HDL-C is a measure of the cholesterol content of all the plasma atherogenic lipoproteins. TC and HDL-C can be measured accurately in the non-fasting state with non-HDL-C calculated by subtracting HDL-C from TC (1). Epidemiologic studies show that childhood non-HDL-C correlates well with adult levels, independent of baseline BMI and BMI change (34). In autopsy studies in children, adolescents and young adults, non-HDL-C and HDL-C levels were the best lipid predictors of pathologic atherosclerotic lesions, better than any other lipid measure (35). Non-HDL-C measured in childhood was a significant predictor of subclinical atherosclerosis in adulthood, assessed by higher carotid intima media thickness (cIMT) measurements (36). In adults, non-HDL-C has been shown to be the best independent lipid predictor of cardiovascular disease events (37,38).  Normative values for non-HDL-C are included in the 2011 NHLBI pediatric guidelines which recommend this measure for population screening (1) (Table 1).


The TG/HDL-C ratio is a strong predictor of coronary disease extent in adults and is considered to be a surrogate index of the atherogenicity of the plasma lipid profile (39,40). In children, an elevated TG/HDL-C ratio correlates with insulin resistance and with non-alcoholic fatty liver disease (41-43). In a study of normal weight, overweight, and obese white children and adolescents, top tertile TG/HDL-C correlated significantly with increased cIMT in multivariate analysis (43). There are ethnic differences in lipid measures which manifest during adolescence: African-Americans have significantly lower triglycerides and higher HDL-C levels and this impacts non-HDL-C and the TG/HDL-C ratio (44-47). In a study of obese black and white adolescents, TG/HDL-C and non-HDL-C were surrogate markers for elevated small dense lipoprotein particles on NMR spectroscopic analysis (48). A TG/HDL-C ratio above 3 and non-HDL-C above 120 mg/dL in white subjects, and TG/HDL-C ratio above 2.5 and non-HDL-C levels above 145 mg/dL in black subjects were the best lipid predictors of LDL-C particle concentration (48). The HEALTHY study characterized lipids in a large, diverse population of sixth grade children and found that 33% of overweight/obese children had an elevated TG/HDL-C ratio and 11.2% had an elevated non-HDL-C (49). NMR spectroscopy confirmed that the CD findings on standard lipid profile identified the lipid subpopulation pattern of increased total and small, dense LDL particles (50).


GENETIC ASPECTS OF COMBINED DYSLIPIDEMIA


In the literature, the terminology describing combined dyslipidemia also includes “mixed dyslipidemia” and “atherogenic dyslipidemia” (51,52). Combined dyslipidemia is the term used most commonly in pediatrics (53). There is overlap in the lipid phenotype between CD and familial combined hyperlipidemia (FCHL), which was originally considered to be a genetically discrete entity (54,55). However, current evidence suggests that FCHL is a multigenic dyslipidemia with variable expression in different pedigrees (56,57). There is well-established familial aggregation of the combined dyslipidemia phenotype in pediatric and adult studies, beyond the historic studies of FCHL (58,59).  Emerging evidence from gene sequencing studies suggests that variants in the genes controlling TG metabolism, particularly those encoding lipoprotein lipase, may be important factors in the expression of hypertriglyceridemia and combined dyslipidemia (59,60). As with CD, the mechanism of increased CVD risk in FCHL is the presence of increased numbers of apolipoprotein B-containing particles, particularly small, dense LDL particles, so genetic analysis is not critical for patient management at this time (61,62).  


EVIDENCE FOR ACCELERATED ATHEROSCLEROSIS WITH COMBINED DYSLIPIDEMIA


An important initiating step in atherosclerosis is subendothelial retention of LDL-containing lipoproteins (63). Combined dyslipidemia is highly atherogenic because its sub-population composition with increased LDL particles and small dense LDL is associated with facilitated sub-endothelial retention by multiple mechanisms (12-18). Consistent with these findings, recent genetic evidence from mutational analyses, genome-wide association studies, and Mendelian randomization studies indicates that triglycerides and triglyceride-rich lipoproteins are an important source of increased small, dense LDL particle populations. In childhood, the atherogenicity of combined dyslipidemia is seen in anatomic and histologic changes at autopsy and with structural and functional vascular changes in vivo. CD in childhood is also predictive of accelerated atherosclerosis and of early cardiovascular events in adult life. In both the Pathobiological Determinants of Atherosclerosis in Youth Study and the Bogalusa Heart Study, high non-HDL-C and low HDL-C were strongly associated with autopsy evidence of premature atherosclerosis (64-66). Obese youth with elevations in TG and low HDL-C had thicker CIMT, higher pulse wave velocity (PWV), and increased carotid artery stiffness (67-69). A strong association between higher TG/HDL-C ratio, higher non-HDL-C, and higher PWV in both lean and obese children has been demonstrated after adjustment for other CVD risk factors (70). CD identified in childhood is associated with atherosclerotic vascular change measured in adulthood by CIMT and PWV (71-73). Most importantly, in the long-term Princeton Follow-up Study, elevated TG and TG/HDL-C ratio at a mean age of 12 years predicted clinical cardiovascular events at late follow-up 3 to 4 decades later (74,75). This is the first childhood lipid parameter shown to be associated with premature clinical cardiovascular disease. Thus, the combined dyslipidemia pattern seen with obesity in childhood and adolescence identifies pathologic evidence of atherosclerosis and vascular dysfunction in adolescence and young adulthood, and predicts early clinical events in adult life.


While evidence like this in pediatrics strongly supported the importance of high triglycerides/ combined dyslipidemia in the development of atherosclerotic vascular change and subsequent premature cardiovascular clinical cardiovascular disease, LDL-C has been the principal, long-time focus for investigation and management in adult atherosclerosis. Since the time this chapter was first developed in 2016, a flurry of studies in adults have addressed the importance of hypertriglyceridemia – the “neglected major cardiovascular risk factor” – in atherogenesis (76). These include epidemiologic studies which identify high serum TGs as a marker for TG-rich lipoproteins, now recognized as strong, independent predictors of ASCVD and all-cause mortality; Mendelian randomization studies which identify TG-rich lipoproteins as causally associated with ASCVD and all-cause mortality; and intervention trials identifying high TGs and non-HDL-C as the mediators of residual atherosclerotic risk when LDL-C levels are below prescribed targets (77-80). Unfortunately, as discussed in other Endotext chapters, recent randomized trials using triglyceride lowering drugs have failed to demonstrate a decrease in atherosclerotic cardiovascular events in adults.


PATHOPHYSIOLOGIC ASSOCIATIONS


There is a tight connection between CD and obesity, visceral adiposity, insulin resistance, non-alcoholic fatty liver disease (NAFLD), and the metabolic syndrome.


Obesity


The association between CD and obesity is strong and consistent with CD seen in 20 to 60% of obese youth (25-27). The prevalence of CD increases as obesity severity increases (28-30). In multiple studies, excessive intake of sugars, particularly fructose, has been associated with obesity and with combined dyslipidemia in children and adults (81-87). By contrast, low sugar intake is associated with higher HDL in females during adolescence (88).


Visceral Adiposity   


There is a close correlation between CD and abdominal obesity. In susceptible individuals with an underlying racial/ethnic/familial/genetic predisposition, excessive weight gain occurs disproportionately as visceral fat (VAT). This is thought to reflect the inability of the subcutaneous adipose tissue depot to expand, resulting in ectopic fat deposition, primarily in the viscera but also in the liver, heart, and skeletal muscle (89,90). Based on correlation with dual-energy x-ray absorptiometry, waist circumference (WC) is an effective measure of abdominal obesity in youth, with WC above the 90th %ile for age and sex strongly predicting high TGs, reduced HDL-C, and hyperinsulinemia (91,92). Using NHANES norms for WC, the prevalence of abdominal obesity increased more than 65% in boys and girls aged 2 to 19 years between 1988-1994 and 1999-2004 (93,94). From NHANES survey results in 5- to 18-year-olds from 1999 to 2008, waist/height ratio (WHtR), another measure of central adiposity, was integrated with BMI percentiles and measures of cardiometabolic risk: obese subjects with normal WHtR < 0.5 had cardiometabolic risk similar to subjects with normal BMI percentiles, while increasing WHtR was significantly associated with dyslipidemia, insulin resistance and the metabolic syndrome (95).


There are known racial/ethnic differences in the tendency to develop visceral adiposity with Hispanic, Native-American, and Asian populations at elevated risk (96). Especially in Asians, increased VAT can develop in the absence of any other measure of adiposity and this is associated with hypertriglyceridemia, CD, insulin resistance, and type 2 diabetes (T2DM) (97), VAT contributes directly to high TGs because delivery of FFAs to the liver via the portal vein is proportionate to visceral fat mass. Progression of VAT correlates significantly with development of CD (98)


Insulin Resistance and Type 2 Diabetes  


Insulin resistance is considered a primary abnormality in development of CD and associated cardiovascular disease. Obesity correlates with hyperinsulinemia in children, adolescents, and adults (99,100). In the Bogalusa Heart Study, serial cross-sectional surveys showed that higher BMI was associated with higher fasting insulin levels in childhood and adolescence and with higher fasting glucose levels in young adulthood (101). Insulin resistance (IR) correlates strongly with abdominal obesity, high TGs, and reduced HDL-C in children, adolescents, and adults. During puberty, insulin resistance is physiologic with an average 50% decrease in insulin sensitivity, associated with compensatory doubling of insulin secretion to maintain glucose homeostasis. The pattern of insulin resistance is exaggerated in obese adolescents and persists after puberty is complete (102).


Hyperinsulinemia enhances hepatic VLDL synthesis, manifest as high TGs (103). At the tissue level, IR promotes lipoprotein lipase dysfunction, further elevating TGs (104). In normoglycemic adolescents, IR and CD were seen only in obese subjects and the dyslipidemia correlated with the degree of IR (105). In a hyperinsulinemic–euglycemic clamp study, elevated TGs with reduced HDL-C identified in vivo IR (41).


Progression from IR to impaired fasting glucose to type 2 diabetes (T2DM) has been documented in youth, especially with a family history of diabetes (101). T2DM is increasingly common in adolescents with a prevalence of 0.46 per 1000 individuals in 2009, a 31% increase from 2001 (106). In children and adults, the interplay between insulin resistance and dyslipidemia in normoglycemic and hyperglycemic individuals is complex and at this time, incompletely elucidated (107).


Non-Alcoholic Fatty Liver Disease  


CD is also strongly linked with non-alcoholic fatty liver disease (NAFLD), defined as hepatic fat infiltration in >5% of hepatocytes with no evidence of hepatocellular injury on liver biopsy and no history of alcohol intake (109).  NAFLD is highly correlated with obesity, affecting at least 38% of obese adolescents in autopsy series and ~50% in epidemiologic surveys (109,110). On evaluation, the most common findings are hepatomegaly and mild-to-moderate elevation in serum alanine aminotransferase (ALT) (108). Hepatic fat deposition usually occurs in the context of generalized obesity but reflects much more strongly, the presence of increased visceral adiposity. In obese children and adolescents, sequential increase in waist circumference, a proxy measure of visceral fat, is associated with progressive increase in odds ratio for prediction of ultrasound-detected hepatic steatosis (112). NAFLD is strongly associated with insulin resistance and all of the components of the metabolic syndrome (112-114). In a study of adolescents with biopsy-proven NAFLD, 80% had biochemical evidence of insulin resistance (114). In more than half of subjects with NAFLD, the atherogenic CD pattern is seen on a standard lipid profile and with NMR analysis (115). As with CD, dietary sugar is considered to play a significant role in the development and progression of NAFLD – in a recent randomized controlled trial, provision of a diet low in free sugar content for 8 weeks led to significant improvements in hepatic steatosis (116). In children and adolescents, NAFLD is associated with atherosclerosis at autopsy and with ultrasound vascular markers associated with atherosclerosis (117). In adults, NAFLD has been shown to be a strong, independent predictor of CVD (118).


Metabolic Syndrome


CD, insulin resistance, and visceral adiposity are each components of the metabolic syndrome (MS), first described by Reaven in 1988 and identified as a high-risk constellation for atherosclerotic disease (119). Non-alcoholic fatty liver disease (NAFLD) has been added as a sixth component of the metabolic syndrome (120). In the U.S., the metabolic syndrome is reported in 23% of adults, including 7% of men and 6% of women in the 20- to 30-year-old age group (121,122). There is as yet no agreed-upon definition for the metabolic syndrome in childhood, but analysis of cross-sectional data from NHANES (1988-1994) revealed the MS cluster in 28.7% of obese adolescents compared with 0.1% of those with a BMI below the 85th percentile. As age and the degree of obesity increased, the prevalence of the MS cluster increased, reported in 38.7% of moderately obese (mean body mass index [BMI] 33.4 kg/m2) and 49.7% of severely obese (mean BMI 40.6 kg/m2) adolescents (123,124). Presence of the metabolic syndrome cluster at a mean of 12 years of age was an independent predictor of adult cardiovascular disease 25 years later (125).


Summary


CD is strongly associated with a complex of related cardiometabolic factors. From existing studies, it appears that visceral adiposity develops in children and adolescents with underlying racial/ethnic/familial/genetic susceptibility in response to excessive weight gain. This initiates a cascade of pathophysiologic reactions which result in CD, insulin resistance/ T2DM, and NAFLD and combined, the metabolic syndrome. These prevalent combinations are powerful predictors of cardiometabolic risk (1,115,116).


MAKING THE DIAGNOSIS OF COMBINED DYSLIPIDEMIA


The 2011 NHLBI pediatric guidelines were the first to recognize the importance of high TGs and CD in childhood (1). The guidelines recommend selective lipid screening when overweight or obesity is first identified (BMI > 85th%ile for age/sex); when any other major cardiovascular risk is present; and when there is a family history of early cardiovascular disease or of treated dyslipidemia (1). While non-fasting measures of total cholesterol and HDL–C are accurate and non-HDL-C can be used for general screening, hypertriglyceridemia can only be identified on a fasting lipid profile (FLP) so a FLP is recommended for selective screening in these settings.


  • Normative values for the lipid components are shown in table 1 with values above the 95th%ile considered elevated for TC, TG, non-HDL-C, and LDL-C; and below the 5th%ile considered as reduced for HDL-C.
  • If the first FLP results are abnormal, testing should be repeated after 2 weeks but before 3 months and results averaged to determine baseline lipid values.
  • Measurement of TGs is subject to considerable biologic variability with median variation between measurements of 23.5% compared with ~ 5-6% for cholesterol and HDL-C so if the first 2 test results are highly disparate, a third fasting measurement is recommended (127,128).
  • For the rare child with CD in whom TGs consistently exceed 500 mg/dL and who is at risk for pancreatitis, treatment is described in detail in the NHLBI guidelines and in other Endotext chapters (1).
  • When high TGs or CD are confirmed, specific evaluation for co-morbidities is recommended:
  • Waist circumference and WHtR as measures of visceral adiposity (91-93)
  • Assessment of fasting glucose to evaluate glucose intolerance per the recommendations of the American Diabetic Association (129)
  • ALT measurement to check for NAFLD (108)
  • Evaluation for the MS cluster


As noted, there are racial, ethnic and gender differences in TG levels in childhood and adolescence. African-Americans have significantly lower triglycerides and higher HDL-C levels compared with Hispanics and non-Hispanic whites (45-47). With puberty, HDL-C levels drop a mean of 10 mg/dL in males with no change in females, regardless of race/ethnicity (1). These differences suggest that race-, gender- and developmental stage-specific cut points may be needed to optimally identify high TGs and CD but normative tables for American youth based on these factors are not currently available.


LIFESTYLE MANAGEMENT OF COMBINED DYSLIPIDEMIA


Evidence for Response to Lifestyle Changes


Multiple studies have shown significant improvements in CD in response to weight loss, change in diet composition, and increased activity (130). In all age groups, even small amounts of weight loss are associated with significant decreases in TGs, often with increases in HDL–C (1,131-137). In adults, weight loss of as little as 5% results in a 20% decrease in TGs and an 8 to 10 % increase in HDL-C (133). In youth, a decrease in BMI z-score of at least 0.15 kg/m2is associated with significant improvement in triglycerides and HDL-C (134). The magnitude of TG decreases correlates directly with the amount of weight loss. Acute weight loss in children and adolescents has been shown to significantly decrease TGs and LDL particles and small dense LDL on NMR analysis (137).


Changes in diet composition have also been shown to be an effective treatment for high TGs and CD. In light of the strong evidence in children and adults associating excessive sugar intake with obesity and with combined dyslipidemia, decreasing simple carbohydrate intake especially in the form of added sugars is a common and important focus (73-80). In adults, a low-carbohydrate diet with monounsaturated fat enrichment significantly decreased TGs by a mean of 63%, with associated increases in HDL–C (138). One-year follow-up of young children (mean age 21 months) with elevated TGs treated with a diet restricted in sugar and carbohydrates was associated with a significant TG decrease from a mean of 274.1 +/- 13.1 mg/dL before treatment to 88.8 +/- 13.3 mg/dL (139). In adolescents and young adults, low glycemic-load diets are as effective as low-fat diets in achieving weight loss and are associated with decreased TGs and increased HDL-C (140-143). In obese children and adolescents, a low-carbohydrate diet with or without weight loss significantly reduces TGs (144,145). These diet composition changes have also been shown to significantly improve the LDL subpopulation pattern (138,148). Combined, diet composition changes lower TGs by at least 20% (135). 


Exercise has also been effective in treating CD in youth, alone and in the context of a weight loss plan. Aerobic activity facilitates the hydrolysis and utilization of triglycerides in skeletal muscle, reducing deposition as adipose tissue. In adults, moderately intense activity vs no activity was associated with 20% lower TGs, with lowest levels in the highest activity subjects (147). In cross-sectional studies in youth, low cardiorespiratory fitness is a strong predictor of high triglycerides as part of the MS cluster, and high fitness is associated with a low metabolic risk score (149-151). In randomized controlled trials, aerobic exercise interventions are associated with significant decreases in TG levels and increases in HDL-C, proportionate to training intensity (152-155). 


Several studies have attempted to define the optimal type, volume, and intensity of activity required for cardiovascular risk reduction.  A systematic review of activity-related benefits concluded that youth aged 5 to 17 years required at least 60 minutes of at least moderate intensity activity every day (156). Aerobic activities should make up the majority, at vigorous intensity whenever possible. These recommendations are very similar to the Physical Activity Guidelines from the U.S. Department of Health and Human Services (157). A randomized, controlled trial in obese children showed that 20 or 40 minutes of supervised aerobic exercise 5 days per week demonstrated dose-response benefits for insulin resistance and visceral adiposity, both strongly associated with CD (158). Pooled data from the International Children’s Accelerometry Database shows that replacement of 10 mins of sedentary time/day with 10 minutes of moderate-to-vigorous activity was associated with significantly lower fasting insulin and TG levels (159).


No studies of youth with high TGs or CD have evaluated clinical cardiovascular events in response to lifestyle changes initiated in childhood.  However, in longitudinal cohort studies, low cardiovascular risk in childhood is significantly predictive of better vascular health in adulthood and lifestyle interventions have been shown to improve vascular measures (160-162). In obese youth with high TGs and CD, diet and exercise intervention studies show that subjects who were successful in weight loss showed improvements in vascular measures (163-165).


Lifestyle Intervention: Diet and Exercise Recommendations         


With this evidence, primary recommended treatment for CD and for related visceral adiposity, IR, and NAFLD is weight loss with optimized diet composition. A comprehensive, straightforward weight management approach can be initiated in any practice setting, beginning with calculation of appropriate energy intake for age, gender, and activity using table 2 from the 2011 NHLBI pediatric guidelines (1). Estimation of current caloric intake allows development of a plan to gradually decrease calories towards the appropriate level over several weeks with the guidance of a registered dietitian.


Table 2.  Estimated Calorie Requirements (in Kilocalories [kcals]) for Gender and Age Group at Three Levels of Physical Activitya


Calorie Requirements (kcals) by Activity Level b,c,d

Gender

Age (Years)

Sedentaryb

Moderately Activec

Actived

Child

2–3

1,000

1,000–1,400e

1,000–1,400e

Female

4–8
9–13
14–18
19–30

1,200
1,600
1,800
2,000

1,400–1,600
1,600–2,000
2,000
2,000–2,200

1,400–1,800
1,800–2,200
2,400
2,400

Male

4–8
9–13
14–18
19–30

1,400
1,800
2,200
2,400

1,400–1,600
1,800–2,200
2,400–2,800
2,600–2,800

1,600–2,000
2,000–2,600
2,800–3,200
3,000

(Estimates determined using the Institute of Medicine equation & rounded to nearest 200 kcals.)

a These levels are based on Estimated Energy Requirements from the IOM Dietary Reference Intakes macronutrients report (2002), calculated by gender, age, and activity level for reference-size individuals.  “Reference size,” as determined by the IOM, is based on median height and weight for ages up to age 18 years and median height and weight for that height to give a body mass index of 21.5 for adult females and 22.5 for adult males.

b A sedentary activity level in childhood, as in adults, means a lifestyle that includes only the light physical activity associated with typical day-to-day life.

c Moderately active in childhood means a lifestyle that includes some physical activity, equivalent to an adult walking about 1.5 to 3 miles per day at 3 to 4 miles per hour, in addition to the light physical activity associated with typical day-to-day life.

d Active means a lifestyle that includes more physical activity, equivalent to an adult walking more than 3 miles per day at 3 to 4 miles per hour, in addition to the light physical activity associated with typical day-to-day life.


Diet composition is focused on limitation of simple carbohydrates especially sweets and added sugars with complete elimination of all sugar-sweetened beverages. The diet recommendations from the NHLBI guidelines are shown in table 3.  

Table 3. DIET COMPOSITION: Healthy Lifestyle/ Combined Dyslipidemia/ High TGs               

·1) Teach portions based on estimated energy requirements for age/gender/activity level. (Table 2)

·2) Primary beverage:  Fat-free unflavored milk.

·3) No sugar-sweetened beverages; encourage water intake.

· 4) Limit refined carbohydrates (sugars, baked goods, white rice, white bread, plain pasta), replacing with
complex carbohydrates (brown rice, whole grain bread, whole grain pasta).

5) Encourage dietary fish content*

 * The Food and Drug Administration (FDA) and the Environmental Protection Agency are advising women of childbearing age who may become pregnant, pregnant women, nursing mothers, and young children to avoid some types of fish and shellfish and eat fish and shellfish that are lower in mercury.  For more information, call the FDA’s food information line toll free at 1–888–SAFEFOOD or visit: http://www.cfsan.fda.gov/~dms/admehg3.html

·        

6) Fat content:                                                                                        

o   Total fat 25–30% of daily kcal/EER

Saturated fat </= 8% of daily kcal/EER 

Cholesterol <300 mg/d

Avoidtrans fats as much as possible

Mono- and polyunsaturated fat up to 20% of daily kcal/ EER 

·7) Encourage high dietary fiber intake from naturally fiber-rich foods (fruits, vegetables, whole grains) with a goal of “age plus 5 g/d.


These diet recommendations are those recommended for all healthy children over age 2 from the NHLBI Guidelines with intensification of limitation of simple carbohydrates.


Simple carbohydrates like white rice, white bread, and plain pasta are replaced with complex carbohydrates like brown rice and whole grain bread and pasta. Foods high in natural fiber are encouraged with a goal of age plus 5 grams per day. For all dietary change in youth, initial family-based training with a registered dietitian is the most effective way to begin and sustain change (1). The DASH eating plan adapted for children and adolescents as part of the 2011 NHLBI guidelines reflects the recommended TG/CD diet composition and is easy to use, organized for selected energy(kcal) intake from table 2 and by servings per day per food group (Table 4) (1).


Table 4.  DASH-Style Eating Plan: Servings per Day by Food Group & Total Energy Intake.


Food Group


1,200 Calories


1,400 Calories


1,600 Calories


1,800 Calories


2,000 Calories


2,600 Calories


Serving Sizes


Examples and Notes

Significance of Food Group to DASH Eating Plan

Grains*

4-5

5-6

6

6

6–8

10-11

1 slice bread

1 oz dry cereal

½ cup cooked rice, pasta, or cereal

Whole- wheat bread and rolls, whole-wheat pasta, English muffin, pita bread, bagel, cereals, grits, oatmeal, brown rice, unsalted pretzels and popcorn

Major sources of energy and fiber

Vegetables

3-4

3-4

3-4

4-5

4–5

5-6

1 cup raw leafy vegetable

½ cup cut-up raw or cooked vegetable

½ cup vegetable juice

Broccoli, carrots, collards, green beans, green peas, kale, lima beans, potatoes, spinach, squash, sweet potatoes, tomatoes

Rich sources of potassium, magnesium, and fiber

Fruits

3-4

4

4

4-5

4–5

5-6

1 medium fruit

¼ cup dried fruit

½ cup fresh, frozen, or canned fruit

½ cup fruit juice

Apples, apricots, bananas, dates, grapes, oranges, grapefruit, grapefruit juice, mangoes, melons, peaches, pineapples, raisins, strawberries, tangerines

Important sources of potassium, magnesium, and fiber

Fat-free or low-fat milk and milk products

2-3

2-3

2-3

2-3

2–3

3

1 cup milk or yogurt

1½ oz cheese

Fat-free milk or buttermilk; fat-free, low-fat, or reduced-fat cheese; fat-free/low-fat regular or frozen yogurt

Major sources of calcium and protein

Lean meats, poultry, and fish

3 or less

3-4 or less

3-4 or less

6 or less

6 or less

6 or less

1 oz cooked meats, poultry, or fish

1 egg

Select only lean; trim away visible fats; broil, roast, or poach; remove skin from poultry

Rich sources of protein and magnesium

Nuts, seeds, and legumes

3 per week

3 per week

3-4 per week

4 per week

4–5 per week

1

1/3 cup or 1½ oz nuts

2 Tbsp peanut butter

2 Tbsp or ½ oz seeds

½ cup cooked legumes (dried beans, peas)

Almonds, filberts, mixed nuts, peanuts, walnuts, sunflower seeds, peanut butter, kidney beans, lentils, split peas

Rich sources of energy, magnesium, protein, and fiber

Fats and oils^

1

1

2

2-3

2-3

3

1 tsp soft margarine

1 tsp vegetable oil

1 Tbsp mayonnaise

2 Tbsp salad dressing

Soft margarine, vegetable oil (canola, corn, olive, safflower), low-fat mayonnaise light salad dressing

DASH study had 27% of calories as fat, including fat in or added to foods.

Sweets and added sugars

3 or less per week

3 or less per week

3 or less per week

5 or less per week

5 or less per week


< 2

1 Tbsp sugar

1 Tbsp jelly or jam

½ cup sorbet, gelatin dessert

1 cup lemonade

Fruit-flavored gelatin, fruit punch, hard candy, jelly, maple syrup, sorbet and ices, sugar

Sweets should be low in fat.

* Whole grains are recommended for most grain servings as a good source of fiber and nutrients.

† Serving sizes vary between ½ cup and 1 1/4 cups, depending on cereal type.  Check product’s Nutrition Facts label.

‡ Two egg whites have the same protein content as 1 oz meat.

^ Fat content changes serving amount for fats and oils.  For example, 1 Tbsp regular salad dressing = one serving; 1 Tbsp low-fat dressing = one-half serving; 1 Tbsp fat-free dressing = zero servings.

Abbreviations: oz = ounce; Tbsp = tablespoon; tsp = teaspoon. 


Successful weight loss programs in children and adolescents include frequent contact for support and monitoring by the physician and/or dietitian, as often as weekly for the first 6 months and this should be considered when initiating diet changes for children with CD (166). While not necessary for lipid management, a repeat fasting lipid panel after 1 to 3 months of diet change can be an effective motivator for children and families since TG levels decrease rapidly in response to changes in diet composition and even minimal weight loss (167).


A regular exercise schedule derived from the evidence is prescribed, simultaneous with the diet recommendations. All children and adolescents should be involved in 60 minutes or more of moderate to vigorous aerobic activity daily, with vigorous intensity activity at least 3 days/week (1,168,169). Any kind of aerobic activity is useful but weight bearing activity is most effective.  To promote compliance, a discussion about the kind of exercise that will be easiest for each child and family to sustain should be undertaken and specific follow-up of activity at subsequent evaluations is recommended. A combined diet and activity approach to weight loss like this has been shown to be effective in management of high TGs and CD (167-174).


For obese children and their families, weight loss can be an emotional issue so an alternative approach aimed at changing diet composition and activity without a direct approach to weight can be used. The same diet change and activity recommendations described above are prescribed but there is no calculation of caloric needs and no specific focus on weight loss. This approach has been shown to be successful in addressing high TGs and CD, particularly when combined with cognitive behavioral therapy (167,174-180).


Follow-Up    


After 6 months of the selected diet and activity plan, the fasting lipid profile (FLP) should be repeated:


  • If TGs are normal (<100 mg/dL, <10 years; <130 mg/dL, 10–19 years), continue the diet and activity recommendations and reassess the FLP every 12 months
  • If TGs are > 100 mg/dL but < 200 mg/d in children < 10 years of age, > 130 mg/dL but < 200 mg/dL in 10-19 years old:
  • Intensify counselling for the high TG/CD diet and increased activity.
  • Recommend increased dietary fish content.
  • Increase frequency of contact with MD and/or RD.
  • Repeat FLP in 6 months
  • If TG are > 200 mg/dL but less than 500 mg/dL and lifestyle recommendations have been attempted with no weight loss, consider referral to an intensive weight loss program (1).
  • If TG are > 200 mg/dL but less than 500 mg/dL despite weight loss in an adolescent who has at least 2 additional high-level cardiovascular risk factors (table 5), medication can be considered (1).


Table 5. High Level Cardiovascular Risk Factors for Management of Combined Dyslipidemia in Childhood

(+) Family history: Myocardial infarction, angina, coronary artery bypass graft/ stent/   angioplasty, sudden cardiac death in parent, grandparent, aunt, or uncle;                               Male < 55 y, female < 65 y.

Diabetes mellitus, type 1 or type 2

Hypertension requiring drug treatment

Current cigarette smoking

BMI>97th%ile


Application of these recommendations is usually associated with significant improvements in hypertriglyceridemia and CD on intermediate-term follow-up, with increasing evidence of lipid subpopulation and vascular response to lifestyle change. There are no published long-term studies of lifestyle change.


MEDICATION THERAPY FOR HYPERTRIGLYCERIDEMIA AND COMBINED DYSLIPIDEMIA


Information on drug therapy for treatment of hypertriglyceridemia and CD in childhood is limited. Drugs which could potentially be used are described below.


HMG-CoA Reductase Inhibitors (Statins)


In adults with high cholesterol and CD, statin therapy beneficially alters the standard lipid and LDL particle profiles and improves vascular function and clinical cardiovascular outcomes (181-183). In childhood, statin treatment has focused on children with monogenic hyper-cholesterolemia (FH) in whom statins effectively lower LDL-C levels and improve LDL-C subpopulation characteristics (184,185). Two pediatric trials of children with FH showed improved vascular measures in response to statin therapy (185,186). There are as yet no published studies examining statin effects on clinical outcomes in youth with CD.  A systematic review of statin therapy in children with FH analyzed studies that included more than 1000 children (188). Treatment with statins significantly decreased LDL-C but change in TGs was much less consistent. No statistically significant differences were found between statin-treated and placebo-treated children for the occurrence of any adverse events, including problems with sexual development, muscle toxicity, or liver toxicity.  An important study reported late follow-up of 184 patients with genetically confirmed familial hypercholesterolemia (FH) who were started on pravastatin therapy at a mean age of 12 years as part of a placebo-controlled trial. After 20 years, FH participants had mean LDL cholesterol levels 32% below baseline levels in the original trial. Mean progression of carotid intima–media thickness in FH subjects was similar to that of unaffected siblings. The cumulative incidence of cardiovascular events and death from cardiovascular causes was lower among the FH participants than among their affected parents for whom statins were available much later in life. This landmark report emphasizes the safety, effectiveness and benefit of long-term statin therapy initiated in childhood for treatment of FH (189).  DoIt!, an ongoing Pediatric Heart Network trial is evaluating the clinical and vascular responses to statin therapy in adolescents with obesity and CD. Enrollment is ongoing with a planned sample size of more than 300 subjects. Results are anticipated soon (190).


Omega-3 Fish Oil


Omega-3 fish oil therapy has been shown to be safe in adults, with some reports that TG levels decreased by as much as 30–45%, with associated increases in HDL–C (191). However, more recent reports including a Cochrane systematic review of 25 randomized, controlled trials have shown no conclusive benefits of standard fish oil treatment (usually 1 gram per day) on serum lipids or cardiovascular disease outcomes (192-194). Two randomized, controlled trials of omega-3 fish oil in adolescents showed statistically insignificant decreases in TGs and no change in LDL particle number or size (195,196). Evidence from multiple trials in adults with established CV risk shows conflicting results for benefit from omega-3 fatty acids and/or EPA. A detailed discussion of the potential benefits of omega-3-fattys on cardiovascular outcomes are discussed in detail in other Endotext chapters. There is as yet no information on use of EPA in children or adolescents.


PPAR-Alpha Agonists (Fibrates) 


In adults, fibrates have been used effectively and safely to lower TG levels, alone and in combination with statins (fenofibrate should be used in combination as gemfibrozil increases the risk of muscle disorders) (197). Fibrates reduce cholesterol synthesis and lower plasma TGs by 30-50% with an increase in HDL-C of 2-20%. Fibrate therapy beneficially alters LDL subclass distribution with an increase in LDL size and a decrease in LDL particles (198).


In children, treatment with fibrates in a single small randomized trial (n=14) and 3 case series (n=7, n=17, n=47) was associated with significant TG lowering by as much as 54% with an associated 17% increase in HDL-C (199-202). One child was thought to have myositis on clinical grounds with no lab changes and there were mild, transient elevations in liver enzymes in 2 subjects but no other potentially adverse effects were reported. There are no long-term trials of fibrates in children and no studies of the vascular or clinical response to treatment. 


Summary


Evidence for drug therapy of moderate hypertriglyceridemia or CD in childhood is limited.  Statins improve LDL-C subpopulation characteristics on NMR analysis in children with FH (184,185). There is substantial evidence that statins as a group are safe and effective for long-term treatment of hypercholesterolemia beginning in childhood (189).  Despite concern about hepatic side-effects, current evidence indicates that statins are safe in patients with NAFLD and may improve liver function tests (203).  Statin therapy therefore appears to be the logical theoretical choice for treatment of CD if drug therapy is needed. The possibility of eicosapentaenoic acid (EPA) as secondary treatment for adults with established CVD and residual risk due to high TGs represents a theoretical treatment option but results are controversial and there is no reported experience for use in youth (204). There are no current trials of any other medication in children with combined dyslipidemia.  A large body of evidence indicates that lifestyle therapy is highly effective for management of CD in youth and that a decision to initiate drug treatment should only be made in an adolescent with multiple additional high-level risk factors after intensive long-term efforts at lifestyle modification.


CONCLUSION


In youth, CD is a prevalent, highly atherogenic lipid disorder, almost always associated with obesity. High TGs and CD are strongly associated with a complex of related risk factors including visceral adiposity, insulin resistance/T2DM, NAFLD, and the metabolic syndrome complex which significantly exponentiate risk for CVD.  Primary therapy is lifestyle change focused on weight loss, change in diet composition, and increased activity.  These interventions are usually very effective. Drug therapy is only rarely needed in the multiple risk adolescent with CD with statin medications as the theoretical drug of choice.


REFERENCES


  1. Expert Panel on Integrated Guidelines for Cardiovascular Health and Risk Reduction in Children and Adolescents: National Heart, Lung and Blood Institute.  Pediatrics 2011;128(Suppl 5):S213-256; www.nhlbi.nih.gov/guidelines/cvd_ped/index.htm.
  2. 2. Otvos J. Measurement of triglyceride-rich lipoproteins by nuclear magnetic resonance spectroscopy. Clin Cardiol. 1999;22:II21-7.
  3. Kuller L, Arnold A, Tracy R, et al. Nuclear magnetic resonance spectroscopy of       lipoproteins and risk of coronary heart disease in the cardiovascular health study.  Arterioscler Thromb Vasc Biol 2002;22:1175-80.
  4. Blake GJ, Otvos JD, Rifai N, Ridker PM. Low-density lipoprotein particle concentration  and size as determined by nuclear magnetic resonance spectroscopy as predictors of cardiovascular disease in women. Circulation 2002;106:1930-7.
  5. Krauss RM. Dense low density lipoproteins and coronary artery disease.  Am J Cardiol 1995;75(6):53B-57B.
  6. Rosenson RS, Otvos JD, Freedman DS.  Relations of lipoprotein subclass levels and low density lipoprotein size to progression of coronary artery disease in the Pravastatin Limitation of Atherosclerosis in the Coronary Arteries (PLAC-1) trial. Am J Cardiol 2002;90(2):89-94.
  7. El Harchaoui K, van der Steeg WA, Stroes ES et al.  Value of low-density lipoprotein particle number and size as predictors of coronary artery disease in apparently healthy men and women: the EPIC-Norfolk Prospective Population study.  J Am Coll Cardiol 2007;49(5):547-553.
  8. Mackey RH, Kuller LH, Sutton-Tyrrell K et al.  Lipoprotein subclasses and coronary artery calcium in postmenopausal women from the Healthy Women study.  Am J Cardiol 2002;90(8A):71i-76i.
  9. Otvos JD, Collins D, Freedman DS et al. Low-density lipoprotein and high-density lipoprotein particle subclasses predict coronary events and are favorably changed by gemfibrozil therapy in the Veterans Affairs High-Density Lipoprotein Intervention Trial. Circulation 2006;113(12):1556-1563.
  10. Cromwell WC, Otvos JD, Keyes MJ et al.  LDL particle number and risk of future cardiovascular disease in the Framingham Offspring Study – Implications for LDL management.  J Clin Lipidol 2007;1(6):583-592.
  11. Arca M, Montali A, Valiente S et al.  Usefulness of atherogenic dyslipidemia for predicting cardiovascular risk in patients with angiographically defined coronary artery disease.  Am J Cardiol 2007;100(10):1511-1516.
  12. Hoff HF, Titus JL, Bajardo RJ, Jackson RL et al. Lipoproteins in atherosclerotic lesions. Localization by immunofluorescence of apo-low density lipoproteins in human atherosclerotic arteries from normal and hyperlipoproteinemics. Arch Pathol. 1975 May;99(5):253-8.
  13. Nigon F, Lesnik P, Rouis M et al. Discrete subspecies of human low density lipoproteins are heterogeneous in their interaction with the cellular LDL receptor.  J Lipid Res 1991;32:1741-1753.
  14. Berneis K, Shames DM, Blanche PJ et al. Plasma clearance of human low-density lipoprotein in human apolipoprotein B transgenic mice is related to particle diameter. Metabolism. 2004 Apr;53(4):483-7.
  15. La Belle M, Krauss RM.  Differences in carbohydrate content of low density lipoproteins associated with low density lipoprotein subclass patterns.  J Lipid Res 1990 Sep;31(9):1577-88.
  16. Olin-Lewis K, Krauss RM, La Belle M et al.  ApoC-III content of apoB-containing lipoproteins is associated with binding to the vascular proteoglycan biglycan. J Lipid Res 2002;43(11):1969-1977.
  17. Shin MJ, Krauss RM.  Apolipoprotein CIII bound to apoB-containing lipoproteins is associated with small, dense LDL independent of plasma triglyceride levels in healthy men. Atherosclerosis. 2010; 211(1):337-41.
  18. De Graaf J, Hak-Lemmers HL, Hectors MP et al.  Enhanced susceptibility to in vitro oxidation of the dense low density lipoprotein subfraction in healthy subjects.  Arterioscler Thromb 1991;11:298-306.
  19. Carroll MD, Fryar CD, Ogden CL. Prevalence of Obesity Among Adults and YouthUnited States2015-2016. NCHS Data Brief. 2017 Oct;(288):1-8. 
  20. Deshmukh-Taskar P, Nicklas TA, Morales M, Yang SJ, Zakeri I and Berenson GS. Tracking of overweight status from childhood to young adulthood: the Bogalusa Heart Study. Eur J Clin Nutr. 2006;60:48-57.
  21. Freedman DS, Mei Z, Srinivasan SR, Berenson GS and Dietz WH. Cardiovascular risk factors and excess adiposity among overweight children and adolescents: the Bogalusa Heart Study. J Pediatr. 2007;150:12-17 e2.
  22. Freedman DS, Dietz WH, Srinivasan SR and Berenson GS. The relation of overweight to cardiovascular risk factors among children and adolescents: the Bogalusa Heart Study. Pediatrics. 1999;103:1175-82.25.
  23. Franks PW, Hanson RL, Knowler WC, Sievers ML, Bennett PH and Looker HC. Childhood obesity, other cardiovascular risk factors, and premature death. N Engl J Med. 2010;362:485-93.
  24. Centers for Disease Control and Prevention. Prevalence of abnormal lipid levels among youths --- United States, 1999-2006. MMWR Morb Mortal Wkly Rep;59:29-33.
  25. Perak AM, Ning H, Kit BK et al. Trends in lipid levels of lipids and apolipoprotein B in US youths aged 6 to 19 years, 1999-2016. JAMA 2019; 321(19): 1895-1905.
  26. Dhuper S, Sakowitz S, Daniels J et al.  Association of lipid abnormalities with measures and severity of adiposity and insulin resistance among overweight children and adolescents. J Clin Hypertes (Greenwich) 2009; 11:594-600.
  27. Korsten-Reck U, Kromeyer-Hauschild K, Korsten K et al. Frequency of secondary dyslipidemia in obese children.  Vasc Health Risk Manag 2008; 4: 1089-1094.
  28. Bell LM, Curran JA, Byrne S et al.  High incidence of obesity co-morbidities in young children: a cross-sectional study.  J Paediatr Child Health 2011;47: 911-917.
  29. Salvatore D, Satnick A, Abell R et al.  The prevalence of abnormal metabolic parameters in obese and overweight children.  JPEN J Parenter Enteral Nutr 2014; 38: 852-855.
  30. Friedemann C, Heneghan C, Mahtani K et al.  Cardiovascular disease risk in healthy children and its association with body mass index: systematic review and meta-analysis.  BMJ 2012; 345: e4759.
  31. Margolis KL, Greenspan LC, Trower NK et al.  Lipid screening in children and adolescents in community practice: 2007-2010.  Circ Cardiovasc Qual Outcomes 2014; 7:718-726.
  32. Correll CU, Manu P, Olshanskiy V et al. Cardiometabolic risk of second-generation antipsychotic medications during first-time use in children and adolescents.  JAMA 2009; 302(16):1765-1773.
  33. Findling RL, McNamara NK, Gracious BL. Pediatric uses of atypical antipsychotics. Expert Opin Pharmacother 2000; 1(5):935-945.
  34. Srinivasan SR, Frontini MG, Xu J, Berenson GS. Utility of childhood non-high-density lipoprotein cholesterol levels in predicting adult dyslipidemia and other cardiovascular risks: the Bogalusa Heart Study. Pediatrics 2006;118(1):201-206.
  35. Rainwater DL, McMahan CA, Malcom GT, Scheer WD, Roheim PS, McGill HC Jr, Strong JP. Lipid and apolipoprotein predictors of atherosclerosis in youth: apolipoprotein concentrations do not materially improve prediction of arterial lesions in PDAY subjects. The PDAY Research Group. Arterioscler Thromb Vasc Biol 1999;19(3):753-761.
  36. Frontini MG, Srinivasan SR, Xu JH, Tang R, Bond MG, Berenson G. Utility of non-high-density lipoprotein cholesterol versus other lipoprotein measures in detecting subclinical atherosclerosis in young adults (The Bogalusa Heart Study). Am J Cardiol 2007;100(1):64-8.
  37. Rana JS1, Boekholdt SM, Kastelein JJ, Shah PK. The role of non-HDL cholesterol in risk stratification for coronary artery disease. Curr Atheroscler Rep. 2012 Apr;14(2):130-4. doi: 10.1007/s11883-011-0224-x.
  38. Boekholdt SM1, Arsenault BJ, Mora S et al.  Association of LDL cholesterol, non-HDL cholesterol, and apolipoprotein B levels with risk of cardiovascular events among patients treated with statins: a meta-analysis. JAMA. 2012 Mar 28;307(12):1302-9.
  39. Gaziano JM, Michael J, Hennekens CH et al. Fasting triglycerides, high-density lipoprotein, and risk of myocardial infarction. Circulation 1997; 96: 2520-2525.
  40. da Luz PL, Favorato D, Faria-Neto JR et al.  High ratio of triglycerides to HDL-cholesterol predicts extensive coronary disease.  Clinics(Sao Paulo) 2008;63(4):427-432.
  41. Hannon TS, Bacha F, Lee SJ et al. Use of markers of dyslipidemia to identify overweight youth with insulin resistance. Pediatr Diabetes 2006;7:260-266.
  42. DiBonito P, Moio N, Scilla C et al.  Usefulness of the high triglyceride-to-HDL cholesterol ratio to identify cardiometabolic risk factors and preclinical signs of organ damage in outpatient children.  Diabetes Care 2012;35(1):158-162.
  43. Pacifico L, Bonci E, Andreoli G et al. Association of serum triglyceride-to–HDL cholesterol ratio with carotid intima media thickness, insulin resistance and nonalcoholic fatty liver disease in children and adolescents.  Nutr Metab Cardiovasc Dis 2014;24(7):737-743.
  44. Giannini C, Santoro N, Caprio S, Kim G, Lartaud D, Shaw M, et al. The triglyceride-to-HDL cholesterol ratio: association with insulin resistance in obese youths of different ethnic backgrounds. Diabetes Care 2011;34:1869e74.
  45. Hoffman R.  Increased fasting triglyceride levels are associated with hepatic insulin resistance in Caucasian but not African-American adolescents.  Diabetes Care 2006;29(6): 1402-1404.
  46. Sumner AE.  Ethnic differences in triglyceride levels and high-density lipoprotein lead to underdiagnosis of the metabolic syndrome in black children and adults.  J Pediatr 2009;155(3):S7.4-S7.11.
  47. D’Adamo E, Northrup V, Weiss R et al . Ethnic differences in lipoprotein subclasses in obese adolescents: importance of liver and intraabdominal fat accretion. Am J Clin Nutr 2010;92:500-508.44.  
  48. Burns SF, Lee SJ, Arslanian SA. Surrogate lipid markers for small dense low-density lipoprotein particles in overweight youth. J Pediatr 2012 Dec 17;161(6):991-6. Epub 2012 Jul 17.
  49. Marcus MD, Baranowski T, DeBar LL, Edelstein S, Kaufman FR, Schneider M, Siega-Riz AM, Staten MA, Virus A and Yin Z. Severe obesity and selected risk factors in a sixth grade multiracial cohort: the HEALTHY study. J Adolesc Health. 2010;47:604-7
  50. Mietus-Snyder M, Drews KL, Otvos JD, Willi SM, Foster GD, Jago R and Buse JB. Low-density lipoprotein cholesterol versus particle number in middle school children. J Pediatr. 2013;163:355-62.
  51. Miller M. Managing mixed dyslipidemia in special populations. Prev Cardiol. 2010;13(2): 78-83.
  52. Wu L, Parhofer KG. Diabetic dyslipidemia. Metabolism. 2014 Dec;63(12):1469-79. Epub 2014 Aug 29.
  53. Kavey RE. Combined dyslipidemia in childhood. J Clin Lipidol. 2015 Sep-Oct;9(5 Suppl):S41-56. doi: 10.1016/j.jacl.2015.06.008. Epub 2015 Jun 17.
  54. Goldstein JL, Schrott HG, Hazzard WR et al.  Hyperlipidemia in coronary artery disease. II. Genetic analysis of of lipid levels in 176 families and delineation of a new inherited disorder, combined hyperlipidemia. J Clin Invest 1973;52:1544-1568.
  55. Gaddi A, Cicero AF, Odoo FO, Poli AA and Paoletti R. Practical guidelines for familial combined hyperlipidemia diagnosis: an up-date. Vascular health and risk management. 2007;3:877-86.
  56. Lewis GF, Xiao C, Hegele RA.  Hypertriglyceridemia in the genomic era: a new paradigm. Endocr Rev 2015;36(1): 131-147.
  57. Brouwers MCGJ, van Greevenbroek MMJ, Stehouwer CDA et al.  The genetics of familial combined hyperlipidemia.  Nat Rev Endocrinol 2012;8:352-362.
  58. Lee KE, Klein BE, Klein R.  Familial aggregation of components of the multiple metabolic syndrome in the Framingham Heart and Offspring Cohorts. BMC Genet 2003;4(Suppl 1):S94.
  59. Montali A, Truglio G, Martino F et al.  Atherogenic dyslipidemia in children: Evaluation of clinical, biochemical and genetic aspects. PLoS ONE 2015; 10(4):doi:10.1371/jour.pone.0120099.nal
  60. Crosby J, Peloso GM, Auer PL et al.  Loss-of-function mutations in APOC3, triglycerides, and coronary disease. N Engl J Med 2014; 371(1):22-31.
  61. Pauciullo P, Gentile M, Marotta G, Baiano A, Ubaldi S, Jossa F, Iannuzzo G, Faccenda F, Panico S and Rubba P. Small dense low-density lipoprotein in familial combined hyperlipidemia: Independent of metabolic syndrome and related to history of cardiovascular events. Atherosclerosis. 2009;203:320-4.
  62. Ayyobi AF et al.  Small, dense LDL and elevated apoliporotein B are common characteristics for the three major lipid phenotypes of familial combined hyperlipidemia. Arterioscler Thromb Vasc Biol 2003;23:1289-1294.
  63. Tabas I, Williams KJ, Boren J. Subendothelial lipoprotein retention as the initiating process in atherosclerosis: update and therapeutic implications. Circulation 2007;116:1832-44.
  64. McGill HC, Jr., McMahan CA, Zieske AW, Sloop GD, Walcott JV, Troxclair DA, Malcom GT, Tracy RE, Oalmann MC and Strong JP. Associations of coronary heart disease risk factors with the intermediate lesion of atherosclerosis in youth. The Pathobiological Determinants of Atherosclerosis in Youth (PDAY) Research Group. Arterioscler Thromb Vasc Biol. 2000;20:1998-2004.
  65. Newman WP, 3rd, Freedman DS, Voors AW, Gard PD, Srinivasan SR, Cresanta JL, Williamson GD, Webber LS, Berenson GS. Relation of serum lipoprotein levels and systolic blood pressure to early atherosclerosis. The Bogalusa Heart Study. N Engl J Med. 1986;314:138-44.
  66. Berenson GS, Srinivasan SR, Bao W, Newman WP, 3rd, Tracy RE and Wattigney WA. Association between multiple cardiovascular risk factors and atherosclerosis in children and young adults. The Bogalusa Heart Study. N Engl J Med. 1998;338:1650-6.
  67. Wunsch R, de Sousa G and Reinehr T. Intima-media thickness in obesity: relation to hypertension and dyslipidaemia. Arch Dis Child. 2005;90:1097.
  68. Fang J, Zhang JP, Luo CX, Yu XM and Lv LQ. Carotid intima-media thickness in childhood and adolescent obesity: relationship to abdominal obesity, high triglyceride level and insulin resistance. Int J Med Sci. 2010;7:278-83.
  69. Ayer JG, Harmer JA, Nakhla S, Xuan W, Ng MK, Raitakari OT, Marks GB and Celermajer DS. HDL-cholesterol, blood pressure, and asymmetric dimethylarginine are significantly associated with arterial wall thickness in children. Arterioscler Thromb Vasc Biol. 2009;29:943-9.
  70. Urbina EM, Khoury PR, McCoy CE, Dolan LM, Daniels SR and Kimball TR. Triglyceride to HDL-C ratio and increased arterial stiffness in children, adolescents, and young adults. Pediatrics. 2013;131:e1082-90.
  71. Juonala M, Viikari JS, Ronnemaa T, Marniemi J, Jula A, Loo BM and Raitakari OT. Associations of dyslipidemias from childhood to adulthood with carotid intima-media thickness, elasticity, and brachial flow-mediated dilatation in adulthood: the Cardiovascular Risk in Young FinFinns Study. Arterioscler Thromb Vasc Biol. 2008; 28:1012-7.
  72. Magnussen CG, Venn A, Thomson R, Juonala M, Srinivasan SR, Viikari JS, Berenson GS, Dwyer T and Raitakari OT. The association of pediatric low- and high-density lipoprotein cholesterol dyslipidemia classifications and change in dyslipidemia status with carotid intima-media thickness in adulthood: evidence from the cardiovascular risk in Young Finns study, the Bogalusa Heart study, and the CDAH (Childhood Determinants of Adult Health) study. J Am Coll Cardiol. 2009;53:860-9.
  73. Koivistoinen T, Hutri-Kahonen N, Juonala M, Koobi T, Aatola H, Lehtimaki T, Viikari JS, Raitakari OT and Kahonen M. Apolipoprotein B is related to arterial pulse wave velocity in young adults: the Cardiovascular Risk in Young Finns Study. Atherosclerosis. 2011;214:220-4.
  74. Morrison JA, Glueck CJ, Horn PS, Yeramaneni S, Wang P.  Pediatric triglycerides predict cardiovascular disease events in the fourth to fifth decade of life.Metabolism 2009; 58(9):1277-1284. Epub 2009 Jun 18.
  75. Morrison JA, Glueck CJ and Wang P. Childhood risk factors predict cardiovascular disease, impaired fasting glucose plus type 2 diabetes mellitus, and high blood pressure 26 years later at a mean age of 38 years: the Princeton-lipid research clinics follow-up study. Metabolism. 2012;61:531-41.
  76. Tenenbaum A, Klempfner R, Fisman EZ.  Hypertriglyceridemia: a too long unfairly neglected cardiovascular risk factor.  Cardiovasc Diabetol 2014; 13:159-161.
  77. Toth PP. Triglyceride-rich lipoproteins as a causal factor for cardiovascular disease.  Vasc Health Risk M 2016;12:171-183.
  78. Nordestgaard BG.  Triglyceride-rich lipoproteins and atherosclerotic cardiovascular disease: New insights from epidemiology, genetics and biology.  Circ Res 2016; 118(4):547-563.
  79. Nichols GA, Phillip S, Reynolds K. Increased cardiovascular risk in hypertriglyceridemic patients with statin-controlled LDL-cholesterol. J. Clin. Endocrinol. Metab. 2018. 103:3019-3027
  80. Ganda OP et al. Unmet Need for Adjunctive Dyslipidemia Therapy in Hypertriglyceridemia Management. J. Am. Coll. Cardiol. 2018. 72:330-34.
  81. Ludwig DS, Peterson KE, Gortmaker SL.  Relation between consumption of sugar-sweetened drinks and childhood obesity: a prospective, observational analysis.  Lancet 2001;357:505-508.
  82. Malik VS, Matthias B Schulze MB, Hu FB.  Intake of sugar-sweetened beverages and weight gain: a systematic review. Am J Clin Nutr 2006;84:274–88.
  83. Van Rompay MI, McKeown NM, Goodman E et al.  Sugar-sweetened beverage intake is positively associated with baseline triglyceride concentrations and changes in intake are inversely associated with changes in HDL cholesterol over 12 months in a multi-ethnic sample of children. J Nutr 2015; 145(10):2389-2395.
  84. Kell KP, Cardel MI, BohanBrown MM et al.  Added sugars in the diet are positively associated with diastolic BP and triglycerides in children.  Am J Clin Nutr 2014; 100(1): 46-52.
  85. Zhang Z, Gillespie C, Welsh JA et al.  Usual intake of added sugars and lipid profiles among U.S. adolescents: National Health and Nutrition Examination Survey, 2005-2010.  J Adolesc Health 2015; 56(3):352-359.
  86. Sonneville KR, Long MW, Rifas-Shimon SL et al.  Juice and water intake in infancy and later beverage intake and adiposity: could juice be a gateway drink?  Obesity 2015; 23(1):170-176.
  87. Lin W-T, Chan T-F, Huang H-L et al.  Fructose-rich beverage intake and central adiposity, uric acid and pediatric insulin reference.  J Pediatr 2016;171:90-96.
  88. Lee AK, Binongo JN, Chowdhury R et al.  Consumption of less than 10% of total energy from added sugars is associated with increasing HDL in females during adolescence: a longitudinal analysis.  J Am Heart Assoc 2014;3(1):e0006 15.
  89. Jensen MD. Role of body fat distribution and the metabolic consequences of obesity.  J Clin Endocrinol Metab 2008;93:S57-S63.
  90. de Lemos JA, Neeland IJ.  Separating the VAT from the FAT. New insights into the cardiometabolic risks of obesity. J Am Coll Cardiol Img 2014;7(12):1236-1238.
  91. Taylor RW, Jones IE, Williams SM et al.  Evaluation of waist circumference, waist-to-hip ratio and the conicity index as screening tools for high trunk fat mass, as measured by dual-energy X-ray absorptiometry in children aged 3-19 y.  Am J Clin Nutr 2000;72;490-495.
  92. Bassali R, Waller JL, Gower B et al.  Utility of waist circumference percentile for risk evaluation in obese children.  J Pediatr Obes 2011;5: 97-101.
  93. Fryar CD, Gu Q, Ogden CL. Anthropometric reference data for children and adults: United States, 2007–2010. National Center for Health Statistics. Vital Health Stat 11(252). 2012.
  94. Li C, Ford ES, Mokdad AH, Cook S.  Recent trends in waist circumference and waist-height ratio among US children and adolescents.  Pediatrics 2006;118: e1390-1398.
  95. Khoury M, Manlhiot C, McCrindle BW.  Role of the waist/height ratio in the cardiometabolic risk assessment of children classified by body mass index.  J Am Coll Cardiol 2013;62: 742-751.
  96. Cossrow N, Falkner B.  Race/ethnic issues in obesity and obesity-related consequences.  J Clin Endocrin Metab 2004;89(6):2590-2594.
  97. Chan JCN, Malik V, Jia W et al.  Diabetes in Asia: epidemiology, risk factors and pathophysiology.  JAMA 2009;301(20):2129-2140.
  98. Shah RV, Murthy VL, Abbasi SA et al.  Visceral adiposity and the risk of the metabolic syndrome across body mass index: the MESA study.  J Am Coll Cardiol Imag 2014;7(12):1236-1238.
  99. Robins SJ, Lyass A, Zachariah JP, Massaro JM and Vasan RS. Insulin resistance and the relationship of dyslipidemia to coronary heart disease: the Framingham Heart Study. Arterioscler Thromb Vasc Biol. 2011;31:1208-14.
  100. Arslanian S, Suprasongsin C.Insulin sensitivity, lipids and body composition in childhood: is syndrome X present? J Clin Endocrinol Metab 1996;81:1058-1062.
  101. Srinivasan SR, Frontini MG, Berenson GS. Longitudinal changes in risk variables of insulin resistance syndrome from childhood to young adulthood in offspring of parents with type 2 diabetes: the Bogalusa Heart Study. Metabolism 2003;52(4):443-450.
  102. Steinberger J, Daniels SR. Obesity, insulin resistance, diabetes and cardiovascular risk in children. A scientific statement from the American Heart Association. Circulation 2003;107: 1448-1453.
  103. Zavaroni I, Alpi O et al.Evidence for an independent relationship between plasma insulin and concentration of high density lipoprotein cholesterol and triglyceride.  Atherosclerosis 1985; 55:259-266.  
  104. Lapur CN, Yost TJ, Eckel RH.Insulin responsiveness of adipose tissue lipoprotein lipase is delayed but preserved in obesity.  J Clin Endocrinol Metab 1984;59:1176-1182.
  105. Steinberger J, Moorehead C, Katch V et al.Relationship between insulin resistance and abnormal lipid profile in obese adolescents.  J Pediatr 1995;126(5 pt 1):690-695.
  106. Dabalea D, Mayer-Davis EJ, Saydah S et al. SEARCH for Diabetes in Youth Study.Prevalence of type 1 and type 2 diabetes among children and adolescents from 2001 to 2009.  JAMA 2014;311(17): 1778-1786.
  107. Bjornstad P, Eckel RH.Pathogenesis of lipid disorders in insulin resistance: A brief review.  Curr Diab Rep 2019; 127. Doi:10.1007/s11892-018-1101-6.
  108. Vajro P, Lenta S, Socha P et al. Diagnosis of nonalcoholic fatty liver disease in children and adolescents: position paper of the ESPGHAN Hepatology Committee.J Pediatr Gastroenterol Nutr 2012;54(5):700-713.
  109. Giorgio V, Prono F, Graziano F, Nobili V.Pediatric non-alcoholic fatty liver disease: old and new concepts on development, progression, metabolic insight and potential treatment targets.  BMC Pediatrics 2013;13:40-50.
  110. Berardis S, Sokal E.Pediatric non-alcoholic fatty liver disease: an increasing public health problem.  Eur J Pediatr 2014; 173: 131-139.
  111. Molleston JP, Schwimmer JB, Yates KP et al.Histological abnormalities in children with non-alcoholic fatty liver disease and normal or mildly elevated alanine aminotransferase levels.  J Pediatr 2014;164(4):707-713.
  112. Mann JP, Goonetilleke R, McKiernan P. Paediatric non-alcoholic fatty liver disease: a practical overview for non-specialists. Arch Dis Child. 2015 Jan 29. [Epub ahead of print].
  113. Fusillo S, Rudolph B.Nonalcoholic fatty liver disease. Pediatrics in Review 2015; 36(5): 198-206.
  114. Nobili V, Marcellini M, Devito R et al.NAFLD in children: a prospective clinical pathological study and effect of lifestyle advice.  Hepatology 2006;44:458-465.
  115. Alkhouri N, Carter-Kent C, Elias M, Feldstein AE.Atherogenic dyslipidemia and cardiovascular risk in children with nonalcoholic fatty liver disease.  Clin Lipidol 2011;6(3):305-314.
  116. Schwimmer JB, Ugalde-Nicalo P, Welsh JA et al.Effect of a low free sugar diet vs usual diet on nonalcoholic fatty liver disease in adolescent boys.  JAMA 2019;321(3):256-265.
  117. Pacifico L, Chiesa C, Anania C et al.Nonalcoholic fatty liver disease and the heart in children and adolescents.  World J Gatroenterol 2014;20(27):9055-9071.
  118. Than NN, Newsome PN. A concise review of non-alcoholic fatty liver disease. Atherosclerosis. 2015 Mar;239(1):192-202. Epub 2015 Jan 13.
  119. Reaven GM. Banting lecture 1988.Role of insulin resistance in human disease.  Diabetes 1988;37:1595-1607.
  120. Marchesisn G, Brizi M, Bianchi G et al.Nonalcoholic fatty liver disease: a feature of the metabolic syndrome.  Diabetes 2001;50(8):1844-1850.
  121. Beltran-Sanchez H, Harhay MO, Harhay MM et al. Prevalence and trends of metabolic syndrome in the adult U.S. population, 199-210. J Am Coll Cardiol 2013;62:697-703.
  122. Ford ES, Giles WH, Dietz WH. Prevalence of the metabolic syndrome among US adults: findings from the third National Health and Nutrition Examination Survey. JAMA 2002;287(3):356-359.
  123. Steinberger J, Daniels SR, Eckel RH et al.Progress and challenges in metabolic syndrome in children and adolescents: A scientific statement from the American heart Association.  Circulation 2009; 119:628-647.
  124. De Ferranti SD, Gauvreau K, Ludwig DS et al.Prevalence of the metabolic syndrome in American adolescents: findings from the third national health and nutrition survey.  Circulation 2004; 110:2494-2497.
  125. Morrison JA, Friedman LA, Gray-McGuire C.Metabolic syndrome in childhood predicts adult cardiovascular disease 25 years later: the Princeton Lipid Research Clinics Follow-up Study. Pediatrics 2007; 120:340-345.
  126. Steinberger J, Daniels SR. Obesity, insulin resistance, diabetes and cardiovascular risk in children.A scientific statement from the American Heart Association.  Circulation 2003;107: 1448-1453.
  127. Gidding SS, Stone NJ, Bookstein LC et al.Month-to-month variability of lipids, lipoproteins and apolipoproteins and the impact of acute infection in adolescents. J Pediatr 1998;133(2):242-246.
  128. Miller M, Stone NJ, Ballantyne C et al.Triglycerides and cardiovascular disease.  A scientific statement from the American Heart Association.  Circulation 2011;123::2292-2333.
  129. Type 2 diabetes in children and adolescents. American Diabetes Association. Diabetes Care 2000;23(3):381-389. Used prev?
  130. Epstein LH, Kuller LH, Wing RR, Valoski A, McCurley J. The effect of weight control on lipid changes in obese children. Am J Dis Child 1989;143(4):454-457.
  131. Nemet D, Barkan S, Epstein Y, Friedland O, Kowen G, Eliakim A. Short- and long-term beneficial effects of a combined dietary-behavioral-physical activity intervention for the treatment of childhood obesity. Pediatrics 2005;115(4):e443-e449.
  132. Becque MD, Katch VL, Rocchini AP, Marks CR, Moorehead C. Coronary risk incidence of obese adolescents: reduction by exercise plus diet intervention. Pediatrics 1988; 81(5):605-612.
  133. Reinehr T, Andler W.Changes in the atherogenic risk factor profile according to degree of weight loss.  Arch Dis Child 2004; 89:419-422.
  134. Kirk S, Zeller M, Claytor R et al.The relationship of health outcomes to improvement of BMI in children and adolescents.  Obes Res 2005;13:876-882.
  135. Ho M, Garnett SP, Baur LA et al.Impact of dietary and exercise interventions on weight change and metabolic outcomes in obese children and adolescents: a systematic review and meta-analysis of randomized trials.  JAMA Pediatr 2013; 167:759-768.
  136. Roberts CK.Combined diet and exercise interventions can improve metabolic outcomes in obese children, even with only small changes in weight.  Evid Based Med 2014;19:e9.
  137. Hobkirk JP, King RF, Davies I et al.The metabolic inter-relationships between changes in waist circumference, triglycerides, insulin sensitivity and small, dense low-density lipoprotein particles with acute weight loss in clinically obese children and adolescents. Pediatr Obes 2014;9(3): 209-217.
  138. Pieke B, von Eckardstein A, Gulbahce E, Chirazi A, Schulte H, Assmann G, Wahrburg U.Treatment of hypertriglyceridemia by two diets rich in unsaturated fatty acids or in carbohydrates: effects on lipoprotein subclasses, lipolytic enzymes, lipid transfer proteins, insulin and leptin.  Int J of Obesity 2000;24:1286-1296.
  139. Ohta T, Nakamura R, Ikeda Y, Hattori S, Matsuda I. Follow up study on children with dyslipidaemia detected by mass screening at 18 months of age: effect of 12 months dietary treatment. Eur J Pediatr 1993;152(11):939-943.
  140. Pereira MA, Swain J, Goldfine AB, Rifai N, Ludwig DS. Effects of a low-glycemic load diet on resting energy expenditure and heart disease risk factors during weight loss. JAMA. 2004 Nov 24;292(20):2482-90.
  141. Ebbeling CB, Leidig MM, Sinclair KB, Seger-Shippee LG, Feldman HA, Ludwig DS. Effects of an ad libitum low-glycemic load diet on cardiovascular disease risk factors in obese young adults. Am J Clin Nutr. 2005 May;81(5):976-82.
  142. Ebbeling CB, Leidig MM, Feldman HA, Lovesky MM, Ludwig DS.Effects of a low glycemic-load vs low fat diet in obese young adults.  JAMA 2007;297:2092-2102. 
  143. Ebbeling CB, Leidig MM, Sinclair KB, Hangen JP, Ludwig DS.A reduced glycemic load diet in the treatment of adolescent obesity.  Arch Pediatr Adolesc Med 2003;157:773-779.
  144. De Ferranti SR, Milliren CE, Denhoff ER et al. Providing food to treat adolescents at risk for cardiovascular disease.Obesity 2015; 23: 2109-2117.
  145. Sondike SB, Copperman N, Jacobson MS. Effects of a low-carbohydrate diet on weight loss and cardiovascular risk factors in overweight adolescents. J Pediatr 2003;142(3):253-258. 98.Kirk S, Brehm B,
  146. Saelens BE, Woo JG, Kissel E, D'Alessio D, Bolling C and Daniels SR. Role of Carbohydrate Modification in Weight Management among Obese Children: A Randomized Clinical Trial. J Pediatr. 2012;161:320-327.
  147. 147. Wooten JS, Biggerstaff KD and Ben-Ezra V. Responses of LDL and HDL particle size and distribution to omega-3 fatty acid supplementation and aerobic exercise. J Appl 2009;107:794-800.
  148. Siri-Tarino PW, Williams PT, Fernstrom HS, Rawlings RS and Krauss RM. Reversal of small, dense LDL subclass phenotype by normalization of adiposity. Obesity (Silver Spring). 2009;17:1768-75.
  149. Anderssen SA, Cooper AR, Riddoch C et al.Low cardiorespiratory fitness is a strong predictor for clustering of cardiovascular risk factors in children independent of country, age and sex.  Eur J Cardiovasc Prev Rehabil 2007;14:5526-531.
  150. Lobelo F, Pate RR, Dowda M et al.Cardiorespiratory fitness and clustered cardiovascular disease risk in US adolescents.  J Adolesc Health 2010;47:352-359.
  151. Ruiz JR, Ortega FB, Rizzo NS et al.High cardiovascular fitness is associated with a low metabolic risk score in children: the European Youth Heart Study.  Pediatr Res 2007:61:350-355.
  152. Kelley GA, Kelley KS.Aerobic exercise and lipids and lipoproteins in children and adolescents: a meta-analysis of randomized controlled trials.  Atherosclerosis 2007;191:447-453.
  153. Ferguson MA, Gutin B, Le NA, Karp W, Litaker M, Humphries M, Okuyama T, Riggs S, Owens S. Effects of exercise training and its cessation on components of the insulin resistance syndrome in obese children. Int J Obes Relat Metab Disord 1999;23(8):889-895.
  154. Kang HS, Gutin B, Barbeau P, Owens S, Lemmon CR, Allison J, Litaker MS, Le NA. Physical training improves insulin resistance syndrome markers in obese adolescents. Med Sci Sports Exerc 2002;34(12):1920-1927.
  155. Escalente Y, Saavedra JM, Garcia-Hermoso A et al.Improvement of the lipid profile with exercise in obese children: a systematic review.  Prev Med 2012; 54:293-301.
  156. Janssen I, LeBlanc AG.Systematic review of the health benefits of physical activity and fitness in school-aged children and youth.  Int J Beh Nutr Phys Activity 2010; 7: 40-56.
  157. Guidelines for Physical Activity in Americans. U.S. Department of Health and Human Services. Centers for Disease Control and Prevention. Division of Nutrition, Physical Activity, and Obesity. Office of Disease Prevention and Health Promotion. 2008. http://www.health.gov/PAGuidelines/
  158. Davis CL, Pollock NK, Waller JL et al.Exercise dose and diabetes risk in overweight and obese children. A randomized controlled trial. JAMA 2012;308(11):1103-1112.
  159. Hansen BHAnderssen SAAndersen LB et al. Cross-sectional associations of reallocating time between sedentary and active behaviors on cardiometabolic risk factors in young people: an International Children's Accelerometry Database (ICAD) analysis. Sports Med.2018 Oct;48(10):2401-2412. doi: 10.1007/s40279-018-0909-1.
  160. 160. Laitinen TT, Pahkala K, Magnussen CG, Viikari JS, Oikonen M, Taittonen L, Mikkila V, Jokinen E, Hutri-Kahonen N, Laitinen T, Kahonen M, Lehtimaki T, Raitakari OT and Juonala M. Ideal cardiovascular health in childhood and cardiometabolic outcomes in adulthood: the Cardiovascular Risk in Young Finns Study. Circulation. 2012;125:1971-8.
  161. 161. Nordstrand N, Gjevestad E, Hertel JK, Johnson LK, Saltvedt E, Roislien J and Hjelmesaeth J. Arterial stiffness, lifestyle intervention and a low-calorie diet in morbidly obese patients-a nonrandomized clinical trial. Obesity (Silver Spring). 2013;21:690-7.
  162. 162. Dengo AL, Dennis EA, Orr JS, Marinik EL, Ehrlich E, Davy BM and Davy KP. Arterial destiffening with weight loss in overweight and obese middle-aged and older adults. Hypertension. 2010;55:855-61.
  163. Kelly AS, Wetzsteon RJ, Kaiser DR, Steinberger J, Bank AJ, Dengel DR.Inflammation, insulin, and endothelial function in overweight children and adolescents: the role of exercise. J Pediatr 2004;145:731-736.
  164. 164. Wunsch R, de Sousa G, Toschke AM and Reinehr T. Intima-media thickness in obese children before and after weight loss. Pediatrics. 2006;118:2334-40.
  165. Meyer AA, Kundt G, Lenschow U et al.Improvement of early vascular changes and cardiovascular risk factors in obese children after a six-month exercise program.  J Am Coll Cardiol 2006;48:1865-1870.
  166. Whitlock EP, O’Connor EA, Williams SB et al.Effectiveness of weight management interventions in children: a targeted systematic review for the USPSTF.  Pediatrics 2010;125: e396-e418.
  167. 167. Pratt RE, Kavey RE and Quinzi D. Combined dyslipidemia in obese children: response to a focused lifestyle approach. J Clin Lipidol 2014; 8(2): 181-186.
  168. 168. Ekelund U, Luan J, Sherar LB, Esliger DW, Griew P and Cooper A. Moderate to vigorous physical activity and sedentary time and cardiometabolic risk factors in children and adolescents. JAMA. 2012;307:704-12.
  169. Mello MT, de Piano A, Carnier J et al. Long-term effects of aerobic plus resistance training on the metabolic syndrome and adiponectinemia in obese adolescents. J Clin Hypertens 2011; 13:343-350.
  170. Monzavi R, Dreimane D, Geffner ME et al. Improvement in risk factors for metabolic syndrome and insulin resistance in overweight youth who are treated with lifestyle intervention. Pediatrics 2006;117(6):1111–1118
  171. Szamosi A, Czinner A, Szamosi T et al. Effect of diet and physical exercise treatment on insulin resistance syndrome of schoolchildren. J Am Coll Nutr 2008; 27(1):177–183
  172. Caranti DA, de Mello MT, Prado WL et al. Short- and long-term beneficial effects of a multidisciplinary therapy for the control of metabolic syndrome in obese adolescents. Metabolism 2007; 56(9):1293–1300
  173. Chen AK, Roberts CK, Barnard RJ. Effect of a short-term diet and exercise intervention on metabolic syndrome in overweight children. Metabolism 2006; 55(7):871–878
  174. Kasprzak Z, Pilaczyńska-Szcześniak L (2010) Effect of diet and physical activity on physiological and biochemical parameters of obese adolescents. Acta Sci Pol Technol Aliment 2010; 9(1):95–104
  175. Katzmarzyk PT, Leon AS, Wilmore JH et al. Targeting the metabolic syndrome with exercise: evidence from the HERITAGE family study. Med Sci Sports Exer 2003; 35(10):1703–1709
  176. Monzavi R, Dreimane D, Geffner ME et al. Improvement in risk factors for metabolic syndrome and insulin resistance in overweight youth who are treated with lifestyle intervention. Pediatrics 2006;117(6):1111–1118
  177. Pedrosa C, Oliveira BM, Albuquerque I et al. Metabolic syndrome, adipokines and ghrelin in overweight and obese schoolchildren: results of a 1-year lifestyle intervention programme. Eur J Pediatr 2011;170(4):483–492
  178. Caranti DA, de Mello MT, Prado WL et al. Short- and long-term beneficial effects of a multidisciplinary therapy for the control of metabolic syndrome in obese adolescents. Metabolism 2007; 56 (9):1293–1300.
  179. Tsiros MD, Sinn N, Brennan L. Cognitive behavioral therapy improves diet and body composition in overweight and obese adolescents. Am J Clin Nutr 2008; 87:1134–1140.
  180. Bianchini JA, da Silva DF, Nardo CC et al.Multidisciplinary therapy reduces risk factors for metabolic syndrome in obese adolescents.   Eur J Pediatr 2013;172(2):215-221.
  181. Pontrelli L, Parris W, Adeli K and Cheung RC. Atorvastatin treatment beneficially alters the lipoprotein profile and increases low-density lipoprotein particle diameter in patients with combined dyslipidemia and impaired fasting glucose/type 2 diabetes. Metabolism. 2002;51:334-42.
  182. 182. Hongo M, Kumazaki S, Izawa A, Hidaka H, Tomita T, Yazaki Y, Kinoshita O and Ikeda U. Low-dose rosuvastatin improves arterial stiffness in high-risk Japanese patients with dyslipdemia in a primary prevention group. Circ J. 2011;75:2660-7.
  183. Cholesterol Treatment Trialists’ Collaboration. Efficacy and safety of LDL-lowering therapy among men and women: meta-analysis of individual data from 174 000 participants in 27 randomised trials. The Lancet, January 2015.Published online 1/8/2015.
  184. 184. van der Graaf A, Rodenburg J, Vissers MN, Hutten BA, Wiegman A, Trip MD, Stroes ES, Wijburg FA, Otvos JD and Kastelein JJ. Atherogenic lipoprotein particle size and concentrations and the effect of pravastatin in children with familial hypercholesterolemia. J Pediatr. 2008;152:873-8.
  185. 185. Nozue T, Michishita I, Ito Y and Hirano T. Effects of statin on small dense low-density lipoprotein cholesterol and remnant-like particle cholesterol in heterozygous familial hypercholesterolemia. J Atheroscler Thromb. 2008;15:146-53.
  186. de Jongh S, Lilien MR, op't Roodt J, Stroes ES, Bakker HD and Kastelein JJ. Early statin therapy restores endothelial function in children with familial hypercholesterolemia. J Am Coll Cardiol. 2002;40:2117-21.
  187. Wiegman A, Hutten BA, de Groot E, Rodenburg J, Bakker HD, Buller HR, Sijbrands EJ and Kastelein JJ. Efficacy and safety of statin therapy in children with familial hypercholesterolemia: a randomized controlled trial. JAMA. 2004;292:331-7.
  188. Vuorio A, Kuoppala J, Kovanen PT et al.Statins for children with familial hypercholesterolemia.  Cochrane Database Syst Rev 2014; 23;7: CD006401.
  189. Luirink IK, Wiegman A, Kusters DM et al.20-Year Follow-up of Statins in Children with Familial Hypercholesterolemia. N Engl J Med 2019; 381:1547-1556. DOI: 10.1056/NEJMoa1816454
  190. Current Studies - Studies - Pediatric Heart Network. www.pediatricheartnetwork.org › Studies › CurrentStudies
  191. Goldberg RB, Sabharal AK.Fish oil in the treatment of dyslipidemia.  Current Opin Endocrinol Diabetes and Obes 2008;15:167-174.
  192. DeCaterina R.n-3 fatty acids in cardiovascular disease.  N Engl J Med 2011; 364:2439-2450.
  193. Risk Prevention Study Collaborative Group. Roncaglioni MC, Tombesi M, Avanzini F et al.n-3 fatty acids in patients with multiple cardiovascular risk factors.  N Engl J Med 2013; 368:1800-1808.
  194. Abdelhamid AS, Brown TJ, Brainard JS et al. Omega 3 fatty acids for the primary and secondary prevention of cardiovascular disease. Cochrane Database of Systematic Reviews 2018, Issue 7. Art. No.: CD003177. DOI: 10.1002/14651858.CD003177.pub3.
  195. Gidding SS, Prospero C, Hossain J et al.A double-blind randomized trial of fish oil to lower triglycerides and improve cardiometabolic risk in adolescents. J Pediatr 2014;165:497-503.
  196. de Ferranti SD, Milliren CE, Denhoff ER et al.Using high dose omega-3 fatty acid supplements to lower triglyceride levels in 10- to 19-year-olds.  Clin Pediatr(Phila) 2014;53(5):428-438.
  197. Abourbih S, Filion KB, Joseph L et al.Effect of fibrates on lipid profiles and cardiovascular outcomes: A systematic review.  Amer J Med 2009;122:962-980.
  198. 198. Guerin M, Bruckert E, Dolphin PJ et al. Fenofibrate reduces plasma cholesterol ester transfer from HDL to VLDL and normalizes the atherogenic dense LDL profile in combined hyperlipidemia.  Arterioscler Thromb Vasc Biol 1996;16:763-772.
  199. Wheeler KAH, West RJ, Lloyd JK, Barley J. Double blind trial of bezafibrate in familial hypercholesterolaemia. Arch Dis Child 1985;60(1):34-37.
  200. Steinmetz J, Morin C, Panek E, Siest G, Drouin P. Biological variations in hyperlipidemic children and adolescents treated with fenofibrate. Clinica Chemica Acta. 1981;112:43–53.
  201. Becker M, Staab D, Von Bergmann K. Long-term treatment of severe familial hypercholesterolemia in children: effect of sitosterol and bezafibrate. Pediatrics. 1992;89:138–42.
  202. Smalley CM, Goldberg SJ. A pilot study in the efficacy and safety of gemfibrozil in a pediatric population. J Clin Lipidol 2008;2:106–11.
  203. Pastori D, Polimeni L, Baratta F et al.The efficacy and safety of statins for the treatment   of non-alcoholic fatty liver disease.  Digestive and Liver Disease 2015; 47: 4-11.
  204. Bhatt D, Steg G, Miller M et al.Cardiovascular risk reduction with Icosapent Ethyl for hypertriglyceridemia.  NEJM 2019; 380(1): 11-22.


Pediatric Endocrinology- A Tropical Perspective

ABSTRACT


Pediatric endocrine disorders are frequently seen in tropical countries. While broadly the spectrum of pediatric endocrine disorders in the tropics is not entirely different from that seen in other parts of the world, some aspects of these disorders are unique to the tropics. Many pediatric endocrine disorders are underreported from the tropics, presumably because of limited access to medical care in terms of both diagnostic and therapeutic facilities. Lack of formal training of pediatricians and physicians in pediatric endocrinology may be a contributor. Some conditions such as exogenous Cushing syndrome are seen very frequently in tropics because of easy access and unrestrained use of glucocorticoids by quacks/ faith healers. Malnutrition is an important contributor to short stature in many tropical countries where a large section of the population is living in abject poverty. Iodine deficiency disorders are seen in many countries despite iodine fortification of salt or other edible items. Lack of universal screening for congenital hypothyroidism often leads to late detection of this disorders contributing to significant morbidity and mortality. Vitamin D deficiency and nutritional rickets is rampant even in areas where sunlight is abundant year around. Since most of the pediatric endocrine disorders are easily treatable and can have severe consequences when diagnosis or treatment is delayed, increasing the awareness of these disorders in the healthcare workers in the tropics is necessary.


PITUITARY DISEASE


The common pituitary disorders reported from the tropics include craniopharyngiomas, growth hormone deficiency, pituitary adenomas (including prolactinomas), and Cushing’s disease.

Craniopharyngiomas

Craniopharyngiomas are common suprasellar tumors in childhood.  A retrospective analysis of 62 pediatric (onset <18 years) craniopharyngiomas was reported from a tertiary care hospital from India. The presenting features included central diabetes insipidus (6.5%), central hypothyroidism (43.5%), secondary adrenal insufficiency (32%), and delayed puberty (24%). On follow up 90% had some form of anterior pituitary deficiency and 22.6% developed obesity. GH therapy was given to 14% of cases.  Incomplete  surgical removal was frequent and radiotherapy was used in many cases (1). Another study from Egypt reported 137 patients with pediatric craniopharyngiomas. They were treated with surgery alone (65), radiotherapy after surgery (71), or surgery for Ommaya insertion with intracystic interferon injection (1). Subtotal resection was seen in 58 patients (42.33%) while 48 cases (35.04%) had gross total resection/near total resection. The  5-year progression-free survival (PFS) was 52.3%, ( surgery alone 34.49% and  radiotherapy after surgery  72.25% ) (2). Both craniopharyngiomas and gliomas were most common supratentorial pediatric brain tumors in Nigeria (3). In a study of 37 pediatric craniopharyngiomas who underwent surgery, gross total resection was possible in 43.2%, near total resection in six patients 16.2%.  and subtotal resection (STR) in 40.5%. The recurrence-free survival rate was 81.1% and 70.3% at 5- and 10-year follow-up, respectively. Diabetes insipidus, anterior pituitary hormone deficits, and obesity were common in follow up (4). In a study from Pakistan, craniopharyngiomas were 14.3% of the reported pediatric intracranial tumors (5). Another study from Pakistan has reported the use of gamma knife radiosurgery in craniopharyngiomas. The patients included 17 children. Nearly 80% of the patients achieved tumor control with gamma knife (6). An uncommon variant called papillary craniopharyngiomas  has been reported in 13 cases from Pakistan (7).

Isolated growth hormone deficiency (IGHD) and combined pituitary hormone deficiency (CPHD) are the two presentations of growth hormone (GH) deficiency. The mutations involved in IGHD are GH1 and GHRHR while CPHD is associated with mutations in transcription factor genes PROP1POU1F1, and HESX1. Genetic analysis performed in 51 patients with CPHD at a tertiary care center in India reported that 10 (20%) patients had POU1F1 and PROP1 mutations and of these 5 were novel and 2 previously reported. No mutations were identified in HESX1 (8).

A study of growth hormone deficient patients from South India reported that smaller pituitary size was associated with worse height deficits and bone age delays. However, they had a  better response to GH therapy (9).

Children with IGHD had several biochemical and cardiac parameters that may be associated with an increased CVD risk in later life. This included higher waist-hip-ratio, total cholesterol, non-high-density lipoprotein-cholesterol, serum homocysteine, C-reactive protein (CRP), and pro-brain natriuretic peptide (pro-BNP). Left ventricular mass (LVM) and interventricular septal thickness were significantly lower (10).

A novel POU1F1 c.605delC mutation in combined pituitary hormone deficiency (CPHD) was identified by Sanger sequencing carried out in 160 trios and 100 controls. In vitro studies showed that the this mutation codes for a truncated protein with reduced transactivation capacity on downstream targets like  growth hormone (GH) and prolactin (PRL) (11).

Laron dwarfism first reported among Israeli Jewish children is a rare disorder characterized by low IGF-1 and high GH levels. A case series of nine such cases (6 male, 3 female) was reported from South India. The short stature was extreme with a mean height Z score of 7.7 (SD 0.8).  Clinical features included characteristic facial features, microcephaly, micropenis and developmental delay. All children had typical hormonal profile of low IGF-1 and elevated GH (12). Laron syndrome has been reported from Africa and South America (13)(14)(15).


Pituitary Adenomas

While adult pituitary tumors are relatively common, pediatric pituitary adenomas (PPA) are less common. A retrospective study of 74 cases of PPA was published from a center in North India. The median age was 15 years and 42 % were females. Headache and menstrual abnormalities were common presentations. Corticotroph adenomas (32.4%) and somatotropinomas (25.7%) were among the common types. TSHoma and pituitary blastomas were very few. In 81% cases, transsphenoidal surgery was performed while adjuvant medical management and radiotherapy was required in 25% and 18% respectively. Remission rates in Cushing's and acromegaly were 62.5% and 57.8%, respectively, and post operative hormone deficits were seen in 33% (16).

Giant prolactinoma (GP) are rare pituitary tumors in childhood and adolescence. A series of 18 cases of GP has been reported from India. GP constituted 20% of pediatric prolactinomas at this center. The authors conducted a systematic review including these 18 and 77 other cases from the literature. They found a male predominance with pubertal arrest/delay. Dopamine agonist (DA)  monotherapy showed good results as monotherapy (17).


Cushing’s Disease

Cushing’s disease is an important cause of hypercortisolism in children. It is caused by an ACTH secreting pituitary adenoma. A retrospective study of 48 pediatric cases of Cushing’s disease who underwent transsphenoidal adenectomy between 1998 and 2008 was published from India. Weight gain, round facies, and short stature were the most common clinical manifestations. Low dose dexamethasone suppression test and midnight cortisol showed 100% sensitivity for establishing hypercortisolism, while midnight ACTH had 100% sensitivity for confirming ACTH dependence. Magnetic resonance imaging and unstimulated BIPSS were used to confirm Cushing’s disease. Post surgical remission was 56% after first transsphenoidal adenectomy with higher remission rate of 75% in those with microadenoma. Eight patients were given radiotherapy and four of these achieved remission (18).

GROWTH AND PUBERTAL DISORDERS

Short stature and delayed puberty are commonly seen in children visiting pediatric endocrine clinics in the tropics.

Short Stature

Malnutrition, systemic illnesses, endocrine disorders, and syndromic disorders are among the major causes of short stature in the tropics.


MALNUTRITION

Malnutrition in early childhood is an important cause of short stature in tropical counties. The role of early childhood undernutrition on physical growth and cognitive achievement was assessed in a nationwide population-based cohort study in India. Data on undernutrition was taken from Human Development Survey (IHDS) in 2004 to 2005 while the outcomes on physical and cognitive outcomes during preadolescent (8 to 11 years) years was assessed in 2011 to 2012. The study assessed 7868 children and 4334 were undernourished. Undernourished children had 1.73 times increased odds of short stature. It was associated with decreased odds of achieving a higher reading and arithmetic outcomes. The findings were worse in female children.(19)

SYNDROMIC SHORT STATURE AND OTHER CAUSES

Noonan syndrome (NS), an autosomal dominant disorder, is caused by mutations in genes associated with the RAS / mitogen-activated protein kinase (MAPK) pathway. A large series of 363 patients with Noonan’ syndrome was published from India. The exons of PTPN11 gene were sequenced in all patients. Congenital cardiac anomalies (mostly right sided defects) were present in 84% of patients. The downward-slanting palpebral fissures, hypertelorism, low-set posteriorly rotated ears, short stature, pectus excavatum, and unilateral or bilateral cryptorchidism were common clinical findings. The most common variants in this series were in exon 8 (c.922A > G, c.923A > G), observed in 22 of the affected. Thirty-two previously described pathogenic variants in eight different exons in PTPN11 gene were detected in 107 patients (20). Similar findings were reported from a study in Morocco (21). Noonan syndrome has been described in Latin America, Africa and other countries in Asia. The facial characteristics of Noonan syndrome cases worldwide  were similar to those of European descent (22).

Achondroplasia is a skeletal dysplasia that is a common cause of disproportionate short stature. In a study of forty cases with disproportionate short stature from India , achondroplasia was the most common skeletal dysplasia with  c. 1138 G>A, p. Gly380Arg mutation seen in all cases (23). Achondroplasia has been reported from Pakistan and Africa also (24,25).

Idiopathic short stature (ISS)refers to the short stature where all the conventional clinical and biochemical work up is normal. Genetic studies in 61 patients with ISS in India showed that four patients had a heterozygous variant in SHOX gene while two had novel, likely pathogenic variants, in the IGFALS gene (26).

Thalassemia is a frequent cause of short stature and pubertal delay. Inadequate chelation therapy and lack of awareness among treating physicians on endocrine complications lead to higher prevalence of undiagnosed endocrine issues in these children. In a study from central India, short stature (88%), delayed puberty (71.7%), hypothyroidism (16%), and diabetes mellitus (10%), were reported in children with thalassemia (88).

Puberty


Pubertal disorders can be broadly classified as delayed puberty and early (precocious puberty). Secular trends of gradual reduction in the age of puberty have started becoming apparent in tropics.


The age of normal puberty has shown a decline in many tropical countries- a trend which mimics that witnessed in the developed world decades earlier. Data regarding normal puberty from Egypt suggests that in girls with BMI ≥85th percentile all pubertal stages started earlier as compare to girls with BMI less than 85th centile. No such association between BMI and pubertal stage was noticed in males (27). A decline in the age of pubertal maturation of girls in Nigeria was also reported. The median age at beginning of breast maturation (B2) and menarche were 9 and 12 years respectively. The age at menarche was significantly associated with overweight/obesity and high social class (28). Similar findings have been reported from India where a study of 2010 school girls reported that median age of thelarche and menarche was 10.8 and 12.4 years with obese girls showing a six month earlier onset of thelarche and menarche when compared to those with normal BMI (29). Similar findings were reported from Western India (30). School girls in Riyadh, Saudi Arabia also had earlier onset of puberty similar to that seen developed countries (31).

DELAYED PUBERTY

Delayed puberty is a common pubertal disorder. It may be a normal variant such as constitutional delay in growth and puberty or represent a pathology. Pathological causes are classified as hypogonadotropic or hypergonadotropic hypogonadism. In a retrospective study of 136 patients with delayed puberty from Sudan, permanent or functional hypogonadotropic hypogonadism was seen in 37.5 and 36% while hypergonadotropic hypogonadism was seen in 11.7%. Constitutional delay in growth and puberty was present in 14.7%. Type 1 diabetes and celiac disease were common systemic illnesses (32). A study of 42 cases of delayed puberty from India (19 boys, 23 girls) underlying systemic illnesses were the dominant cause of pubertal delay in girls (11/23) while the major cause in boys were endocrinopathies (6/19). Malnutrition, chronic infections, and anemia were common systemic illnesses (33).

An unusual association of hypopituitarism along with Turner syndrome was reported in six Tunisian patients (34).  A study of 11 Turner syndrome patients was reported from Cameroon, seven had monosomy while four had mosaic Turner syndrome. Most of these had presented with delayed puberty or short stature. Other clinical features were short neck, forearm carrying-angle deformity, a low hairline, and a webbed neck. Horse shoe kidney was found in two cases but none had cardiac abnormalities. The average age at diagnosis was 18.4 years indicating a delay in the diagnosis (35).

Differentiation between CDGP and hypogonadotropic hypogonadism is challenging in tropical countries. Most patients do not have regular height measurements and estimation of growth velocity in the years preceding to the presentation is often not possible. GnRH stimulation test has been employed but has limited utility because of significant overlap in the hormonal levels between the two groups. GnRHa-stimulated inhibin B (GnRH-iB) has been developed as a convenient test to differentiate between CDGP and hypogonadotropic hypogonadism. A cut-off value of 113.5 pg/ml in boys and 72.6 pg/ml in girls could  predict  spontaneous pubertal onset with  100% sensitivity and specificity (36).

PRECOCIOUS PUBERTY

Precocious puberty is a common pubertal disorder. It is classified as central precocious puberty (caused by premature activation of the hypothalamic-pituitary-gonadal axis) or peripheral precocious puberty (due to secretion of gonadal steroids from other causes without activation of the hypothalamic-pituitary-gonadal axis).

A retrospective analysis of 55 children (36 girls) with precocious puberty was reported from India. Central precocious puberty occurred in 62% (34 cases, out of which 19 were idiopathic) while peripheral precocious puberty was found in 14 children. The  commonest cause of peripheral precocious puberty  was congenital adrenal hyperplasia (46%) (37). A rare case of precocious pseudopuberty due to a virilizing adrenocortical carcinoma progressing to central precocious puberty after surgery has also been reported (38). Idiopathic precocious puberty responds well to GnRH analogue therapy as reported from a series for India (39).

There appears to be an increase in the incidence of central precocious puberty especially in girls in the COVID-19 lockdown in India as compared to the pre-lockdown period (40).

DISORDERS OF BONE AND MINERAL METABOLISM

Vitamin D deficiency and nutritional rickets are very common in tropics.  Primary hyperparathyroidism and less common forms of rickets like vitamin D resistant and hypophosphatemic rickets also occur.


Vitamin D Deficiency And Nutritional Rickets

Tropical countries have high prevalence of nutritional rickets. The human body can generate vitamin D in the skin from sunlight. Although tropical countries get abundant sunlight, vitamin D deficiency (VDD) is common. Harsh summers limit sunlight exposure in many tropical countries. Adequate sunlight exposure was found in only 27 % neonates in Ethiopia (41). In some countries, atmospheric pollutions limits sunlight penetration in winters (42). Darker skin color with high melanin content, different socio-cultural factors, and genetic variation also contribute to vitamin D deficiency. Infants are at a high risk of vitamin D deficiency which could be due to low vitamin D content in breastmilk, and inadequate vitamin D content of complementary foods and maternal vitamin D deficiency. Routine vitamin D supplementation  at a dose of 400 IU per day till 12 months of age in breastfed infants has been recommended in India (43). Oral vitamin D  supplementation of mothers during lactation has been shown to reduce risk of vitamin D deficiency in infants at 6 months of age by almost 95% (44). Nationwide data from India suggests that prevalence of vitamin D deficiency defined as serum 25OHD <12 ng/ml was 14% (1-4 years), 18% (5- 9 years), and 24%  (10-19 years) (43). However, VDD  prevalence ranging from 60-87 % has been reported in low birth weight infants and 71-88% in normal birth weight infants in Delhi, India (45) (46). In Uganda, a study found that prevalence of VDD in LBW infants was 12.1 % but most of these had received supplemental vitamin D (47). A larger study including five countries from sub-Saharan Africa, showed that prevalence of vitamin D deficiency in children aged 0-8 years was 7.8% (48). Countries closed to the Equator had less VDD. In India, a study from the state of Kerala reported a VDD prevalence of 11.1%. The reasons implicated for this relatively lower prevalence were latitude and fish intake in the diet (49). Data suggests that in several African countries nutritional rickets is common although VDD prevalence is not high. Children requiring surgical correction of deformities resulting from rickets in Malawi, Africa had lower dietary calcium intake but VDD was uncommon (50). Low dietary calcium intake has been implicated as a causative factor for rickets in Studies from Nigeria and Bangladesh (51,52). Serum alkaline phosphatase has been explored as a low-cost biochemical test to screen for nutritional rickets in children in Nigeria. A cut off of ALP > 350 U/L has been proposed in one study (53).Severe vitamin D deficiency can present as osteomalacic myopathy in children and adolescents (54).

For the treatment of  rickets and vitamin D deficiency, oral cholecalciferol in a daily dosing schedule (2000 IU below 1 year of age and 3000 IU in older children) for 12 weeks has been recommended by some Indian guidelines (43). However, compliance issues are common in underprivileged populations. When compliance to daily dosing cannot be ensured, this guideline has suggested intermittent regimen provided the child is above 6 months of age. Sunlight exposure was shown to be inferior to oral vitamin supplementation (400IU/day) in preventing rickets or vitamin D deficiency in infants in India (55). A single intramuscular dose of 600,000 IU of vitamin D has shown to be safe and effective for treatment of nutritional rickets in India (56).

Primary Hyperparathyroidism

Pediatric primary hyperparathyroidism (PHPT)has been reported in two studies from India. George et al performed a retrospective analysis of 15 children and adolescents with PHPT (age <20 yr.) between 1993 and 2006. The mean age was 17.7 (range 13-20 years) with 80% of patients being female. Clinical features included bone pain, proximal myopathy, bony deformities, fractures, palpable osteitis fibrosa cystica, nephrolithiasis, and acute pancreatitis. No cases had evidence of multiple endocrine neoplasia. Nearly a third of the cases developed post-operative hungry bone syndrome occurred in 33.3%. Histology was suggestive of parathyroid adenoma in all cases (57). Sharanappa et al reported retrospective data (September 1989-August 2019) of 35 pediatric PHPT patients (< 18 years) who underwent parathyroidectomy. The mean age was 15.2±2.9 years and with male to female ratio of 1:1.9. Skeletal manifestations were seen in 83% while renal manifestations occurred in 29%. Parathyroid adenoma was present in 91.4% patients, whereas the remaining had hyperplasia. Except one patients all others had  hungry bone syndrome in postoperative period (58). Adolescent PHPT can present as posterior reversible encephalopathy syndrome (59). Neonatal severe hyperparathyroidism is a rare disorder. One such case has been reported from India (60).


Other Forms Of Rickets

A case series of 36 patients with refractory rickets published from India reports that renal tubular acidosis (63%), vitamin D dependent rickets (14 %) (VDDR I in 2 and VDDR II in 3 patients), chronic renal failure (11%), hypophosphatemic rickets  (6 %), and chronic liver disease (6%) were common causes (61). Pseudohypoparathyroidism may also present with bony deformities resembling rickets (62). Hereditary vitamin-D resistant rickets was reported in eight patients in Tunisia. Two mutations in vitamin D receptor gene were found: p.K45E (5 patients with alopecia) and a novel p.T415R mutation located in the ligand-binding domain.

X linked hypophosphatemic rickets is the most common cause of phosphopenic rickets. It can be caused by loss of function mutations in the PHEX gene which leads to an increase in the phosphaturic hormone fibroblast growth factor-23 (FGF-23). Two novel mutations in the PHEX gene has been reported from two families from India (63). A family suffering from XLH has been reported from Pakistan (64). Idiopathic tumoral calcinosis (ITC) refers to the deposition of calcium hydroxyapatite crystals or amorphous calcium usually in juxta-articular tissue in a tumor-like fashion. ITC has been reported in  an 8-year-old child who had the symptoms  at 4 years of age (65).

THYROID

Common thyroid disorders in pediatric age group include hypothyroidism, iodine deficiency disorders, thyroiditis, and thyroid cancer

Congenital Hypothyroidism

Congenital hypothyroidism can be a devastating disease if not diagnosed and treated on time. Congenital hypothyroidism is much more common in tropical countries as compared to developed world. The prevalence in India is estimated to be one in 1000-1500 births (66). The Indian Society for Pediatric and Adolescent Endocrinology (ISPAE) has published guidelines on  screening, diagnosis, and management of congenital hypothyroidism (66,67). High prevalence of CH has been reported from Sri Lanka as well as Iran (68,69).  A cut off of ≥20 mIU/L for capillary TSH screening for CH  beyond 24 hours of life has been proposed in the India for deciding on recalling the patient for further workup while a repeat capillary sample was advised for TSH values between 10 and 20  mIU/L (70).

Despite the above research, most tropical countries do not have universal screening for CH. This contributes to significant morbidity due to this potentially treatable condition.

Iodine Deficiency Disorder

Iodine deficiency disorders are among the top causes of thyroid disease worldwide. Several tropical countries are affected by IDD. India and Pakistan have both initiated fortification of common salt with iodine. This measure has been successful in reducing total goiter rate in children, indicating an improvement in iodine status. However, several underprivileged populations in both countries have evidence of iodine deficiency (71,72). Africa also had a high prevalence of mild to moderate iodine deficiency but several iodine fortification programs have been started which resulted in improvement in the overall iodine status. Some high risk populations such as pregnant females may still face iodine deficiency (73).

Thyroiditis

A case series of 97 children with Hashimoto’s thyroiditis aged 5-12 years has been reported from India. The children were followed up for a six-month period.  Goiter was seen in 89 while eight had an atrophic form. The mean age was 9.9 years and the male to female ratio was 1:5.4. Overt hypothyroidism was present in 73.4% while hyperthyroidism was seen in 3.1%.  13.2 % were subclinical hypothyroidism and 10.3% were euthyroid. A large percentage of subclinical hypothyroid and euthyroid children developed overt hypothyroidism in the 6 month follow up. (79)

It is possible that the prevalence of autoimmune thyroiditis has increased after iodine fortification of the diet. In a case control study, 43 children with goiter and autoimmune thyroiditis were compared with 43 children with euthyroid goiter without autoimmune thyroiditis. Urinary iodine concentration (UIC) was significantly higher in children with autoimmune thyroiditis. A positive correlation between UIC and antimicrosomal antibody titers was found. A UIC  ≥300 μg/L  was strongly associated with autoimmune thyroiditis (80).

Hypothyroidism


Acquired hypothyroidism in most tropical countries is now predominantly autoimmune, barring those where severe iodine deficiency is still prevalent.

The control of hypothyroidism with levothyroxine therapy in children in tropical countries is often poor because of poverty, lack of proper advice, and reduced access to laboratory testing. Research work on treatment of hypothyroidism is being done.  Both bedtime and early morning intake of thyroxine had equal efficacy in maintaining a normal TSH in children with hypothyroidism in a randomized controlled trial from North India (78).

Van Wyk Grumbach syndrome is a syndrome characterized by prolonged untreated hypothyroidism, short stature, and isosexual precocious puberty. This syndrome is considered to be rare with very few cases reported so far in recent times. However, many cases of Van Wyk Grumbach have been reported from tropical countries like India and Sri Lanka (74,75,76). A case series of this rare syndrome has been reported from Pakistan (77). This illustrates that availability of trained physicians as well as laboratory facilities is still a challenge in tropical countries.

Hyperthyroidism

Pediatric hyperthyroidism has been reported in the tropics. Graves’ disease is the most common cause of pediatric hyperthyroidism. The factors differentiating pediatric Graves from adult disease are predominance of neuropsychiatricsymptoms, gradual and often insidious onset, and absence of infiltrative ophthalmopathy.

In a seven-year period, 24 children with hyperthyroidism were reported in a study from India.  Twenty of these had Graves’ disease while one had toxic nodular goiter and one had neonatal Graves’ disease while the remaining two were factitious. Behavioral problems, excitability, hyperkinesis, and irritability were most common symptoms. Ocular involvement was present in 85% while 30 % had cardiac involvement. Goiter was noted in 18 out of 24 cases. Carbimazole was used for treatment and remission occurred in seventeen cases (81). Neonatal thyrotoxicosis has been reported from India (82).

A case of a three and a half-year-old boy who had an  autonomous functioning thyroid nodule which was cured by radioiodine ablation has been reported from India (83). Radioiodine therapy has been used for pediatric and adolescent Graves’ disease. Carbimazole therapy does not appear to influence the outcome of radioiodine therapy (84). Thyroid storm precipitated by empyema thoracis has been reported in a 16 year old girl (85).

Thyroid Cancer

Thyroid cancer is not common in pediatric populations and usually occurs as papillary carcinoma (PTC). A publication from a oncology center in India reports that pediatric differentiated thyroid cancer has high rates of extrathyroidal involvement as well as lymph node and distant metastasis (86). These findings however are not unique to tropical countries as similar profile has been reported from other parts of the world. Pediatric PTC often do not have TERT  promoter mutations and have a lower prevalence of BRAFV600E mutation as reported in a study from India (87). Globally, the mortality rates of pediatric PTC are similar to that of adult PTC. The data on survival in pediatric PTC from tropical countries is limited.

REFERENCES


  1. Harsha GS, Dabadghao P, Sudhanshu S. Long-Term Outcomes of Paediatric-Onset Craniopharyngioma: A Retrospective Analysis from a Tertiary Care Centre in North India. Neurol India. 2022;70:600–605.
  2. Enayet AER, Atteya MME, Taha H, Zaghloul MS, Refaat A, Maher E, Abdelaziz A, El Beltagy MA. Management of pediatric craniopharyngioma: 10-year experience from high-flow center. Childs Nerv Syst ChNS Off J Int Soc Pediatr Neurosurg. 2021;37:391–401.
  3. Ca N, Sc O, Go E. Paediatric brain tumours managed in Enugu, Southeast Nigeria: Review of one centre experience. Niger Postgrad Med J. 2018;25. doi:10.4103/npmj.npmj_132_18.
  4. Sarkar S, Chacko SR, Korula S, Simon A, Mathai S, Chacko G, Chacko AG. Long-term outcomes following maximal safe resection in a contemporary series of childhood craniopharyngiomas. Acta Neurochir (Wien). 2021;163:499–509.
  5. Riaz Q, Naeem E, Fadoo Z, Lohano M, Mushtaq N. Intracranial tumors in children: a 10-year review from a single tertiary health-care center. Childs Nerv Syst ChNS Off J Int Soc Pediatr Neurosurg. 2019;35:2347–53.
  6. Saleem MA, Hashim ASM, Rashid A, Ali M. Role of gamma knife radiosurgery in multimodality management of craniopharyngioma. Acta Neurochir Suppl. 2013;116:55–60.
  7. Tariq MU, Din NU, Ahmad Z, Memon W. Papillary craniopharyngioma: A clinicopathologic study of a rare entity from a major tertiary care center in Pakistan. Neurol India. 2017;65:570–76.
  8. Birla S, Khadgawat R, Jyotsna VP, Jain V, Garg MK, Bhalla AS, Sharma A. Identification of Novel PROP1 and POU1F1 Mutations in Patients with Combined Pituitary Hormone Deficiency. Horm Metab Res Horm Stoffwechselforschung Horm Metab. 2016;48:822–27.
  9. Khadilkar VV, Prasad HK, Ekbote VH, Rustagi VT, Singh J, Chiplonkar SA, Khadilkar AV. Response of Indian growth hormone deficient children to growth hormone therapy: association with pituitary size. Indian J Pediatr. 2015;82:404–9.
  10. Gupta S, Dayal D, Rohit MK, Gawalkar AA, Raj KM, Attri SV, Sachdeva N, Kaur H. Comprehensive assessment of cardiovascular disease risk in children with short stature due to isolated growth hormone deficiency: a case-control study. J Pediatr Endocrinol Metab JPEM. 2022;35:1059–68.
  11. Birla S, Vijayakumar P, Sehgal S, Bhatnagar S, Pallavi K, Sharma A. Characterization of a Novel POU1F1 Mutation Identified on Screening 160 Growth Hormone Deficiency Patients. Horm Metab Res Horm Stoffwechselforschung Horm Metab. 2019;51:248–55.
  12. Sethuraman C, Venkatasamy S. Clinical profile of Laron dwarfism - experience from a tertiary care institute in Chennai. J Pediatr Endocrinol Metab JPEM. 2023;36:466–69.
  13. Berg MA, Argente J, Chernausek S, Gracia R, Guevara-Aguirre J, Hopp M, Pérez-Jurado L, Rosenbloom A, Toledo SP, Francke U. Diverse growth hormone receptor gene mutations in Laron syndrome. Am J Hum Genet. 1993;52:998–1005.
  14. Hopp M, Rosenbloom AL, Griffiths J, Kgwete S, Vaccarello MA. Growth hormone receptor deficiency (Laron syndrome) in black African siblings. South Afr Med J Suid-Afr Tydskr Vir Geneeskd. 1996;86:268–70.
  15. Besson A, Salemi S, Eblé A, Joncourt F, Gallati S, Jorge AAL, Mullis PE. Primary GH insensitivity ’(Laron syndrome) caused by a novel 4 kb deletion encompassing exon 5 of the GH receptor gene: effect of intermittent long-term treatment with recombinant human IGF-I. Eur J Endocrinol. 2004;150:635–42.
  16. Jayant SS, Pal R, Rai A, Gupta K, Radotra BD, Walia R, Dhandapani S, Tripathi M, Ahuja CK, Gupta P, Bhansali A, Das L, Dutta P. Paediatric Pituitary Adenomas: Clinical Presentation, Biochemical Profile and Long-Term Prognosis. Neurol India. 2022;70:304–11.
  17. Kumar S, Sarathi V, Lila AR, Sehemby M, Memon SS, Karlekar M, Sankhe S, Patil VA, Shah N, Bandgar T. Giant prolactinoma in children and adolescents: a single-center experience and systematic review. Pituitary. 2022;25:819–30.
  18. Shah NS, George J, Acharya SV, Lila AR, Sarathi V, Bandgar TR, Jalali R, Goel AH, Menon P. Cushing disease in children and adolescents: twenty years’ experience in a tertiary care center in India. Endocr Pract Off J Am Coll Endocrinol Am Assoc Clin Endocrinol. 2011;17:369–76.
  19. Soni A, Fahey N, Bhutta ZA, Li W, Frazier JA, Moore Simas T, Nimbalkar SM, Allison JJ. Early childhood undernutrition, preadolescent physical growth, and cognitive achievement in India: A population-based cohort study. PLoS Med. 2021;18:e1003838.
  20. Athota JP, Bhat M, Nampoothiri S, Gowrishankar K, Narayanachar SG, Puttamallesh V, Farooque MO, Shetty S. Molecular and clinical studies in 107 Noonan syndrome affected individuals with PTPN11 mutations. BMC Med Genet. 2020;21:50.
  21. El Bouchikhi I, Samri I, Iraqui Houssaini M, Trhanint S, Bouguenouch L, Sayel H, Hida M, Atmani S, Ouldim K. The first PTPN1 1 mutations in hotspot exons reported in Moroccan children with Noonan syndrome and comparison of mutation rate to previous studies. Turk J Med Sci. 2015;45:306–12.
  22. Kruszka P, Porras AR, Addissie YA, Moresco A, Medrano S, Mok GTK, Leung GKC, Tekendo-Ngongang C, Uwineza A, Thong M-K, Muthukumarasamy P, Honey E, Ekure EN, Sokunbi OJ, Kalu N, Jones KL, Kaplan JD, Abdul-Rahman OA, Vincent LM, Love A, Belhassan K, Ouldim K, El Bouchikhi I, Shukla A, Girisha KM, Patil SJ, Sirisena ND, Dissanayake VHW, Paththinige CS, Mishra R, Klein-Zighelboim E, Gallardo Jugo BE, Chávez Pastor M, Abarca-Barriga HH, Skinner SA, Prijoles EJ, Badoe E, Gill AD, Shotelersuk V, Smpokou P, Kisling MS, Ferreira CR, Mutesa L, Megarbane A, Kline AD, Kimball A, Okello E, Lwabi P, Aliku T, Tenywa E, Boonchooduang N, Tanpaiboon P, Richieri-Costa A, Wonkam A, Chung BHY, Stevenson RE, Summar M, Mandal K, Phadke SR, Obregon MG, Linguraru MG, Muenke M. Noonan syndrome in diverse populations. Am J Med Genet A. 2017;173:2323–34.
  23. Singh A, Pradhan G, Prasad R, Mishra OP, Kapoor S. Spectrum of Disproportionate Short Stature at a Tertiary-care Center in Northern India. Indian Pediatr. 2017;54:971–72.
  24. Stephen L, Holmes H, Roberts T, Fieggen K, Beighton P. Orthodontic management of achondroplasia in South Africa. South Afr Med J Suid-Afr Tydskr Vir Geneeskd. 2005;95:588–89.
  25. Ullah F, Ghaffar T, Afridi AK, Ali A, Aamir A ul hasan. SHORT STATURE: WHA T IS THE CAUSE IN OUR POPULATION. J Ayub Med Coll Abbottabad JAMC. 2016;28:135–40.
  26. Kumar A, Jain V, Chowdhury MR, Kumar M, Kaur P, Kabra M. Pathogenic/likely pathogenic variants in the SHOX, GHR and IGFALS genes among Indian children with idiopathic short stature. J Pediatr Endocrinol Metab JPEM. 2020;33:79–88.
  27. Abou El Ella SS, Barseem NF, Tawfik MA, Ahmed AF. BMI relationship to the onset of puberty: assessment of growth parameters and sexual maturity changes in Egyptian children and adolescents of both sexes. J Pediatr Endocrinol Metab JPEM. 2020;33:121–28.
  28. Irewole-Ojo FO, Senbanjo IO, Oduwole AO, Njokanma OF. Age of pubertal events among school girls in Lagos, Nigeria. J Pediatr Endocrinol Metab JPEM. 2018;31:313–21.
  29. Khadgawat R, Marwaha RK, Mehan N, Surana V, Dabas A, Sreenivas V, Gaine MA, Gupta N. Age of Onset of Puberty in Apparently Healthy School Girls from Northern India. Indian Pediatr. 2016;53:383–87.
  30. Lohiya N, Jahagirdar R, Deshpande R, Goyal A. Sexual maturity assessment in Indian children-a study from western India. J Pediatr Endocrinol Metab JPEM. 2021;34:567–72.
  31. Felimban N, Jawdat D, Al-Twaijri Y, Al-Mutair A, Tamimi W, Shoukri M, Tamim H, Al-Alwan I. Pubertal characteristics among schoolgirls in Riyadh, Saudi Arabia. Eur J Pediatr. 2013;172:971–75.
  32. Galal MS, Musa SA, Babiker OO, Hamdan HZ, Abdullah MA. Clinical profile and aetiologies of delayed puberty: a 15 years’ experience from a tertiary centre in Sudan. J Pediatr Endocrinol Metab JPEM. 2022;35:938–45.
  33. Bhakhri BK, Prasad MS, Choudhary IP, Biswas K. Delayed puberty: experience of a tertiary care centre in India. Ann Trop Paediatr. 2010;30:205–12.
  34. Mnif-Feki M, Safi W, Bougacha-Elleuch N, Abid G, Moalla M, Elleuch M, Ben Salah DH, Rekik N, Belguith N, Abdelhedi F, Kammoun T, Hachicha M, Charfi N, Mnif F, Kammoun H, Hadj Kacem H, Hadj-Kacem F, Abid M. Occurrence of Hypopituitarism in Tunisian Turner Syndrome patients: familial versus sporadic cases. Gynecol Endocrinol Off J Int Soc Gynecol Endocrinol. 2021;37:848–52.
  35. Wonkam A, Veigne SW, Abass A, Ngo Um S, Noubiap JJN, Mbanya J-C, Sobngwi E. Features of Turner syndrome among a group of Cameroonian patients. Int J Gynaecol Obstet Off Organ Int Fed Gynaecol Obstet. 2015;129:264–66.
  36. Chaudhary S, Walia R, Bhansali A, Dayal D, Sachdeva N, Singh T, Bhadada SK. Unravelling a novel, promising and convenient tool for differential diagnosis of delayed puberty: GnRHa-stimulated inhibin B (GnRH-iB). J Endocrinol Invest. 2022;45:2265–73.
  37. Dayal D, Yadav J, Seetharaman K, Aggarwal A, Kumar R. Etiological Spectrum of Precocious Puberty: Data from Northwest India. Indian Pediatr. 2020;57:63–64.
  38. Goyal A, Malhotra R, Khadgawat R. Precocious pseudopuberty due to virilising adrenocortical carcinoma progressing to central precocious puberty after surgery. BMJ Case Rep. 2019;12:e229476.
  39. Selvaraj A, Prasad HK, Narayanasamy K, Thiagarajan A, Nedunchelian K. Clinical Profile of Adolescents With Delayed Puberty. Indian Pediatr. 2021;58:684–85.
  40. Mondkar SA, Oza C, Khadilkar V, Shah N, Gondhalekar K, Kajale N, Khadilkar A. Impact of COVID-19 lockdown on idiopathic central precocious puberty - experience from an Indian centre. J Pediatr Endocrinol Metab JPEM. 2022;35:895–900.
  41. Ashebir YG, Sebsibe GT, Gela D, Kebede MA. Attitudes of mothers attending public hospitals in Addis Ababa, Ethiopia, to neonatal sunlight exposure: a cross-sectional study. BMJ Paediatr Open. 2022;6:e001554.
  42. Ray R, Dabas A, Shah D, Malhotra RK, Madhu SV, Gupta P. Seasonal Variation in Serum 25-hydroxy Vitamin D and its Association with Clinical Morbidity in Healthy Infants from Northern India. Indian Pediatr. 2019;56:1020–24.
  43. Gupta P, Dabas A, Seth A, Bhatia VL, Khadgawat R, Kumar P, Balasubramanian S, Khadilkar V, Mallikarjuna HB, Godbole T, Krishnamurthy S, Goyal JP, Bhakhri BK, Ahmad A, Angadi K, Basavaraj GV, Parekh BJ, Kurpad A, Marwaha RK, Shah D, Munns C, Sachdev HPS. Indian Academy of Pediatrics Revised (2021) Guidelines on Prevention and Treatment of Vitamin D Deficiency and Rickets. Indian Pediatr. 2022;59:142–58.
  44. Trivedi M, Faridi MMA, Aggarwal A, Madhu SV, Malhotra RK. Oral Vitamin D Supplementation to Mothers During Lactation-Effect of 25(OH)D Concentration on Exclusively Breastfed Infants at 6 Months of Age: A Randomized Double-Blind Placebo-Controlled Trial. Breastfeed Med Off J Acad Breastfeed Med. 2020;15:237–45.
  45. Agarwal R, Virmani D, Jaipal ML, Gupta S, Gupta N, Sankar MJ, Bhatia S, Agarwal A, Devgan V, Deorari A, Paul VK, Investigators of LBW Micronutrient Study Group, Departments of Pediatrics and Endocrinology. Vitamin D status of low birth weight infants in Delhi: a comparative study. J Trop Pediatr. 2012;58:446–50.
  46. Jain V, Gupta N, Kalaivani M, Jain A, Sinha A, Agarwal R. Vitamin D deficiency in healthy breastfed term infants at 3 months & their mothers in India: seasonal variation & determinants. Indian J Med Res. 2011;133:267–73.
  47. Chebet M, Piloya T, Ameda F, Mukunya D, Kiguli S. Vitamin D deficiency in low-birth-weight infants in Uganda; a cross sectional study. PloS One. 2022;17:e0276182.
  48. Mogire RM, Morovat A, Muriuki JM, Mentzer AJ, Webb EL, Kimita W, Ndungu FM, Macharia AW, Cutland CL, Sirima SB, Diarra A, Tiono AB, Lule SA, Madhi SA, Sandhu MS, Prentice AM, Bejon P, Pettifor JM, Elliott AM, Adeyemo A, Williams TN, Atkinson SH. Prevalence and predictors of vitamin D deficiency in young African children. BMC Med. 2021;19:115.
  49. Vijayakumar M, Bhatia V, George B. Vitamin D status of children in Kerala, southern India. Public Health Nutr. 2020;23:1179–83.
  50. Braithwaite VS, Freeman R, Greenwood CL, Summers DM, Nigdikar S, Lavy CBD, Offiah AC, Bishop NJ, Cashman J, Prentice A. The aetiology of rickets-like lower limb deformities in Malawian children. Osteoporos Int J Establ Result Coop Eur Found Osteoporos Natl Osteoporos Found USA. 2016;27:2367–72.
  51. Ahmed S, Goldberg GR, Raqib R, Roy SK, Haque S, Braithwaite VS, Pettifor JM, Prentice A. Aetiology of nutritional rickets in rural Bangladeshi children. Bone. 2020;136:115357.
  52. Sempos CT, Durazo-Arvizu RA, Fischer PR, Munns CF, Pettifor JM, Thacher TD. Serum 25-hydroxyvitamin D requirements to prevent nutritional rickets in Nigerian children on a low-calcium diet-a multivariable reanalysis. Am J Clin Nutr. 2021;114:231–37.
  53. Thacher TD, Sempos CT, Durazo-Arvizu RA, Fischer PR, Munns CF, Pettifor JM. The Validity of Serum Alkaline Phosphatase to Identify Nutritional Rickets in Nigerian Children on a Calcium-Deprived Diet. J Clin Endocrinol Metab. 2021;106:e3559–64.
  54. Sahni SS, Kakkar S, Kumar R, Goraya JS. Osteomalacic Myopathy in Children and Adolescents with Vitamin-D Deficiency. Neurol India. 2021;69:1650–54.
  55. Goyal A, Dabas A, Shah D, Malhotra RK, Dewan P, Madhu SV, Gupta P. Sunlight Exposure vs Oral Vitamin D Supplementation for Prevention of Vitamin D Deficiency in Infancy: A Randomized Controlled Trial. Indian Pediatr. 2022;59:852–58.
  56. Mondal K, Seth A, Marwaha RK, Dhanwal D, Aneja S, Singh R, Sonkar P. A Randomized controlled trial on safety and efficacy of single intramuscular versus staggered oral dose of 600 000IU Vitamin D in treatment of nutritional rickets. J Trop Pediatr. 2014;60:203–10.
  57. George J, Acharya SV, Bandgar TR, Menon PS, Shah NS. Primary hyperparathyroidism in children and adolescents. Indian J Pediatr. 2010;77:175–78.
  58. Sharanappa V, Mishra A, Bhatia V, Mayilvagnan S, Chand G, Agarwal G, Agarwal A, Mishra SK. Pediatric Primary Hyperparathyroidism: Experience in a Tertiary Care Referral Center in a Developing Country Over Three Decades. World J Surg. 2021;45:488–95.
  59. Pal R, Dutta A, Agrawal K, Jain N, Dutta P, Bhansali A, Behera A, Bhadada SK. Primary Hyperparathyroidism Presenting as Posterior Reversible Encephalopathy Syndrome: A Report of Two Cases. J Clin Res Pediatr Endocrinol. 2020;12:432–38.
  60. Gupta P, Tak SA, S AV, Misgar RA, Agarwala S, Jain V, Sharma R. A Case of Neonatal Severe Hyperparathyroidism: Challenges in Management. Indian J Pediatr. 2022;89:1025–27.
  61. Joshi RR, Patil S, Rao S. Clinical and etiological profile of refractory rickets from western India. Indian J Pediatr. 2013;80:565–69.
  62. Bajpai A, Sharma J, Hari P, Bagga A. Pseudohypoparathyroidism presenting with bony deformities resembling rickets. Indian J Pediatr. 2004;71:345–48.
  63. Ma SL, Vega-Warner V, Gillies C, Sampson MG, Kher V, Sethi SK, Otto EA. Whole Exome Sequencing Reveals Novel PHEX Splice Site Mutations in Patients with Hypophosphatemic Rickets. PloS One. 2015;10:e0130729.
  64. Khan PA, Mustafa G, Shabbir G, Azam M, Athar M, Zulqarnain A. X-linked hypophosphatemic rickets: report of a family from southern Punjab, Pakistan. JPMA J Pak Med Assoc. 2004;54:335–38.
  65. Gupta M, Thakur S, Sharma R, Gupta A. Idiopathic tumoral calcinosis presenting in early childhood. BMJ Case Rep. 2019;12:e227083.
  66. Desai MP, Sharma R, Riaz I, Sudhanshu S, Parikh R, Bhatia V. Newborn Screening Guidelines for Congenital Hypothyroidism in India: Recommendations of the Indian Society for Pediatric and Adolescent Endocrinology (ISPAE) - Part I: Screening and Confirmation of Diagnosis. Indian J Pediatr. 2018;85:440–47.
  67. Sudhanshu S, Riaz I, Sharma R, Desai MP, Parikh R, Bhatia V. Newborn Screening Guidelines for Congenital Hypothyroidism in India: Recommendations of the Indian Society for Pediatric and Adolescent Endocrinology (ISPAE) - Part II: Imaging, Treatment and Follow-up. Indian J Pediatr. 2018;85:448–53.
  68. Lucas G. Guidelines on management of congenital hypothyroidism in Sri Lanka. Sri Lanka J Child Health. 2015;44:75–76.
  69. Dorreh F, Chaijan PY, Javaheri J, Zeinalzadeh AH. Epidemiology of congenital hypothyroidism in Markazi Province, Iran. J Clin Res Pediatr Endocrinol. 2014;6:105–10.
  70. Verma P, Kapoor S, Kalaivani M, Vats P, Yadav S, Jain V, Thelma BK, Science and Engineering Research Board – Newborn Screening Initiative Group (SERB-NBS) members. An Optimal Capillary Screen Cut-off of Thyroid Stimulating Hormone for Diagnosing Congenital Hypothyroidism: Data from a Pilot Newborn Screening Program in Delhi. Indian Pediatr. 2019;56:281–86.
  71. Lowe N, Westaway E, Munir A, Tahir S, Dykes F, Lhussier M, McKeown M, Zimmerman M, Andersson M, Stinca S, Zaman M. Increasing Awareness and Use of Iodised Salt in a Marginalised Community Setting in North-West Pakistan. Nutrients. 2015;7:9672–82.
  72. Menon PSN. Prevention of Iodine Deficiency Disorders in Children in India - the Way Forward. Indian J Pediatr. 2019;86:113–15.
  73. Businge CB, Longo-Mbenza B, Kengne AP. Iodine deficiency in pregnancy along a concentration gradient is associated with increased severity of preeclampsia in rural Eastern Cape, South Africa. BMC Pregnancy Childbirth. 2022;22:98.
  74. Kandasamy D, Malik R, Sharma R, Jana M. Case 308: Van Wyk-Grumbach Syndrome. Radiology. 2022;305:746–50.
  75. Reddy P, Tiwari K, Kulkarni A, Parikh K, Khubchandani R. Van Wyk Grumbach Syndrome: A Rare Consequence of Hypothyroidism. Indian J Pediatr. 2018;85:1028–30.
  76. Egodawaththe NS, Seneviratne SN, Gunasekara S, Amarasekara SM, Weerasekara K. Van Wyk-Grumbach syndrome and oligosyndactyly in a 6-year-old girl: a case report. J Med Case Reports. 2020;14:166.
  77. Riaz M, Ibrahim MN, Laghari TM, Hanif MI, Raza J. Van Wyk Grumbach Syndrome. J Coll Physicians Surg--Pak JCPSP. 2020;30:1332–34.
  78. Navid A, Dayal D, Kaur H, Gupta A, Attri S. Comparative efficacy of early morning versus bedtime administration of levothyroxine in children with hypothyroidism: a prospective, open label, randomized, case-control study. Pediatr Endocrinol Diabetes Metab. 2021;27:178–82.
  79. Rajamanickam R, Shanmugavelu L, Subramanian S, Prasad HK, Krishnamoorthy N. Hashimoto’s Thyroiditis in South Indian Centre. Indian J Pediatr. 2016;83:1227–31.
  80. Palaniappan S, Shanmughavelu L, Prasad HK, Subramaniam S, Krishnamoorthy N, Lakkappa L. Improving iodine nutritional status and increasing prevalence of autoimmune thyroiditis in children. Indian J Endocrinol Metab. 2017;21:85–89.
  81.  Menon PS, Singh GR. Hyperthyroidism in children: an Indian experience. J Pediatr Endocrinol Metab JPEM. 1996;9:441–46.
  82. Sonowal R, Anjali A, Kumar A. Neonatal Thyrotoxicosis Co-existing With Early Onset Sepsis. Indian Pediatr. 2021;58:86.
  83.  Gundgurthi A, Dutta MK, Garg MK, Pandit AG. Autonomous functioning thyroid nodule successfully treated with radioiodine in a 3 and a half-year-old boy. J Pediatr Endocrinol Metab JPEM. 2012;25:345–47.
  84.  Ballal S, Soundararajan R, Singh H, Garg A, Chopra S, Bal C. Influence of prior carbimazole on the outcome of radioiodine therapy in pediatric and adolescent Graves’ disease. Nucl Med Commun. 2015;36:566–72.
  85.  Thakur C, Kumar P, Goyal JP, Vyas V. Thyroid Storm in an Adolescent Girl Precipitated by Empyema Thoracis. Oman Med J. 2022;37:e371.
  86.  Thankamony P, Nirmal G, Chandar R, Nair AKR, Veeramoni Iyer Mriduladevi P. Differentiated thyroid carcinoma in children: A retrospective analysis of 125 pediatric cases from a single institution in India. Pediatr Blood Cancer. 2021;68:e29076.
  87.  Chakraborty D, Shakya S, Ballal S, Agarwal S, Bal C. BRAF V600E and TERT promoter mutations in paediatric and young adult papillary thyroid cancer and clinicopathological correlation. J Pediatr Endocrinol Metab JPEM. 2020;33:1465–74.
  88. Dixit N, Shaw CK, Varshney GA, Kumar R, Saini PA, Verma P. Endocrinal Complications in Children and Adolescents with Thalassemia Major in Central India: An Observational Study. Indian J Pediatr. 2022;89:983–88.

Calcium and Phosphate Homeostasis

ABSTRACT


Calcium and phosphate are critical to human physiology (e.g., neuromuscular function) and are also needed for skeletal mineralization.  An understanding of calcium and phosphate metabolism is required for the clinician to evaluate disorders of the levels of calcium and phosphorus as well as metabolic skeletal disorders.  In this chapter, we review calcium and phosphate homeostasis including the critical organs involved (skeleton, parathyroids, GI tract, kidneys etc.) as well as the hormones (PTH, vitamin D, FGF23, calcitonin) that regulate calcium and phosphate.


INTRODUCTION


Understanding the physiology of calcium and phosphate homeostasis is needed to manage patients with abnormalities of this homeostatic system. Disorders of calcium, phosphate, and skeletal metabolism are among the most common group of diseases in endocrinology (1). They can involve abnormalities in the serum concentrations of the two minerals, especially calcium; abnormalities of bone; and abnormalities of the major regulating organ systems, especially the parathyroid gland, kidneys and gastrointestinal (GI) tract (Table 1). The serum calcium concentration can be abnormally high, as in malignancy and primary hyperparathyroidism, or abnormally low as it is in renal failure and hypoparathyroidism. The skeleton can have low bone density, as occurs in osteoporosis and osteomalacia, or high bone density as Paget’s disease of bone, osteopetrosis, and other osteosclerotic disorders. The GI tract can exhibit low calcium absorption, as in malabsorptive states, or high calcium absorption, as in vitamin D intoxication and the milk-alkali syndrome. The kidneys can under-excrete calcium, as occurs in some hypercalcemic disorders; over-excrete calcium, as in some patients with nephrolithiasis; under-excrete phosphorus, as in renal failure and defects in fibroblast growth factor 23 (FGF23) action; and over-excrete phosphorus, as in some renal tubular disorders and renal phosphate wasting due to excess FGF23 and other phosphatonins. Corresponding events occur for magnesium, but they will not be discussed in this chapter. The goal of this chapter is to discuss the normal regulation of bone and mineral metabolism in order to provide the clinician a basis for diagnosis and management of patients with the common disorders that involve this homeostatic system.


Table 1. Regulation of Calcium and Skeletal Metabolism

Minerals

   Calcium (Ca)

   Phosphorus (P)

   Magnesium (Mg)

Organ Systems

   Skeleton

   Kidney

   GI tract

   Skin

   Other

Hormones

   Calciotropic hormones

   Parathyroid Hormone (PTH)

   Calcitriol (1,25(OH2)D)

   PTH-related Protein (PTHrP)

   FGF23 and other phosphatonins

   Calcitonin (CT

Other hormones

   Gonadal and adrenal steroids

   Thyroid hormones

   Growth factor and cytokines


As detailed in other chapters, disorders of mineral and skeletal metabolism can be due to a primary disease of one of the involved organ systems, as in primary hyperparathyroidism due to a tumor of one or more parathyroid glands; secondary hyperparathyroidism, due to a compensatory response of the parathyroid glands to a low serum calcium, low vitamin D, calcium malabsorption, kidney disease, etc.; perturbations in serum calcium due to malignancy and bone metastases; and the complex mineral and skeletal complications of renal failure. A basis for understanding the pathogenesis of the primary and secondary diseases of bone and its minerals that are discussed in this text is an appreciation of the interplay among hormones, minerals, and organ systems that regulate normal bone and bone and mineral metabolism (Figure 1).


The skeleton is the reservoir of calcium for many physiological functions, and it serves a similar but not so unique role for phosphorus and magnesium (Table 2) (2,3). Skeletal calcium is controlled through the regulatory pathways of the gastrointestinal (GI) tract and the kidneys, and in bone by the osteoblast, the bone-forming cell, and the osteoclast, the bone-resorbing cell. Calcium reaches the skeleton by being absorbed from the diet in the GI tract. Unabsorbed calcium passes into the feces, which also contains the small amount of calcium secreted into the GI tract. Minor losses occur through perspiration and cell sloughing. In pregnancy, substantial losses can occur across the placenta to the developing fetus and in the postpartum period through lactation. Absorbed dietary calcium then enters the extracellular fluid (ECF) space and becomes incorporated into the skeleton through the process of mineralization of the organic matrix of bone, osteoid. ECF calcium is also filtered by the kidney at a rate of about 6 grams per day, where up to 98 percent of it is reabsorbed (Figure 1).


Figure 1. Schematic Representation of Calcium and Skeletal Metabolism. Abbreviations: A, absorption; S, secretion; ECF, extracellular fluid; GF, glomerular filtration; TR, tubular reabsorption. The dark vertical line between bone and ECF represents bone surface and bone-lining cells. Shaded area represents labile skeletal calcium. The various calcium compartments are not to scale. See text for discussion. (see Acknowledgements).


The major regulation of bone and bone mineral metabolism results from the interactions of four hormones – parathyroid hormone (PTH), vitamin D (VD), fibroblast growth factor 23 (FGF23) and to a much lesser extent calcitonin (CT) – at three target organs – bone, kidneys, and GI tract – to regulate three bone minerals – calcium, magnesium, and phosphorus. Other hormones also play a role, and skin is a participating organ system (Table 1). Understanding the normal regulatory mechanisms of this system will aid the clinician in evaluation and management of disorders of mineral metabolism (1-3).


CELLULAR AND INTRACELLULAR CALCIUM AND PHOSPHORUS METABOLISM


Physicians are most aware of the clinical status of calcium and skeletal metabolism in the patient as revealed by the concentrations of these minerals in biological fluids, especially blood and urine, and by the structural integrity of the skeleton (1). The actions of the calcemic hormones to regulate mineral concentrations in biological fluids are well understood at the target organ level. However, less well understood are the cellular and intracellular mechanisms that underlie the clinically important phenomena.


Both calcium and phosphorous, as well as magnesium, are transported to blood from bone, renal, and GI cells, and visa versa (4-6). These transport mechanisms can be through cells (transcellular) and around cells (paracellular). The cellular transport is mediated by the membrane structures illustrated in Figure 2 and by binding transport proteins (7,8). The paracellular transport is generally passive and mediated by mineral gradients. These mechanisms also involve corresponding co-transportation and exchange-transportation with other ions, notably sodium, potassium, chloride, hydrogen, and bicarbonate, some of which are powered by ATP hydrolysis. Similar mechanisms allow for the intracellular distribution of calcium, where it partitions primarily between the mitochondria and cytosol.


The details of the regulation of these cellular and intracellular mineral transports are not as well understood as are the whole organ mechanisms that they effectuate. However, some evidence along with inferences lead to the tentative clinical conclusion that changes in ambient concentrations of mineral in extracellular fluids are mirrored by corresponding intracellular changes and redistribution (Figure 2).


Figure 2. Schematic representation of cellular transport of bone minerals. The model can be applied to transport of calcium, magnesium, and phosphorus for cells of the renal tubules, gastrointestinal tract enterocytes, and bone cells. The mineral transport can be with (downhill) or against (uphill) a gradient. Lumen refers to GI and renal tracts; for bone, it can refer to bone marrow, blood, and/or matrix space. The site of the indicated membrane transport structures is schematic. Microsomes designate other intracellular organelles such as secretory vesicles and endoplasmic reticulum. See text for details.


Figure 2 provides a simplified version of the cellular regulation of bone minerals metabolism and transport. Mineral homeostasis requires the transport of calcium, magnesium, and phosphate across their target cells in bone, intestine, and kidney. This transport can be across cells (transcellular) and around cells (pericellular). The pericellular transport is usually diffusional, down a gradient (“downhill”), and not hormonally regulated. Diffusion can also occur through cell channels, which can be gated. Transport across cells is more complex and usually against a gradient (“uphill”). This active transport is energized by either ATP hydrolysis or electrochemical gradients and involves membrane structures that are generally termed porters, exchangers, or pumps. Three types of porters have been described, uniporters of a single substance; symporters for more than one substance in the same direction; and anti-porters for more than one substance in opposite directions (7,8).


Once through the luminal cell membrane, the bone minerals can cross the cell into the extracellular fluid compartment, blood for enterocytes and urine for renal epithelium cells (5,6). For bone cells, the corresponding compartments are marrow and blood (1,2). For calcium, the transcellular transport is ferried by the interaction among a family of proteins that include calmodulin, calbindin, integral membrane protein, and alkaline phosphatase; the latter three are vitamin D dependent in their expression (6). Cytoskeletal interactions are likely important for transcellular transport as well. Exit from the cell is regulated by membrane structures similar to those that mediate entry. There do not appear to be any corresponding binding proteins for phosphorous, so diffusional gradients and cytoskeletal interactions seem to regulate its cellular transport.


The molecular details of the hormonal regulation of cellular bone mineral transport have not been fully elucidated. It is reasonable to hypothesize that PTH, vitamin D, FGF23, and CT, regulate these molecular mechanisms through their biological effects on the participating membrane structures and transport proteins. For the enterocyte, vitamin D enhances the movement of calcium into the cell through its stimulation of calbindin synthesis (6). For kidney tubules, PTH and FGF23 are the key regulators for the transport of calcium and phosphate (1,5,9). For bone, PTH and to a lesser extent CT are important regulators of cellular calcium and phosphate transport, while vitamin D provides appropriate concentrations of these minerals through it’s GI and perhaps renal actions (1-3).


It is important to note that these mineral translocations not only mediate the mineral metabolism represented in Figure 2, but also the cellular effects summarized in Table 3.


Table 2. Distribution of Calcium, Phosphorus, and Magnesium

TOTAL BODY CONTENT, G

% IN SKELETON

% IN SOFT TISSUES

Calcium                 1000

               99

                  1

Phosphorus            600

               85

                  15

Magnesium            25

                65

                 35


CALCIUM METABOLISM


Serum and extracellular calcium concentrations in mammals are closely regulated within a narrow physiologic range that is optimal for the many cellular functions. (1,2).  More specifically, it is the ionized component of serum calcium that is closely regulated, as it subserves the physiological functions of this divalent cation (Table 3). Ambient calcium is so close to its saturation point with respect to phosphates that deviations in concentrations of either can cause precipitation. Intracellular calcium, which serves as second messenger in many signal transduction pathways, is also tightly controlled, but at concentrations several orders of magnitude lower than extracellular calcium. Extraskeletal calcium accounts for only 1% of the total body calcium, as calcium is primarily sequestered in bone (Table 4-6). The average diet contains about 1 gm of calcium, but there are great variations. About 500 mg undergoes net absorption from the diet, and the unabsorbed and secreted components appear in the stool (Table 6-9). Approximately 10,000 mg/day is filtered at the glomerulus and most is reabsorbed by the renal tubules, with only a few hundred milligrams appearing in urine each day (Tables 10 and 11). The skeleton turns over about 250 mg/day of calcium, but there is wide variation. This turnover is attributed to a labile calcium pool near bone surfaces, but it is difficult to give anatomical assignment to either labile or non-labile calcium compartments. The turnover is mediated by bone-forming osteoblasts and bone-resorbing osteoclasts. In disease states, the turnover can be increased (e.g., hyperparathyroidism) or decreased (e.g., hypoparathyroidism) with corresponding changes in blood and urinary calcium. The primary calcium regulating hormones that control this homeostatic system are PTH and vitamin D, which act at bone, kidney, and GI tract to increase serum calcium and to a lesser extent calcitonin, which decreases bone resorption, but does not appear to have a major effect on serum calcium under normal circumstances (10) (Figure 1).


Table 3. Multiple Biological Functions of Calcium

Cell signaling

Neural transmission

Muscle function

Blood coagulation

Enzymatic co-factor

Membrane and cytoskeletal functions

Secretion

Biomineralization


Table 4. Distribution of Calcium

Total body calcium- 1kg

       99% in bone

       1% in blood and body fluids Intracellular calcium

               Cytosol

               Mitochondria

               Other microsomes

               Regulated by “pumps”

               Blood calcium – 10mgs (8.5-10.5)/100 mls

                       Non diffusible – 3.5 mgs

                       Diffusible – 6.5 mgs


Table 5. Bone Structure (cellular and non-cellular)

Inorganic (69%)

    Hydroxyapatite – 99%

          3 Ca10 (PO4)6 (OH)2

Organic (22%)

    Collagen (90%)

    Non-collagen structural proteins

           proteoglycans

           sialoproteins

           gla-containing proteins

     α2HS-glycoprotein

            Functional components

            growth factor

            cytokines


Table 6. Blood Calcium – 10mgs/100 mls (2.5 mmoles/L)

Non diffusible – 3.5 mgs

      Albumin bound – 2.8

      Globulin bound – 0.7

Diffusible – 6.5 mgs

       Ionized – 5.3

       Complexed – 1.2 mgs

                 bicarbonate – 0.6 mgs

                 citrate – 0.3 mgs

                 phosphate – 0.2 mgs

                 other

        Close to saturation point

                 tissue calcification

                 kidney stones


Table 7. Diet

Dietary calcium

        Milk and dairy products (1qt ~ 1gm) Dietary supplements

        Other foods

Other dietary factors regulating calcium absorption

        Lactose

        Phosphorus


Table 8. Calcium Absorption (0.4-1.5 g/d)

Fastest in duodenum

        15-20% absorption

Adaptative changes

         low dietary calcium

         growth (150 mg/d)

         pregnancy (100 mg/d)

         lactation (300 mg/d)

Fecal excretion


Table 9. Mechanisms of GI Calcium Absorption

Vitamin D dependent

Duodenum > jejunum > ileum

Active transport across cells

        calcium binding proteins (e.g., calbindins)

        calcium regulating membranomes

Ion exchangers

Passive diffusion


Approximately 50% of the total calcium in serum is ionized, with the rest bound primarily to albumin or complexed with counter-ions, including phosphates (Table 6) (1,2). The ionized calcium concentration averages 1.25 + 0.07 mmol/L and the total serum calcium concentrations range from 8.5 to 10.5 mg/dL. Since ionized calcium has the primary regulatory role, it is in turn the regulated component that maintains homeostasis. This regulation takes place through the complex interactions at their target organs of the primary calcium regulating hormones, parathyroid hormone (PTH) and vitamin D and its metabolites (Tables 4-11). Other hormones participate, most notably gonadal steroids.


Table 10. Urinary Calcium

Daily filtered load

10   m (diffusible)

        99% reabsorbed

Two general mechanisms

        Active – transcellular

        Passive – paracellular

Proximal tubule and Loop of Henle reabsorption

        Most of filtered load

        Mostly passive

        Inhibited by furosemide

Distal tubule reabsorption

        10% of filtered load

        Regulated (homeostatic)

                 stimulated by PTH

                 inhibited by CT

                 vitamin D has small stimulatory effect

                 stimulated by thiazides

Urinary excretion

50   – 250 mg/day

        0.5 – 1% filtered load


Table 11. Regulation of Urinary Calcium

Hormonal – tubular reabsorption

        PTH – decreases excretion (clearance)

        CT – increases excretion (calciuretic)

        1,25(OH)2D – decreases excretion

Diet

        Little effect

        Logarithmic

Other factors

        Sodium – increases excretion

        Phosphate – decreases excretion

        Diuretics – thiazides vs loop

                   thiazides – inhibit excretion

                   furosemide – stimulate excretion


Table 12. Other Routes of Excretion

Perspiration

Lactation


PHOSPHORUS METABOLISM


Phosphorus is more widely distributed than calcium and also serves a variety of biological functions (Table 2) (3,4). While most of phosphorus is skeletal as hydroxyapatite, 15 % is distributed among extraskeletal sites like phosphoproteins, phospholipids, and nucleic acids (Table 13). In blood, phosphorus exists as the phosphates, H2PO4G and HPO4=, but its concentration is measured as phosphorus, with a normal range of 2.5 – 4.5 mg/100 ml. The regulation is not as tight as it is for calcium, with substantial perturbations due to diet and alimentation.


Table 13. Phosphorus Metabolism

General

       Widely distributed

       Multiple biological functions

       Distribution

       Skeletal – Hydroxyapatite:

Ca(PO4)2 o Ca(OH)2

15% extraskeletal

                          Phosphoproteins

                          Phospholipids

                          Nucleic acids

Blood Phosphate:

H2PO4- and HPO4=

Concentration measured as phosphorus: 2.5 – 4.5 mg/100 ml

Regulation

        Not as closely as calcium

        Diet

        Alimentation

        Growth

        Diurnal rhythm

        Hormones

        Other factors


Table 14. Dietary Phosphorus

Most foods

1 gm per day – variable

Absorption

        Site – distal to duodenum

        Mechanism

               Calcium dependent

               Calcium independent

Regulation

         Diet – 70% absorbed

         Calciotropic hormones

                Vitamin D – increases

                CT – decreases

Other factors

         GH – increases

         Phosphate binders decrease

         Calcium – decreases

         Fecal – non-absorbed and secreted


Table 15. Urinary Phosphate

Major route of regulation

Related to diet 90% filtered (? protein binding)

Proximal tubule – 90% reabsorbed

        H2PO4- – active

        HPO4= – passive

Distal tubule – 10% reabsorbed

Regulation

        Diet

        Calciotropic hormones

                  PTH – increases excretion

                  CT – increases excretion

                  Vitamin D – decreases excretion

                   FGF23 and other phosphatonins increase excretion

                   Proximal renal tubular NaPi2a, NaPi2c


Dietary phosphorus comes from most foods, averaging about 1 gm per day (Table 14), with the most important sources being dairy products, grains, meats, and food additives (3,4). Absorption takes place at a site distal to duodenum and utilizes both calcium dependent and calcium independent mechanisms that can be active or passive. The most significant quantitatively is post-prandial passive absorption. Approximately 60-80% is absorbed primarily by a diffusional process without a significant saturable component; however, there is regulation by the calciotropic hormones, especially vitamin D, whose active metabolites increases absorption, while PTH and CT have only minor direct effects (6) (Tables 13 and 14). Calcium- and aluminum-containing phosphate binders as well as newer phosphate binders such as sevelamer, lanthanum carbonate, ferric citrate, and sucroferric oxyhydroxide can inhibit absorption and are used to do so in the treatment of the hyperphosphatemia associated with chronic kidney disease (11). Fecal phosphate comprises non-absorbed and secreted components (Table 14).


Renal phosphate reabsorption controls the concentration of phosphate in serum, and it is usually quantified as the tubular reabsorption of phosphorus and expressed as the renal phosphate threshold (TmP/GFR), which closely mirrors the normal range of serum phosphorus (5). Although the TmP/GFR can be measured, it is usually estimated by a nomogram from fasting measurements of serum and urinary phosphorus and creatinine. The proximal convoluted tubule reabsorbs about 75 percent of filtered phosphate, and most of the remainder is reabsorbed in the proximal straight tubule; the distal tubule segments may have a limited capacity for reabsorption, about 5 percent of filtered load (1,5).


An important role for FGF23 in phosphate metabolism has been elucidated (9). This glycoprotein product of osteocytes and osteoblasts promotes the renal excretion of phosphorus by decreasing expression of NaPi2a and NaPi2c resulting in decreased renal tubular reabsorption. The expression of FGF23 is up-regulated by serum phosphate and 1,25 dihydroxyvitamin D (9,12). 


SKELETAL METABOLISM


The metabolic function of bone is to provide a homeostatic mineral reservoir, primarily for calcium, but also for other minerals, especially magnesium and phosphorus (1-3). These bone minerals can be mobilized to maintain systemic mineral homeostasis. This metabolic function of bone prevails over its structural function in that calcium and other minerals are removed from and replaced in bone to serve systemic homeostatic needs irrespective of loss of skeletal structural integrity. Bone is also a depository for certain cytokines and growth factors that can be released upon bone resorption and can exert their effects locally and systemically; notable among these is TFG beta.


Bone consists of a mineral phase and an organic phase (Table 5) (2). The major component of the mineral phase is hydroxyapatite crystal and the major component of the organic phase is type 1 collagen which, with other bone proteins, comprises the osteoid matrix of bone. The organic components of bone are products of the osteoblast. Bone mineral is present in two forms in the skeleton. Hydroxyapatite crystals, represented by the formula Ca10(PO4)6(OH)2, are the major forms and occur in mature bone. Amorphous calcium phosphate comprises the remainder; it occurs in areas of active bone formation and matures through several intermediate stages to hydroxyapatite. The end result is a highly organized amalgam of protein, primarily collagen, and mineral, primarily hydroxyapatite, that has sufficient structural integrity to serve the mechanical functions of the skeleton. Upon completion of this process, the osteoblast becomes encased in bone and become an osteocyte. Mineralization can occur if there is a functionally adequate local concentration of these ions, if nucleators are present to promote crystallization, and if local inhibitors of mineralization are removed. While vitamin D is key to providing sufficient ambient concentrations of calcium and other minerals to promote mineralization of osteoid, this hormone does not seem to exert a direct regulatory effect on mineralization.


Cortical bone comprises approximately 80% of the skeleton and trabecular bone 20% (1,3). However, the surface area of cortical bone is only one fifth that of trabecular bone, so trabecular bone is metabolically more active than cortical bone, with an annual turnover (remodeling) of approximately 20% to 30% for the former and 3% to 10% for the latter. A given skeletal site in the adult is remodeled approximately every 3 years. Bone mass is acquired up to the fourth decade, with a rapid phase during adolescent growth. Much of peak bone mass is genetically determined. Women have approximately 30% less peak bone mass than men and experience an accelerated loss after the menopause. Both genders experience age-related loss of bone mass.


A role for the central nervous system role in fat and skeletal metabolism has received much recent experimental support. The adipocyte-derived hormone leptin appears to inhibit bone mass accrual through a brain pathway, while having direct peripheral anabolic effects on bone (13).  Furthermore, calcium metabolism has recently become linked to glucose metabolism through an appreciation of the biological effects of the osteoblast product, osteocalcin. When carboxylated, osteocalcin acts as a structural bone protein. However, in its undecarboxylated state, osteocalcin may act to regulate glucose metabolism by stimulating insulin secretion. Thus, two major metabolic pathways – calcium/bone and glucose/insulin – seem to be linked (14).


Table 16. Skeletal Metabolism

Bone cells

        Osteoblast

        Osteoclast

        Osteocyte

        Other – marrow elements

Bone structure

        Cortical bone

        Trabecular bone

        Mix


Bone Cells


Skeletal metabolism is regulated by bone cells and their progenitors (Figure 3). Among the population of bone cells are osteoblasts, osteocytes, osteoclasts, and lining cells (Table 16) (1-3). Monocytes, macrophages, and mast cells may also mediate certain aspects of skeletal metabolism. Marrow cells contribute to the population of bone cells. The osteoblast forms bone. Osteoblasts express receptors to many bone-active agents such as PTH, PTHrP, vitamin D metabolites, gonadal and adrenal steroids, and certain cytokines and growth factors. The major product of osteoblasts is type 1 collagen, which along with other proteins, forms the organic osteoid matrix that is mineralized to hydroxyapatite.


Figure 3. Schematic Representation of Osteoclast and Osteoblast Lineages. Schematic representation of the osteoclast (top) and osteoblast (bottom) lineages. The two lineages are distinct, but there is regulatory interaction among the cells (vertical arrows). Osteoclasts originate from a hematopoietic stem cell that can also differentiate into a macrophage, granulocyte, erythrocyte, megakaryocyte, mast cell, B-cell, or T-cell. Osteoblasts originate from a mesenchymal stem cell that can also differentiate into a chondrocyte, myocyte, fibroblast, or adipocyte. The terminology for these lineages is still evolving and is herein [over] simplified. Many intermediate steps and regulatory factors are involved in lineage development. (see Acknowledgements).


Osteocytes are osteoblasts that become encased in bone during its formation and mineralization and reside in the resulting lacuna (2,3). They comprise 90-95% of bone cells in the adult human skeleton (15).  The cells develop processes that communicate as canaliculi with other osteocytes, osteoblasts, and the vasculature. Osteocytes thus present acres of cellular syncytium that permits translocation of bone mineral during times of metabolic activity and can provide minute-to-minute exchanges of minerals from bone matrix.


Osteocytes are extremely important in normal skeletal homeostasis.  Their function is reviewed by Bonewald (15).   These cells are the likely transducers through their canaliculi of mechanical forces on bone and mediate the complex remodeling response to mechanical stimuli of the skeleton that causes appropriate changes in formation and resorption in response to skeletal loading. These cells produce sclerostin (SOST gene), which decreases bone formation and increases bone resorption (15).  Defects in sclerostin function either by a mutation in SOST or a mutation downstream to sclerostin cause the high bone mass disorders sclerosteosis and van Buchem disease respectively (15).  Osteocytes are also important endocrine cells that produce enzymes and hormones which affect bone mineralization and regulate phosphate such as Phosphate Regulating Endopeptidase X-Linked (PHEX), Dentin Matrix Acidic Phosphoprotein 1 (DMP1), Matrix Extracellular Phosphoglycoprotein (MEPE), and FGF23 (15).  Sclerostin antagonism represents a therapeutic target for osteoporosis therapy (16,17). FGF-23 antagonism with a monoclonal antibody to FGF23, burosumab, is now used to treat FGF23-mediated disorders causing renal phosphate wasting (18).


The osteoclast resorbs bone. It is a terminally-differentiated, large, multinucleated giant cell that arises from hematopoietic marrow precursors under the influences of hormones, growth factors, and cytokines (3). The osteoclast resorbs bone by attachment with a ruffled border through adhesion molecules and by secretion of hydrogen and chloride ions that dissolve mineral and lytic proteases, notably lysosomal proteases active at low pH and metalloproteinases and cysteine proteinases that dissolve matrix. One enzyme involved in bone resorption, (cathepsin K), has been an investigational target for treatment of osteoporosis (19).  In contrast to the receptor-rich osteoblast, the mature osteoclast has few receptors, but it robustly expresses the receptor for CT. After completing its function, the terminally-differentiated osteoclast undergoes apoptosis.


Bone-lining cells are flat, elongated cells that cover inactive bone surfaces. Their function is unknown, but they may be osteoblast precursors or function to clean up resorption and formation debris. Mast cells can be seen at sites of bone resorption and may also participate in this process. Cells of the immune system play a key role in bone metabolism, especially resorption, by their interactions with bone cells that are described later.


BONE GROWTH, MODELING AND REMODELING


Growth, modeling, and remodeling are important processes that allow the skeleton to play its many important roles (1). Bone grows and models under the influence of metabolic, mechanical, and gravitational forces during growth through adolescence, changing its size and shape in the process. Bone growth continues until approximately the third decade. Bone mass continues to increase until the fourth decade (Figure 4).


Figure 4. Peak Bone Mass. Schematic representation in relative units of normal skeletal development, demonstrating changes in bone resorption and formation. The crossover of formation/resorption occurs during the fourth decade. In osteoporosis, there is an accelerated loss of bone because of increased resorption and decreased formation. (see Acknowledgements).


Bone in adults renews itself by remodeling, a cycle in which old bone is first resorbed and new bone is then formed to replace it (1-3). Both cortical bone and trabecular bone remodel, but the latter is more metabolically active. Bone remodeling can be divided into several stages that include resorption by osteoclasts and formation by osteoblasts. Remodeling serves to repair skeletal microdamage and to improve skeletal strength in response to mechanical forces. Osteoclasts and osteoblasts communicate with each other during remodeling in a process that is referred to as coupling and mediated by local regulatory signals that are discussed subsequently. Coupling assures a balance of bone formation and bone resorption in the adult skeleton. The process of bone formation is thus balanced by the process of bone resorption.

Cortical bone is resorbed by “cutting cones” of osteoclasts that tunnel through it (2).  Trabecular bone remodels on its surface. Most remodeling occurs in trabecular bone and on the endosteal surfaces of cortical bone, with little periosteal remodeling. However, in diseases like hyperparathyroidism, subperiosteal resorption is activated. With aging, periosteal remodeling and expansion seems to compensate (mechanically) for bone loss at other sites.


Bone resorption is mediated by the osteoclast, a large, multinucleated cell that is molecularly equipped to dissolve both the mineral and organic phases of bone (1,3). The processes of osteoblast-mediated bone formation and osteoclast-mediated bone resorption can be assessed by measurement in urine and blood of bone markers. The markers of bone formation include osteoblast products (e.g., alkaline phosphatase and osteocalcin) and by-products of collagen synthesis such as procollagen-1 N-terminal peptide (P1NP).  Markers of bone resorption include osteoclasts products such as tartrate resistant acid phosphatase (TRAP) and by products of collagen breakdown such as such as N-terminal telopeptide (NTX) and C-terminal telopeptide (CTX) (20). Approximately 20% of adult bone surface is undergoing remodeling at any time. The homeostatic end-point of skeletal metabolism is to provide the appropriate amount of ambient calcium for the many biological functions that this ion serves, with the structural integrity of the skeleton taking second place. These metabolic activities of bone cells can release into blood and urine certain bone cell and matrix products that can serve as clinically useful markers of skeletal metabolism (Figure 5).


Figure 5. Schematic Representation of the Cellular and Skeletal Sources of Serum and/or Urinary Markers of Bone Formation and Bone Resorption. Abbreviations: BGP, bone gamma carboxyglutamic acid (GLA) protein (osteocalcin); PICP, C-terminal propeptide of type I procollagen; P1NP, N-terminal propeptide of ty pe I procollagen; BAP, bone-specific alkaline phosphatase; AP, alkaline phosphate; TRAP, tartrate-resistance acid phosphatase; NTX, N-terminal cross-linked telopeptide of type I collagen; CTX, C-terminal cross-linked telopeptide of type I collagen; OH, hydroxyproline glycoside; OL, hydroxylysine glycoside; PYD, pyridinoline (total, free); DPD, deoxypyridinoline (total, free). (see Acknowledgments).


RANKL, RANK, AND OPG


The elucidation of this pathway of molecular regulation has provided both a physiologic link among bone cell functions as well as a pathogenic link among cancer cells, the immune system, and bone cells in the regulation of the osteoclastic bone resorption that is the final cellular mediator of most cases of hypercalcemia (Figure 1) (21,22). The molecular participants in this pathway are the membrane-associated protein named RANKL (receptor activator of nuclear factor kappa B ligand,) a member of the tumor necrosis factor family of cytokines; its cognate receptor, RANK, and OPG (osteoprotegerin), a soluble “decoy” receptor for RANKL.


In the physiology of bone metabolism, RANKL is expressed on the surface of osteoblastic stromal cells (21). By binding to RANK, its receptor, on osteoclast precursors, RANKL enhances their recruitment into the osteoclastogenesis pathway in the physiology of bone metabolism. RANKL also activates mature osteoclasts to resorb bone. RANKL is considered to be a “coupling factor” through which osteoblasts regulate osteoclasts and bone formation is coupled to bone resorption. In the pathophysiology of hypercalcemia, many of the tumor cell types that are associated with cancer-stimulated bone resorption express a soluble form of RANKL, sRANKL. Furthermore, during the inflammation that can be associated with malignancy, activated T-lymphocytes also express increased amounts of RANKL, which can stimulate osteoclasts. The activated lymphocytes also express interferon gamma (INF), which opposes the effect of RANKL on osteoclast mediated bone resorption. The osteoclastic effects of RANKL can also be attenuated by its soluble decoy receptor, OPG, also produced by osteoblasts and tumor cells. Hypercalcemia results when these opposing regulatory interactions of RANKL, RANK, OPG, and INF allow osteoclastic activation to predominate (Figure 5).


These molecular participants in the interaction between bone cells, tumor cells, and the immune system are also regulated by several hormones, growth factors, and cytokines that mediate increased bone resorption, both physiologic and pathophysiologic. They include PTH, PTHrP, TNF, PGE2, vitamin D metabolites, IL-1, and TGF (22).


An antibody to RANKL (denosumab) decreases bone resorption, increases bone density, and decreases fractures and is FDA approved for treatment of osteoporosis (23).


Furthermore, defects in this system may cause bone diseases.  Loss of function mutations of OPG are responsible for the excess bone resorption in juvenile Paget’s disease and gain of function mutations of RANK cause familial expansile osteolysis and expansile skeletal hyperphosphatasia (24,25).


Figure 6. Schematic representation of the cellular and molecular mechanisms of the effects of OPG, RANK, and RANKL on skeletal metabolism. A variety of skeletal and non-skeletal cells can express several cell products [in brackets] that regulate the balance between osteoblastic bone formation (left) and osteoclastic bone resorption (right). They include PTHrP (parathyroid hormone related protein); 1, 25 Vit D (1, 25- dihydroxyvitamin D); prostaglandins, especially of the PGE2 series; cytokines, especially interleukin 1 (IL-1); growth factors, especially TGF beta; RANKL (receptor activator of nuclear factor kappa B ligand), a cell membrane-associated member of the tumor necrosis factor family of cytokines; soluble RANKL (sRANKL); and their cognate receptor, RANK; and OPG (osteoprotegerin), a soluble “decoy” receptor for RANKL. The latter group are also expressed by osteoblast precursors as they develop into osteoblasts in the osteoblastic cascade (left). In addition to OPG, the stimulation of osteoclastic bone resorption by RANKL is opposed by activation of the gamma interferon receptor (INFR) by gamma interferon (INF) production by activated lymphocytes and by the peptide hormone, calcitonin. The relative activity of the osteoclast stimulatory effects of RANKL and sRANKL and the inhibitory effects of OPG and INF determine the balance between bone resorption and formation. Arrows indicate a positive (stimulatory) effect except where indicated by the negative sign, (-). Several growth factors in addition to TGF beta reside in bone matrix and can be released upon resorption to exert their biological effects, often osteoclast stimulation. They include BMP (bone morphogenetic proteins, especially BMP-2); FGF (fibroblast growth factor); PDGF (platelet derived growth factor); and IGFs in (insulin like growth factors). Macrophages may fuse into giant cells and resorb bone. (see Acknowledgements).


Activation of the LRP5/WNT system increases intracellular beta catenin which increases bone formation (26).  Gain-of-function mutations of LRP-5 cause a high bone density phenotype and loss-of-function mutations cause the osteoporosis-glioma syndrome (26).  Dkk1 and sclerostin inhibit this pathway and decrease bone formation and increase bone resorption.  Sclerostin production by osteocytes is increased with acute immobilization; resulting in decreased bone formation (27).  Loss-of-function mutations of sclerostin cause the high bone density conditions sclerosteosis and van Buchem disease (15).  A monoclonal antibody to sclerostin (romosozumab) increases bone formation and decreases bone resorption with resultant increased bone density and decreased fracture risk.  This drug is approved for women with post-menopausal osteoporosis at high risk for fractures (16,17).  Other monoclonal antibodies to sclerostin are being studied for treatment of osteogenesis imperfecta (OI) (28) and hypophosphatasia (29).


Figure 7. Wnt/β-catenin signaling pathway. A, In the absence of Wnt ligand, β-catenin is phosphorylated by GSK-3β leading to its degradation and pathway signaling inactivation. B, After Wnt binding to its LRP5/6 and Fz coreceptors, GSK-3β is inactivated. β-Catenin is then stabilized and accumulates in the cytoplasm. β-Catenin will consequently translocate into the nucleus where it affects gene expression. C, The secreted Dkk proteins bridge LRP5/6 and the transmembrane protein Krm. This results in the LRP5/6 membrane depletion by internalizing the receptors. As a consequence, Wnt signaling is inhibited. Sclerostin (Sost) also inhibits Wnt signaling through binding to LRP5/6, but its activity is independent of Krm proteins. Reprinted with permission from Baron, R and Rawadi G. Targeting the Wnt/β-Catenin Pathway to Regulate Bone Formation in the Adult Skeleton. Endocrinology 148: 2635-2643, 2007 Copyright (2007), The Endocrine Society.


HORMONAL REGULATION OF SKELETAL AND MINERAL METABOLISM PARATHYROID HORMONE


Parathyroid hormone is an 84-amino-acid peptide secreted by two pairs of parathyroid glands located adjacent to the back of the thyroid gland in the neck. There can also be ectopic parathyroid glands along their developmental route between the thyroid gland and mediastinum. The mature PTH is packaged into dense secretory granules for regulated secretion (1,2).


Secretory Regulation Of Parathyroid Hormone And The Calcium Sensor


PTH is synthesized as a 115 amino acid pre-pro-peptide, however, the 84 amino acid peptide is secreted by the parathyroid glands.  The major regulatory signal for PTH secretion is serum calcium (Table 17) (30). Serum calcium inversely affects PTH secretion, with the steep portion of the sigmoidal response curve corresponding to the normal range of both. An increase in ionized calcium inhibits PTH secretion by increasing intracellular calcium through the release of calcium from intracellular stores and the influx of extracellular calcium through cell membranes and channels. This mechanism differs from most cells, where secretion of their product is stimulated by increased calcium. Intracellular magnesium may serve this secretory function in the parathyroids in that hypermagnesemia can inhibit PTH secretion and hypomagnesemia can stimulate PTH secretion. However, prolonged depletion of magnesium will inhibit PTH biosynthesis and secretion, as it will the function of many cells. Hypomagnesemia also attenuates the biological effect of PTH by interfering with its signal transduction. Serum calcium also inversely regulates transcription of the PTH gene, and increased levels of 1,25-dihydroxyvitamin D (1,25-D) inhibit PTH gene transcription.  The parathyroid gland senses the concentration of extracellular ionized calcium through a cell-surface calcium-sensing receptor (CaSR) for which calcium is an agonist. The same sensor also regulates the responses to calcium of thyroid C cells, which secrete CT in direct relationship to extracellular calcium; the distal nephron of the kidney, where calcium excretion is regulated; the placenta, where fetal-maternal calcium fluxes occur; and the brain and gastrointestinal (GI) tract, where its function is unknown, and bone cells. Loss-of-function mutations of the CaSR cause familial hypocalciuric hypercalcemia (FHH) 1 (31). Two other mutations downstream in this pathway (GNA11 and AP2S1) have been identified that cause FHH2 and FHH3 respectively (31).  Gain-of-function mutations of CaSR and GNA11 cause autosomal dominant hypocalcemia (ADH) type 1 and type 2 respectively (32).


Drugs have been identified that allosterically activate the CaSR (calcimimetics) and are useful treatment agents; they are available for treatment of the increased PTH secretion that occurs in secondary hyperparathyroidism of renal failure (oral cinacalcet, intravenous etelcalcetide) (33) severe primary hyperparathyroidism (oral cinacalcet), and parathyroid cancer (oral cinacalcet )(34). Calcilytic agents which antagonize the CaSR are being studied for treatment of ADH (35).

FGF23 may also inhibit PTH secretion, an action that requires binding to the FGF receptor and the co-receptor alphaKlotho (36).  (See below)


Table 17. Regulation of PTH Biosynthesis and Secretion

Ambient calcium acting through the calcium sensing receptor (CaSR)

Vitamin D [1,25(OH)2D]

Ambient phosphorus

FGF23

Other


Some studies fail to demonstrate a direct effect of serum phosphate on PTH secretion, however, others show that high phosphate increases PTH biosynthesis and visa versa (4). However, serum phosphate has an inverse effect on calcium concentration and low ambient phosphate directly increases 1,25-D production. Thus, serum phosphate may directly and indirectly regulate PTH expression.


Metabolism And Clearance Of Parathyroid Hormone


Parathyroid hormone has a circulating half-life of less than 5 minutes (2,36). The hormone is metabolized to amino-terminal and carboxyl-terminal fragments primarily in the liver, also in the kidney, and perhaps in the parathyroid gland and blood. The carboxyl-terminal fragments are cleared by glomerular filtration (GF), so they accumulate in renal failure. All of the classic biological effects of PTH are mediated by the amino terminus, PTH1-34, and likely a subpeptide of this sequence, but other fragments may have their own biologic actions. For example, the carboxy terminus may regulate calcium channel flux.


As a result of the biosynthesis, secretion, and metabolism of PTH, the circulation contains several forms of the molecule (36). The forms that comprise this heterogenous collection of PTH species include primarily native PTH1-84 and amino terminal, mid-region and carboxy terminal PTH fragments. Overall, 10-20% of circulating PTH immunoreactivity comprises the intact hormone, with the remainder being a heterogeneous collection of peptide fragments corresponding to the middle and carboxy regions of the molecule. Recent studies have demonstrated a PTH 7- 84 fragment that accumulates in renal failure and may even be secreted by the normal as well as abnormal parathyroid gland. While only the amino terminus of PTH can bind to the PTH receptor at a site that mediates its classical biological effects, which result in hypercalcemia, PTH 7 – 84 may act as an antagonist and/or weak agonist to PTH at its receptor. Nevertheless, it should be kept in mind that each of the circulating forms of PTH, regardless of biological activity, contain within them peptide sequences that can be recognized by a variety of immunoassay systems and thus complicate clinical interpretation.  The so-called intact PTH assays do not require the far amino-terminus of the molecule, a sequence need for full biological activity. The intact PTH assays recognize both PTH 1-84 and PTH 7-84.  Newer assays, designated “bio-intact” or “whole” apparently do not recognize PTH 7-84, but there does not appear to be any clear clinical advantage of the “whole” compared to intact PTH assays (37).


Biologic Effects Of Parathyroid Hormone


Parathyroid hormone regulates serum calcium and phosphorus concentrations through its receptor-mediated, combined actions on bone, intestine, and kidney (3,38). The skeletal effects of PTH on bone are complex. High levels of PTH, as seen in primary and secondary hyperparathyroidism, increase osteoclastic bone resorption. Low levels, especially if delivered episodically, seem to increase osteoblastic bone formation, an effect that has been applicable to osteoporosis treatment by daily injections of teriparatide (PTH 1-34) (39) and the PHTrP analogue, abaloparatide (40). The skeletal effects of PTH are mediated through the osteoblast, since they are the major expressor of the PTH receptor. However, osteoblasts communicate with osteoclasts to mediate PTH effects. This communication seems mediated through the RANK-OPG pathway (21).


Any direct gastrointestinal (GI) effect of PTH on intestinal calcium or phosphate absorption is weak. However, PTH through its stimulating effects on the renal production of 1,25-D, discussed later, promotes the absorption of both. In the kidney, PTH increases the reabsorption of calcium, predominantly in the distal convoluted tubule, and inhibits the reabsorption of phosphate in the renal proximal tubule, causing hypercalcemia and hypophosphatemia. PTH also inhibits NA+/H+ antiporter activity and bicarbonate reabsorption, causing a mild hyperchloremic metabolic acidosis.


PTH mediates most of its effects through the PTH/PTHrP receptor (PTH1 receptor) (38). This receptor is an 80,000-MW membrane glycoprotein of the G protein receptor superfamily. The classic PTH receptor recognizes the amino-terminus of PTH and the homologous terminus of the parathyroid hormone-related protein (PTHrP) with indistinguishable affinity; it is therefore designated the PTH/PTHrP receptor. Both PTH and PTHrP generate cyclic adenosine monophosphate (cAMP) as a cellular second messenger by activating protein kinase A (PKA), and the phospholipase C effector system increasing cellular IP3 and calcium and activating protein kinase C (PKC). There may be some tissue specificity as to which pathway dominates.


In addition to this shared receptor, there is accumulating evidence for the existence of receptors that are respectively specific for PTH and PTHrP and for some of their subpeptides. The PTH2 receptor is activated by PTH but not PTHrP and is expressed in brain and pancreas (41).  For PTH, a carboxy-terminal peptide seems to mediate cellular calcium flux; for PTHrP, a nuclear localizing sequence (NLS) has been identified (38).


Table 18. Effects of Parathyroid Hormone on Calcium and Skeletal Metabolism


Bone

       Increases resorption

       Increases formation, especially at low and intermittent concentrations

Kidney

       Decreases calcium excretion (clearance)

       Increases phosphorus excretion

Gastrointestinal Tract

       Increases calcium and phosphorus absorption

       Indirect effect via 1,25-D production

Blood

       Increases calcium

       Decreases phosphorus


PTHrP is a major humoral mediator of the hypercalcemia of malignancy (1,3,22). The polypeptide is a product of many normal and malignant tissues (22). PTHrP is secreted by many types of malignant tumors, notably by breast and lung cancer, and produces hypercalcemia by activating the PTH/PTHrP receptor. PTHrP is produced in many fetal tissues, but as development proceeds its expression becomes restricted. PTHrP expression reappears in adult tissues when injury or malignancy occurs (22).


The PTHrP gene expresses three native forms of the polypeptide through alternate mRNA splicing, PTHrP 1-141, a truncated 139 residue form, and a 173 residue form expressed primarily in humans (37). Whereas PTHrP 1-139 is quite similar to PTHrP 1-141, PTHRP 1-173 completely diverges from both at its own carboxy terminus. The amino-terminus of PTHrP reacts with the shared PTH/PTHrP receptor and has the potential to produce most of the biological effects of native PTH, including hypercalcemia. Other cell products, such as cytokines and growth factors, are also likely to play a casual role in the hypercalcemia because of their direct and indirect skeletal actions.   As discussed later, these can be produced by the tumor cells or immune cells. TGF beta can also participate in pathogenesis by stimulating PTHrP production from tumors or immune cells as it is released from its skeletal reservoir upon resorption.


PTHrP is required for normal development as a regulator of the proliferation and mineralization of cartilage cells and as a regulator of local calcium transport. The amino terminus of PTHrP reacts with the PTH/PTHrP receptor and produces most of the biological effects of native PTH, including hypercalcemia. The PTHrP gene expresses three forms of polypeptide through alternate messenger ribonucleic acid (mRNA) splicing. In addition to mRNA splicing, processing of PTHrP into peptides is an important regulatory mechanism. Distinct biological properties have been attributed to the different PTHrP peptides, and specific receptors and effects have been identified.


Although multiple, the functions of PTHrP in malignant and normal tissues seem to be growth- and proliferation-related (22). In most physiologic circumstances, PTHrP carries out local rather than systemic actions. When produced in excess by malignancy, PTHrP has systemic effects, especially hypercalcemia. Because of its protean and developmental effects, PTHrP can be considered an oncofetal protein.


Malignancy and PTHrP


The hypercalcemia of malignancy is usually due to increased bone resorption that is caused by skeletal metastases or the production by the tumor of a “humour” that stimulates osteoclasts (22). It is likely that the first mechanism also involves the second, since most tumor cells do not have the capacity to directly resorb bone and more likely stimulate the neighboring osteoclast to do so through their “humours.” Many cell types and their products participate in and many tumor products have been implicated in the pathogenesis of the hypercalcemia of malignancy (Figure 5). The most common seems to be PTHrP, especially in solid tumors where abnormal PTHrP expression can be implicated in up to 80% of patients. Originally discovered as a product of malignant cells that produce hypercalcemia, PTHrP has been demonstrated to be a product of many normal and malignant tissues. The growing appreciation of the key role of PTHrP in the pathogenesis of the hypercalcemia of malignancy has revealed that ectopic PTH production by cancer cells is a rare event.


PTHrP expression was initially noted to be common in squamous cell cancers, but it has been subsequently shown that many other cancer types can overexpress PTHrP.  PTHrP production and secretion by breast and prostate cancers is especially common, occurring in more than half of the cases, with even a higher incidence in breast when the patient is hypercalcemic. Breast tumors that produce PTHrP are more likely to metastasize to bone, and breast cancers that metastasize to bone are even more likely to produce PTHrP. PTHrP is commonly expressed in lung cancer, especially in those lung cancers that metastasize to bone. While breast and lung cancer are among the most common PTHrP producing tumors that cause hypercalcemia, this pathway has been described in many cancers. PTHrP production that often accompanies prostate cancer does not usually cause hypercalcemia, perhaps because this tumor processes the polypeptide to a non-hypercalcemic peptide. It is notable that some non-malignant PTHrP-producing tumors can also be associated with hypercalcemia (42).


While PTHrP is the most common humour produced by malignant cell to cause osteoclast-mediated hypercalcemia, increased 1,25-dihydroxy vitamin D is causal in lymphomas and some leukemias.  Furthermore, certain cytokines, notably IL-1, and growth factors, notably TGF beta, can also produce hypercalcemia by stimulating osteoclastic bone resorption; but excess prostaglandin production is no longer considered an important hypercalcemic humour in malignancy.


VITAMIN D


Metabolism and Activation


Vitamin D is a secosterol hormone that is present in humans in an endogenous (vitamin D3) and exogenous (vitamin D2) form (43, 44). The endogenous form of vitamin D, cholecalciferol (vitamin D3), is synthesized in the skin from the cholesterol metabolite 7-dehydrocholesterol under the influence of ultraviolet radiation. Vitamin D3 is also available in oral supplements. An exogenous form of vitamin D (vitamin D2) (ergocalciferol) is produced by ultraviolet irradiation of the plant sterol ergosterol and is available through the diet. Both forms of vitamin D require further metabolism to be activated, and their respective metabolism is indistinguishable. Vitamin D metabolites are solubilized for transport in blood by specific vitamin D-binding proteins.


Figure 8. The Metabolic Activation of Vitamin D. Abbreviations: 25-D, 25-hydroxyvitamin D; 1,25-dihydroxyvitamin D; VDR, vitamin D receptor. Vitamin D from the diet or the conversion from precursors in skin through ultraviolet radiation (light) provides the substrate of the indicated steps in metabolic activation. The pathways apply to both the endogenous animal form of vitamin D (vitamin D3, cholecalciferol) and the exogenous plant form of vitamin D (vitamin D2, ergocalciferol), both of which are present in humans at a ratio of approximately 2:1. In the kidney, 25-D is also converted to 24-hydroxylated metabolites which seem generally inactive but may have unique effects on chondrogenesis and intramembranous ossification. The many effects (Table 8) of vitamin D metabolites are mediated through nuclear receptors or effects on target-cell membranes (see Acknowledgments).


In the liver, vitamin D is converted by a hydroxylase to 25-hydroxyvitamin D (25-D), the principal fat storage form of vitamin D (45). Thus, the serum level of 25-D is the best measure of overall vitamin D status. In the proximal tubule of the kidney, 25-D is 1alpha-hydroxylated to produce 1,25-D, the most active form of the hormone. The animal form is referred to as 1,25-dihydroxycholecalciferol. This hydroxylation step is up-regulated by several factors, the most important of which are PTH and low ambient concentrations of calcium, phosphorus, and 1,25-D itself. The 1alpha-hydroxylase that mediates this conversion in the kidney is also produced in the placenta and in keratinocytes. In certain disease states, macrophages (e.g., in sarcoidosis) and lymphocytes (e.g., in lymphoma) overexpress 1alpha-hydroxylase and produce hypercalcemia (46).


The normal serum concentration of 1,25-D is about 20-60 pg/ml. The kidney can also convert 25-hydroxyvitamin D to 24,25-dihydroxyvitamin D. Although this metabolite circulates at 100-fold higher than the concentration of 1,25-D, its biologic role is unclear. Some studies suggest that it is a degradation product with no important biological effects; others suggest that it is important in chondrogenesis and bone formation, especially intramembranous. Vitamin D and its metabolites are inactivated in the liver by conjugation to glucuronides or sulfates and oxidation of their side chains. Mutations of the 24-hydroxylase enzyme (CYP24A1) have been shown to cause hypercalcemia and hypercalciuria in infants and adults (47).  In this condition, 1,25(OH)vitamin D levels are elevated because of inadequate metabolism of 1,25(OH)2D (47).  Studies also suggest the presence of the C-3 epimer of 25(OH)D in serum (48).  The biologic importance of this epimer is unknown.


There is controversy about the optimal 25(OH) vitamin D level.  The Institute of Medicine (IOM) has suggested that a 25(OH) vitamin D > 20 ng/ml is adequate (49), while The Endocrine Society suggests that > 30 ng/ml is optimal (50).  The IOM suggests that supplements of 600-800 IU daily will produce adequate levels in most adults, with an upper safe dose of 4000 IU daily (49).


Biological Effects of Vitamin D and It’s Mechanism of Action


Vitamin D mediates its biological effects through its own member of the nuclear hormone receptor superfamily, the vitamin D receptor (VDR) (43). The receptor binds many vitamin D metabolites with affinities that generally mirror their biological effects, and 1,25-D thus has the highest affinity. The VDR regulates gene transcription by homodimerization and by heterodimerization to a retinoic acid X receptor (RXR). The complex binds to target DNA sequences and regulates the transcription of several genes important in mediating vitamin D’s effects on calcium and skeletal metabolism and its diverse biological effects. Vitamin D metabolites, as well as other steroid hormones, may also act through a membrane receptor to produce rapid changes in cellular calcium flux (Figure 7) (51).


There continues to be debate about the relative importance of Vitamin D2 and Vitamin D3 in human health and disease.  Administration of vitamin D3 may result in more persistent elevation of 25(OH)D than administration of vitamin D2 (52-54).


Intestinal Calcium Absorption


Vitamin D increases intestinal calcium absorption, primarily in the jejunum and ileum, by increasing calcium uptake through the brush border membrane of the enterocyte (Tables 8, 9, and 19). For this action, vitamin D induces the calcium-binding calbindins, which participate in calcium transport across the cell, and through its action on calcium transporting membrane structures (Figure 2), it promotes the efflux of calcium from the basolateral side of the enterocyte into the circulation. The initial effects of vitamin D on intestinal calcium absorption occur within minutes, so the actions of vitamin D on intestinal calcium transport may be also mediated by a membranous nongenomic receptor. The net result is an increase in the efficiency of intestinal calcium transport. In a vitamin D-deficient state, only 10 to 15% of dietary calcium is absorbed by the gastrointestinal tract, but with adequate vitamin D adults absorb approximately 30% of dietary calcium. During pregnancy, lactation, and growth, increased circulating concentrations of 1,25-D promote the efficiency of intestinal calcium absorption by as much as 50% to 80%. Vitamin D also regulates skeletal metabolism through the RANK pathway (Figure 6). 1,25-D also increases the efficiency of dietary phosphorus absorption by about 15 to 20%.


Table 19. Mechanisms of GI Calcium Absorption

Vitamin D Dependent

Duodenum > jejunum > ileum

Active transport across cells

        calcium binding proteins (calbindins)

        calcium channels and pumps

Na exchanger

Passive diffusion


Bone


The effects of vitamin D metabolites on bone are complex (1). By providing sufficient ambient calcium and/or through some other unappreciated direct effect, vitamin D promotes the mineralization of osteoid. Vitamin D causes bone resorption by mature osteoclasts, but this effect is indirect, requiring cell recruitment and interaction with osteoblasts. Vitamin D also promotes the fusion of monocytic precursors to osteoclasts. Vitamin D regulates the expression several bone proteins, notable osteocalcin. It promotes the transcription of osteocalcin and has bidirectional effects on type I collagen and alkaline phosphatase gene transcription


Kidney


The VDR is robustly expressed in the kidney, and acting through it, 1,25-D stimulates renal proximal phosphate reabsorption and maintenance of normal calcium reabsorption. However, compared to PTH, these effects are relatively weak (43).


Other Tissues


Vitamin D and its metabolites have protean effects on cell function and signaling (45). Although vitamin D has many in vitro effects on the immune system, no major immune defect is apparent in individuals who are deficient or who lack vitamin D or its receptor. Vitamin D also inhibits proliferation and stimulates maturation of epidermal keratinocytes, which robustly express the VDR. This antiproliferative effect is being used for the treatment of psoriasis, a hyperproliferative skin disorder. Since many persons who lack vitamin D receptors have lifelong alopecia totalis, vitamin D may play a role in the maturation of the hair follicle (55).


Many studies have suggested the association of low 25(OH)D levels with a variety of diseases including cardiovascular, metabolic, autoimmune, malignant, and neurologic disorders.  Thus far, these largely observational findings have not been confirmed in randomized trials (56).


Table 20. Effects of 1,25-D (1,25-dihydroxyvitamin D) on Mineral Metabolism

Bone

        Promotes mineralization of osteoid

        Increases resorption at high doses

Kidney

        Decreases calcium excretion

        Decreases phosphorus excretion

Gastrointestinal Tract

        Increases calcium absorption

        Increases phosphorus absorption

Blood

        Increases calcium

        Increases phosphorus


FGF23


FGF23 is a 251 amino acid peptide hormone produced by osteoblasts, osteocytes and flattened bone-lining cells.  O-glycosylation of FGF23 by UDP-N-acetyl-alpha-D-galactosmanine;  polypeptide N- acetylgalactosaminyl transferase 3 (GALNT3) at specific sites is required to prevent intracellular degradation of the intact active molecule.  The action of FGF23 is mediated by binding an FGF receptor (FGFR) with it’s coreceptor alphaKlotho (9,12).


FGF23 decreases production of the sodium phosphate cotransporters, Npt2a and Npt2c.  As these cotransporters increase phosphate reabsorption in the renal proximal tubule, FGF23 increases renal phosphate wasting.  FGF23 also decreases 1,25(OH)2D levels probably by decreasing the expression of the 1 alphahydroxylase enzyme and increasing production of the 24-hydroxylase enzyme (9,12).). 


FGF23 expression is regulated by phosphorus and by 1,25(OH)2D.  Although regulation by 1,25(OH)2D is believed to be via the vitamin D receptor, the mechanism of phosphate sensing is unknown.  Iron deficiency also increases FGF23 transcription and translation.  In normal subjects, however, increased processing of FGF23 prevents hypophosphatemia.  Patients with autosomal dominant hypophosphatemic rickets (ADHR), however, who have an abnormal FGF23 which is resistant to degradation may not be able compensate particularly when iron deficiency is present (57). 

.

X-linked hypophosphatemic rickets (XLH) (PHEX gene), autosomal dominant hypophosphatemic rickets (ADHR) (FGF23 gene), autosomal recessive hypophosphatemic rickets (ARHR) (DMP1, ENPP1, FAM20C genes), and tumor-induced osteomalacia (TIO) are associated with excessive FGF23 (58).  Interestingly, intravenous iron (especially iron carboxymaltose) may cause FGF23 mediated renal phosphate wasting, hypophosphatemia, and osteomalacia (59). Recently, a monoclonal antibody to FGF23 (burosumab) was approved for treatment of XLH and TIO (18). Loss-of-function mutations of GALNT3, FGF23, and alpha Klotho result in decreased intact FGF23 levels or decreased FGF23 action and result in hyperphosphatemia and tumoral calcinosis. (9, 58)


FGF23 is elevated in chronic kidney disease.  Elevations of FGF23 may be associated with progression of renal disease, left ventricular hypertrophy, cardiovascular events, and mortality.  It is not known whether these associations are due to FGF23 or are related to more severe underlying disease (9,12) FGF23 may be measured by a c-terminal assay which measures full-length FGF23 in addition to c-terminal fragments as well as by an intact assay.  FGF23 in both assays is elevated or inappropriately normal in XLH, ADHR, ARHR, and TIO.  In tumoral calcinosis due to FGF23 and GALNT3 mutations, these assays may be discordant with elevated C-terminal FGF23 and reduced intact (active) FGF23.  FGF23 measured by both assays is elevated in TC caused by Klotho mutations (58) because of resistance to FGF23.


Table 21. FGF23 Secretion and Action

FGF23 Secretion

            Increased by high phosphate

            Increased by high 1,25(OH)2D


FGF23 Action

            Mediated via FGF receptor and Klotho

            Increases renal phosphate wasting

            Decreases production of 1,25(OH)2D

            Lowers serum phosphate


CALCITONIN


Calcitonin is a 32-amino acid peptide whose main effect is to inhibit osteoclast-mediated bone resorption (60). CT is secreted by parafollicular C cells of the thyroid and other neuroendocrine cells. Hypercalcemia increases secretion of hypocalcemia-inducing CT while hypocalcemia inhibits secretion (61). CT secretion is controlled by serum calcium through the same CaSR that regulates PTH secretion, but in an inverse manner and at higher concentrations of calcium. CT directly inhibits bone resorption by inactivating the CT-receptor rich osteoclast. CT also inhibits the renal reabsorption of phosphate, thus promoting renal phosphate excretion. CT also induces a mild natriuresis and calciuresis, the latter contributing to its hypocalcemic effect. However, calcitonin does not appear to have a major effect on human calcium metabolism as evidenced by normocalcemia in thyroidectomized patients as well as patients with medullary thyroid cancer and very high calcitonin levels (10,60).  Calcitonin in pharmacologic doses has been used to decrease bone resorption in osteoporosis, Paget’s bone disease, and hypercalcemia of malignancy (10).   It is unclear whether long-term use of calcitonin is associated with increased cancer risk (62).


Table 22. Regulation of Calcitonin Secretion

Calcium and related ions (CaSR)

Age and gender

Gastrointestinal factors


The CT receptor, like the PTH and calcium-sensing receptor, is a heptahelical G protein-coupled receptor coupled to the PKA, PKC, and Ca++ signal transduction pathways (63, 64).


The CT gene through alternative exon splicing and polypeptide processing ultimately encodes two peptide products, CT in thyroid C-cells which is processed from a 141-amino acid precursor, and a 37-amino peptide called gene-related peptide (CGRP) in neural tissues which is processed from a 128-amino acid precursor (1,65). CGRP is weakly recognized by the CT receptor and thereby has a CT-like effect on osteoclasts and osteoblasts. CGRP also acts through its own receptor to produce vasodilation and to act as a neurotransmitter. In addition to its role in calcium and skeletal metabolism, CT is important as a tumor marker in medullary thyroid carcinoma and other neuroendocrine tumors. The receptor that mediates the effects of the peptide products of the CT gene can be modulated by accessory proteins to alter binding characteristics (65).


Table 23. Effects of Calcitonin on Mineral Metabolism

Bone

·       Inhibits resorption

Kidney

·       Increases calcium excretion

·       Increases phosphorus excretion

Gastrointestinal Tract

·       ? Inhibitory effect on calcium/phosphorus absorption

Blood

·       Decreases calcium

Decreases phosphorus


OTHER HORMONES


In addition to the primary calcemic hormones, other hormones play an important role in calcium and skeletal metabolism (1-3). Gonadal steroids maintain skeletal mass.  Estrogen deficiency is a major factor in the development of postmenopausal osteoporosis by permitting increased bone resorption.  There is controversy about whether the elevation in FSH that accompanies menopause also contributes to increased bone resorption (66).  In an animal model, a blocking antibody to the beta subunit of FSH decreased bone resorption (67).  Glucocorticoids have significant deleterious effects on the skeleton including decreased bone density, increased fracture risk, and increased risk of avascular necrosis (68). Glucocorticoids transiently increase bone resorption, chronically decrease bone formation and cause osteoblast and osteocyte apoptosis (68). Insulin, growth hormone, and thyroid hormones promote skeletal growth and maturation. Excess production of the latter can cause hypercalcemia (Table 24).


Table 24. Effects of Calcitonin on Mineral Metabolism

Decrease Bone Resorption

         Calcitonin

         Estrogens

Increase Bone Resorption

         PTH/PTHrP

         Glucocorticoids (early)

         Thyroid Hormones

         High dose vitamin D

         ? FSH

Increase Bone Formation

        Growth Hormone

         Vitamin D Metabolites

         Androgens

         Insulin

         Low-dose PTH/PTHrP

Decrease Bone Formation

         Glucocorticoids (also increase osteocyte apoptosis)


SUMMARY


Through their actions and interactions on bone, kidney and the gastrointestinal (GI) tract, the calciotropic hormones, parathyroid hormone (PTH), FGF23, and vitamin D metabolites, especially 1,25-D, act to maintain serum (and extracellular fluid) calcium within a normal range, a range that optimally subserves many calcium-requiring physiological functions such as neural transmission and muscle contraction.  Perturbations in serum calcium, which plays an important role in regulating the concentrations of the calciotropic hormones, will cause a homeostatically appropriate and reciprocal change in the secretion of PTH by the parathyroid glands. These responses are designed to return the serum calcium, and, to a lesser extent, the serum phosphorus and magnesium to normal, with the skeleton acting as a reservoir for these minerals that can be emptied or filled.  During the last several years, a more physiologically integrated view of calcium metabolism has emerged. The metabolism of the skeleton has been linked to the metabolism of glucose in a manner that coordinates the regulation of bone mass with energy expenditure. And in addition to peripheral hormone regulation, the CNS exerts important regulatory effects on both systems, which encompass calcium and glucose metabolism, body and skeletal mass regulations, and energy expenditure and appetite.


The patient with hypoparathyroidism will have hypocalcemia with an inappropriately normal or low PTH and low 1,25(OH)2D.


The patient with nonparathyroid hypocalcemia will have an increased serum PTH and1,25-D (unless vitamin D stores are severely reduced). This will result in increased GI absorption of calcium, increased bone resorption, and decreased renal calcium excretion all acting to increase the serum calcium toward normal.


The patient with primary hyperparathyroidism will have hypercalcemia and inappropriately normal or elevated PTH.  The patient with PTH-independent hypercalcemia (e.g., due to bone metastases) will have a decreased serum PTH and 1,25-D (unless the hypercalcemia is PTHrP-mediated or calcitriol-mediated). This will result in decreased GI absorption of calcium, decreased bone resorption, and increased renal calcium excretion all acting to decrease the serum calcium toward normal.  Although these compensatory mechanisms act to restore serum calcium to normal, the homeostasis will not be complete until the primary abnormality has been corrected. In addition to these calciotropic hormones, other hormones, cytokines, and growth factors play an important role in calcium metabolism. Among the other important hormones are insulin, growth hormone, and the gonadal and adrenal steroids and thyroid hormone (Table 20).  They are discussed in other chapters.


FGF23 is an important phosphate regulator with excess action causing renal phosphate wasting, hypophosphatemia, and low 1,25(OH)2D and decreased action causing renal phosphate retention, hyperphosphatemia, and inappropriately high 1,25(OH)2 D levels.


CLINICAL IMPLICATIONS


The clinician can consider a simplified scheme when confronted with a patient with a disorder of calcium and skeletal metabolism – the serum or urinary calcium can be abnormally high or low and bone density can be increased or decreased.


In practical terms, when the serum calcium is high, primary hyperparathyroidism, granulomatous and inflammatory conditions causing unregulated 1,25D production, and malignancy are at the top of the diagnostic list.  When the serum calcium is low, hypoparathyroidism, malabsorption, vitamin D deficiency, and kidney disease should be considered.


Chronically abnormal phosphate levels in the non-acutely ill patient may be caused by renal failure, renal tubular defects, and abnormalities of FGF23 action.

When bone density is decreased, it is usually due to osteoporosis or osteomalacia; when increased, osteopetrosis and other osteosclerotic disorders should be considered.

These diagnostic categories can be properly assigned when one considers the interaction among the calcium regulating hormones that have been described in this chapter and orders the appropriate diagnostic tests. In most cases, the correct diagnosis is readily made.


ACKNOWLEDGEMENTS


The authors substantially and expressly relied on the following publications for the information presented in this text: Deftos, LJ: Immunoassays for PTH and PTHrP In: The Parathyroids, Second Edition, JP Bilezikian, R Marcus, and A Levine (eds.), Chapter 9, pp.143-165, 2001. Deftos LJ and Gagel R: Calcitonin and Medullary Thyroid Carcinoma In: Cecil Textbook of Medicine, Twentieth First Edition, JB Wyngarden and JC Bennett, Chapter 265, pp.1406-1409, 2000. Deftos, LJ: Clinical Essentials of Calcium and Skeletal Metabolism, Professional Communication Inc, First Edition, pp. 1-208, (Figures 1,3-5 and Table 2) 1998 (Published on-line at Medscape.com). The following Chapters in Felig, P and Frohmer, LA. Endocrinology and Metabolism, 4th Edition, McGraw-Hill, 2001: Chapter 22, Mineral Metabolism, Bruder, Guise, and Mundy. Chapter 23, Metabolic Bone Disease, Singer. Chapter 27. Multiglandular Endocrine Disorders, Deftos, Sherman, and Gagel. Deftos, LJ: Hypercalcemia in malignant and inflammatory diseases. Endocrinology and Metabolism Clinics of North America, 31:1-18, (Figure 2) 2002.


This work was supported by the National Institutes of Health and the Department of Veterans Affairs (Dr. Deftos). Drs. Shaker and Deftos have no relevant conflicts of interest.


REFERENCES


  1. Deftos, LJ: Clinical Essentials of Calcium and Skeletal Metabolism, Professional Communication Inc, First Edition, pp. 1-208, 1998 (Published on-line at Medscape.com).
  2. Brown EM: Physiology of Calcium Homeostasis. In: The Parathyroids, Second Editon, JP Bilezikian, R Marcus, and A Levine (eds.); Chapter 10, pp. 167-182, 2001.
  3. Bruder JM, Guise TA, and Mundy GR: Mineral Metabolism. In: Endocrinology & Metabolism, Fourth Edition, P. Felig and LA Frohman (eds.); Chapter 22, pp.10791159, 2001.
  4. Drezner, MK: Phosphorus Homeostasis and Related Disorders. In: Principles of Bone Biology, Second Edition, JP Bilezikian, LG Raisz, and GA Rodan (eds.); Chapter 22, pp.321-338, 2002.
  5. Yanagawa N and Lee DBN: Renal Handling of Calcium and Phosphorus. In: Disorders of Bone and Mineral Metabolism, FL Coe and MJ Favus (eds.); Chapter 1, pp.3-40, 1992.
  6. Favus MJ: Intestinal Absorption of Calcium, Magnesium, and Phosphorus. In: Disorder of Bone and Mineral Metabolism, FL Coe and MJ Favus (eds.); Chapter 3, pp. 57-82, 1992.
  7. Reuss, L: Basic Mechanisms of Ion Transport. In: The Kidney, Third Edition, DW Seldin and G Giebisch (eds.); Chapter 3, pp.85-106, 2000.
  8. Berger UV, Peng JB, and Hedier MA: The membrane transporter families in mammals. In: The Kidney, Third Edition, DW Seldin and G Giebisch (eds.); Chapter 4, pp. 107-138, 2000.
  9. White KE and Econs MJ. Fibrobalst growth factor-23 (FGF23). In Primer on the Metabolic Bone Diseases and Disorders of Mineral Metabolism, 8th Edition, Rosen CJ (ed); Chapter 24, pp. 188-194, 2013.
  10. Watts NB. Estrogens, Estrogen agonists/antagonists, and calcitonin. In Primer on the Metabolic Bone Diseases and Disorders of Mineral Metabolism, 8th Edition, Rosen CJ (ed); Chapter 48, pp. 408-411, 2013
  11. Doshi, S. M., & Wish, J. B. (2022). Past, Present, and Future of Phosphate Management. In Kidney International Reports (Vol. 7, Issue 4, pp. 688–698). Elsevier BV. https://doi.org/10.1016/j.ekir.2022.01.1055
  12. Bhattacharyya N, Chong WH, Gafni RA, Collins MT. Fibrobalst growth factor23:state of the field and future directions. Trends Endocrinol Metab 23: 610-618, 2012.
  13. Gimble JM. Leptin’s balancing act between bone and fat. J Bone Min Res 26: 1694-1697, 2011.
  14.  Rached MT , Kode A , Silva BC ,et al.  Fox01 expression in osteoblasts regulates glucose    homeostasis through regulation of osteocalcin in mice. J Clin Invest. 120: 357-68, 2010.
  15.  Bonewald LF. The Role of the Osteocyte in Bone and Nonbone Disease. Endocrinol Metab  Clin North Am. 2017;46(1):1-18.
  16.  McClung MR, Grauer A Boonen S et al. Romosozumab in Postmenopausal Women with Low Bone Mineral Density. New Eng. J. Med 370: 412-420, 2014.
  17. Cosman F,Crittenden DB,Adachi JD et al. Romosozumab Treatment in Postmenopausal Women with Osteoporosis. N Engl J Med: 375:1532-43, 2016.
  18. Athonvarangkul D, Insogna KL. New Therapies for Hypophosphatemia-Related to FGF23 Excess. Calcif Tissue Int. 2021 Jan;108(1):143-157. doi: 10.1007/s00223-020-00705-3. Epub 2020 Jun 5. PMID: 32504139.
  19. Langdahl B, Binkley N, Bone H et al. Odanocatib in the treatment of postmenopausal women with low bone mineral density: five years of continued therapy in a phase 2 study. J Bone Min Res. 27: 2251-2258, 2012.
  20. Marian Schini, Tatiane Vilaca, Fatma Gossiel, Syazrah Salam, Richard Eastell, Bone Turnover Markers: Basic Biology to Clinical Applications, Endocrine Reviews, 2022;, bnac031, https://doi.org/10.1210/endrev/bnac031
  21. Lacey DL, Timms E, Tan HL, et al. Osteoprotegerin ligand is a cytokine that regulates osteoclast differentiation and activation. Cell 93:165-176, 1998.
  22. Deftos, LJ: Hypercalcemia in malignant and inflammatory diseases. Endocrinology and Metabolism Clinics of North America 31:1-18, 2002.
  23. Cummings, S. R., Martin, J. S., McClung, M. R., Siris, E. S., Eastell, R., Reid, I. R., Delmas, P., Zoog, H. B., Austin, M., Wang, A., Kutilek, S., Adami, S., Zanchetta, J., Libanati, C., Siddhanti, S., & Christiansen, C. (2009). Denosumab for Prevention of Fractures in Postmenopausal Women with Osteoporosis. In New England Journal of Medicine (Vol. 361, Issue 8, pp. 756–765). Massachusetts Medical Society. https://doi.org/10.1056/nejmoa0809493.
  24.  Whyte, M.P., Obrecht, S.E., Finnegan, P.M., Jones, J.L., Podgornik, M.N., McAlister, W.H., et al.  Osteoprotegerin deficiency and juvenile Paget’s disease.  N Engl J Med 347: 175-184, 200
  25. Whyte, M.P. and Hughes, A.E. Expansile skeletal hyperphosphatasia is caused by a 15-base pair tandem duplication in TNFRSF11A encoding RANK and is allelic to familial expansile osteolysis.  J Bone Miner Res 17: 26-29, 2002.
  26. Van Hul W, Balemans W. Minireview: The Genetics of Low-Density Lipoprotein Receptor-Related Protein 5 in Bone: A Story of Extremes. Endocrinology 148:2622–2629, 2007.
  27. Battaglino RA, Sudhakar S, Lazzari AA, Garshick E, Zafonte R, Morse LR. Circulating  sclerostin is elevated in short-term and reduced in long-term SCI. Bone 51: 600-605, 2012.
  28. 28. Glorieux, F. H., Devogelaer, J.-P., Durigova, M., Goemaere, S., Hemsley, S., Jakob, F., Junker, U., Ruckle, J., Seefried, L., & Winkle, P. J. (2017). BPS804 Anti-Sclerostin Antibody in Adults With Moderate Osteogenesis Imperfecta: Results of a Randomized Phase 2a Trial. In Journal of Bone and Mineral Research (Vol. 32, Issue 7, pp. 1496–1504). Wiley. https://doi.org/10.1002/jbmr.3143
  29. Fabre, S., Funck-Brentano, T., & Cohen-Solal, M. (2020). Anti-Sclerostin Antibodies in Osteoporosis and Other Bone Diseases. In Journal of Clinical Medicine (Vol. 9, Issue 11, p. 3439). MDPI AG. https://doi.org/10.3390/jcm9113439
  30. Brown EM, Hebert SC. Calcium-receptor-regulated parathyroid and renal function. Bone 20:303-309, 1997.
  31. Blau JE, Simonds WF. Familial Hyperparathyroidism. Front Endocrinol (Lausanne). 2021 Feb 25;12:623667. doi: 10.3389/fendo.2021.623667. PMID: 33716975; PMCID: PMC7947864.
  32. Roszko KL, Bi RD, Mannstadt M. Autosomal Dominant Hypocalcemia (Hypoparathyroidism) Types 1 and 2. Front Physiol. 2016 Oct 18;7:458. doi: 10.3389/fphys.2016.00458. PMID: 27803672; PMCID: PMC5067375.
  33. Patel J, Bridgeman MB. Etelcalcetide (Parsabiv) for Secondary Hyperparathyroidism in Adults With Chronic Kidney Disease on Hemodialysis. P T. 2018 Jul;43(7):396-399. PMID: 30013296; PMCID: PMC6027851
  34. Dong BJ.Cinacalcet: An oral calcimimetic agent for the management of hyperparathyroidism.  Clin Ther 11: 1725-51. 2005.
  35. Dong, B., Endo, I., Ohnishi, Y., Kondo, T., Hasegawa, T., Amizuka, N., Kiyonari, H., Shioi, G., Abe, M., Fukumoto, S., & Matsumoto, T. (2015). Calcilytic Ameliorates Abnormalities of Mutant Calcium-Sensing Receptor (CaSR) Knock-In Mice Mimicking Autosomal Dominant Hypocalcemia (ADH). In Journal of Bone and Mineral Research (Vol. 30, Issue 11, pp. 1980–1993). Wiley. https://doi.org/10.1002/jbmr.2551
  36. Nissenson RA and Juppner H. Parathyroid Hormone. In Primer on the Metabolic Bone Diseases and Disorders of Mineral Metabolism, 8th Edition, Rosen CJ (ed); Chapter 26, pp. 208-214, 2013.27.
  37. Deftos, LJ: Immunoassays for PTH and PTHrP In: The Parathyroids, Second Edition, JP Bilezikian, R Marcus, and A Levine (eds.), Chapter 9, pp.143-165, 2001.
  38. Segre GV, and Goldring SR: Serpentine receptors for parathyroid hormone, calcitonin and extracellular calcium ions. Baillieres Clin Endocrinol Metab 10:123-161, 1996.
  39. Neer, R. M., Arnaud, C. D., Zanchetta, J. R., Prince, R., Gaich, G. A., Reginster, J.-Y., Hodsman, A. B., Eriksen, E. F., Ish-Shalom, S., Genant, H. K., Wang, O., Mellström, D., Oefjord, E. S., Marcinowska-Suchowierska, E., Salmi, J., Mulder, H., Halse, J., Sawicki, A. Z., & Mitlak, B. H. (2001). Effect of Parathyroid Hormone (1-34) on Fractures and Bone Mineral Density in Postmenopausal Women with Osteoporosis. In New England Journal of Medicine (Vol. 344, Issue 19, pp. 1434–1441). Massachusetts Medical Society.https://doi.org/10.1056/nejm200105103441904
  40. Miller PD, Hattersley G, Riis BJ et al. Effect of Abaloparatide vs Placebo on New Vertebral Fractures in Postmenopausal Women With Osteoporosis: A Randomized Clinical Trial. JAMA. 316(7):722-733, 2016.
  41. On, J. S. W., Chow, B. K. C., & Lee, L. T. O. (2015). Evolution of Parathyroid Hormone Receptor Family and Their Ligands in Vertebrate. In Frontiers in Endocrinology (Vol. 6). Frontiers Media SA. https://doi.org/10.3389/fendo.2015.00028
  42. Knecht TP, Behling CA, Burton DW, Glass CK, Deftos LJ. The humoral hypercalcemia of benignancy. A newly appreciated syndrome. Am J Clin Pathol 105:487-492, 1996
  43. Haussler MR, Whitfield GK, Haussler CA, et al. The nuclear vitamin D receptor: biological and molecular regulatory properties revealed. J Bone Miner Res 13:325-349, 1998.
  44. Holick, MF: Photobiology and Noncalcemic Actions of Vitamin D. In: Principles of Bone Biology, Second Edition, JP Bilezikian, LG Raisz, and GA Rodan (eds.); Chapter 33, pp.587-602, 2002.
  45. Bikle DD. Vitamin D metabolism, mechanism of action, and clinical applications. Chem Biol. 2014 Mar 20;21(3):319-29. doi: 10.1016/j.chembiol.2013.12.016. Epub 2014 Feb 13. PMID: 24529992; PMCID: PMC3968073.
  46. Bell NH. Renal and nonrenal 25-hydroxyvitamin D-1a-hydroxylases and their clinical significance. J Bone Miner Res 13:350-353, 1998.
  47. Jacobs TP, Kaufman M, Jones G et al. A lifetime of hypercalcemia and hypercalciuria, finally explained. J Clin Endocrinol Metab 99: epub 1/13/2014.
  48. Lensmeyer G, Poquette M, Wiebe D, Binkley N.The C-3 epimer of 25-hydroxy D3 is present in adult serum. J Clin Endocrol Metab 97: 163-168, 2012.
  49. Ross AC, Manson JE, Abrams SA et al.The 2011 report on dietary reference intakes for calcium and vitamin D from The Institute of Medicine: What clinicians need to know. J Clin Endocrinol Metab 96, 53-58, 2011.
  50. Holick MF, Binkley NC, Bischoff-Ferrari et al. Evaluation, treatment, and prevention of vitamin D deficiency: an Endocrine Society clinical practice guideline. J Clin Endocrinol Metab 96, 1911-1930, 2011.
  51. Nemere I, Farach-Carson MC. Membrane receptors for steroid hormones: a case for specific cell surface binding sites for vitamin D metabolites and estrogens. Biochem Biophys Res Commun 248:443-449, 1998
  52. Armas LA , Hollis BW , Heaney RP . Vitamin D2 is much less effective than vitamin D3 in humans. J Clin Endocrinol Metab 89:5387-5391, 2004.
  53. Lehmann U, Hirche F, Stangl GI et al. Bioavailability of vitamin D2 and D3 in healthy volunteers, a randomized placebo-controlled trial. J Clin Endocrinol Metab 98:4339-4345, 2013.
  54. Hollick MF, Biancuzzo RM, Chen TC et al. Vitamin D2 Is as Effective as Vitamin D3 in Maintaining Circulating Concentrations of 25-Hydroxyvitamin D. J Clin Endocrinol Metab 93: 677-671, 2008.
  55. Peter J. Malloy, J. Wesley Pike, David Feldman, The Vitamin D Receptor and the Syndrome of Hereditary 1,25-Dihydroxyvitamin D-Resistant Rickets, Endocrine Reviews, Volume 20, Issue 2, 1 April 1999, Pages 156–188, https://doi.org/10.1210/edrv.20.2.0359
  56. Autier P, Boniol M, Pizot C, Mullie P. Vitamin D status and ill health: a systematic review. Lancet – Diabetes-Endocrinol. 2:76-89, 2014.
  57. 57. Liu, C., Li, X., Zhao, Z. et al.Iron deficiency plays essential roles in the trigger, treatment, and prognosis of autosomal dominant hypophosphatemic rickets. Osteoporos Int 32, 737–745 (2021).https://doi.org/10.1007/s00198-020-05649-w
  58. Econs MJ. Genetic diseases resulting from disordered FGF23/klotho biology. Bone 100:56-61, 2017.
  59. Schaefer, B., Tobiasch, M., Wagner, S., Glodny, B., Tilg, H., Wolf, M., & Zoller, H. (2022). Hypophosphatemia after intravenous iron therapy: Comprehensive review of clinical findings and recommendations for management. In Bone (Vol. 154, p. 116202). Elsevier BV. https://doi.org/10.1016/j.bone.2021.116202
  60. Deftos LJ and Gagel R: Calcitonin and Medullary Thyroid Carcinoma In: Cecil Textbook of Medicine, Twentieth First Edition, JB Wyngarden and JC Bennett, Chapter 265, pp.1406-1409, 2000.
  61. Deftos LJ, Weisman MH, Williams GW, et al. Influence of age and sex on plasma calcitonin in human beings. N Engl J Med 302:1351-1353, 1980.
  62. 62.    Medicines and Healthcare products Regulatory Agency. Calcitonin (Miacalcic): increased  risk of cancer with long-term use.  Published: 20 August 2012
  63. Deftos LJ. There’s something fishy and perhaps fowl about the mammalian calcitonin receptor and its ligand. Endocrinology 138:519-520, 1997. Editorial.
  64. McLatchie LM, Fraser NJ, Main MJ, et al. RAMPs regulate the transport and ligand specificity of the calcitonin-receptor-like receptor. Nature 393:333-339, 1998.
  65. Muff R, Born W, Fischer JA. Calcitonin, calcitonin gene-related peptide, adrenomedullin and amylin: homologous peptides, separate receptors and overlapping biological actions. Eur J Endocrinol 133:17-20, 1995.
  66. 66   Baron R. FSH versus estrogen: who's guilty of breaking bones?. Cell Metab. 2006;3(5):302-5.
  67. Zhu L, Blair H, Cao J et al, Blocking antibody to the beta subunit of FSH prevents bone loss by inhibiting bone resorption and stimulating bone synthesis.PNAS 2012: 109:14574-14579.
  68. Shaker JL and Lukert BP.Osteoporosis associated with excess glucocorticoids.  Endocrinology and Metabolism Clinics of North America 2005;34:341-356.