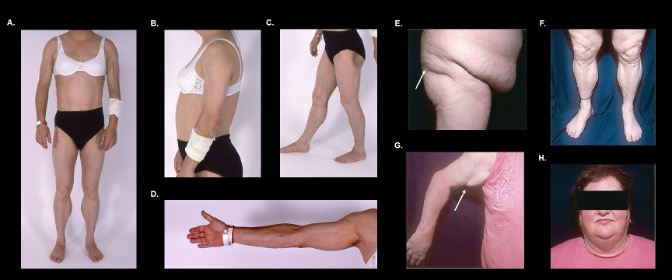
Figure 9. FPLD1. Heterogeneity in FPLD1. Patient in A to D presented with decrease in peripheral fat depots and preservation of abdominal fat. Patient in E to H has increased abdominal adiposity. The formation of a palpable “ledge” between the normal and lipodystrophic areas is shown (9C and 9E). (Images E-H used with permission by Dr. Jonathan Q. Purnell from publication Diabetes Care 2003;26(6):1819-24).
