ABSTRACT
Growth is a fundamental process of childhood and growth disorders remain one of the commonest reasons for referral to a pediatric endocrinologist. Growth can be divided into four phases – fetal, infancy, childhood and the pubertal phase with different hormonal components influencing growth at each stage. The GH-IGF1 axis plays a major role in the childhood phase of growth with a significant role alongside sex steroids during puberty while in infancy thyroid hormone and nutrition are vital. Although an uncommon cause of short stature disorders of the GH-IGF1 axis are extremely important due to the effectiveness of recombinant human growth hormone therapy for the child with GH deficiency (GHD). Here we review the diagnosis of growth hormone deficiency through a combination of auxology, biochemistry, imaging, and genetic testing. Particular focus is given to the accuracy of IGF-1/BP3 for diagnosis as well as the known problems with GH stimulation tests and GH assays. Isolated GHD is caused by mutations in GH1, BTK, and RNPC3 while GHD seen as part of multiple pituitary hormone deficiency is known to be caused by mutations in a wide variety of genes. A variety of structural malformations of the brain can be associated with congenital GHD with the commonest being the presence of an ectopic posterior pituitary or Septo-optic dysplasia. Acquired GHD is rarer and caused by tumors, radiotherapy, hypophysitis, and traumatic brain injury. Treatment with recombinant human GH is highly efficacious in improving height in children with GH deficiency and extremely safe. Short stature disorders are, rarely, also caused by a variety of other disorders of the GH-IGF1 axis. Resistance to growth hormone is seen in Laron syndrome and in mutations in IGF1 and IGF1R while decreased bioavailability of IGF1 is seen in ALS deficiency and PAPPA2 deficiency. Treatment with recombinant human IGF1 (rhIGF1) is available for those with IGF-I deficiency caused by either Laron syndrome or IGF1 mutations. rhIGF1 is effective in improving height but treatment is less effective than the use of GH to treat GH deficiency. The role of IGF1 in pre-natal growth is highlighted by the phenotype of patients with IGF1R or IGF1 mutations where pre-natal growth is commonly impaired and children born small for gestational age. GH excess is much rarer than GH deficiency in childhood and can be caused by pituitary adenomas, optic nerve gliomas (seen predominantly with NF1), McCune Albright syndrome, or Carney complex. Treatment is with surgery, somatostatin analogs, or GH receptor antagonists.
CASE STUDY
A 5-year-old girl was referred to her local community pediatrician by her health visitor with concerns about growth and poor calorie intake. Height at presentation was 91.5 cm (-4.1 SD) with weight 12.5 kg (-3.4 SD) and head circumference 48.8 cm (-2.5 SD). Her teeth were affected by multiple caries which made chewing hard foods painful and she therefore ate only soft foods. Development was reported to be normal and she was performing well in school. Her parents had noticed loud snoring and tonsils were enlarged on examination.
She was born at term by vaginal delivery with a birth weight of 3.5kg and was the youngest of 6 children. The parents were consanguineous (first cousins) and there was a family history of short stature in distant cousins. Mother was 147 cm tall (-2.7 SD) and father 165.1 cm (-1.5 SD). There was a history of diabetes mellitus type 2, diabetic nephropathy and thalassemia in mother and the father had a history of recurrent kidney stones.
On review in the endocrinology clinic prominent forehead, depressed nasal bridge and a high-pitched voice were noted. General investigations (detailed below) were normal; however, IGF-I and IGFBP-3 concentrations were low with high basal GH and peak GH concentrations (the latter >40µg/L). The combination of low IGF-I with raised GH concentrations suggested a diagnosis of GH insensitivity. In view of the history of snoring the patient was referred to an ENT surgeon who noted large prolapsing tonsils with mild apneic episodes on sleep study. Due to the propensity of IGF-I therapy to induce tonsillar hypertrophy, she underwent tonsillectomy.
Treatment with recombinant human IGF-I was started at the age of 6 years and 1 month initially with 0.6 mg (38 mcg/kg/) BD, increasing after 1 week to 1.1 mg (70 mcg/kg) BD and then to 1.7 mg (108 mcg/kg) BD. There were no problems with hypoglycemia. Height velocity increased from 3.6 cm/year to 10.3 cm/year over the first year of treatment. Sequencing of the GH receptor identified a known intronic point (A>G) mutation between exons 6 and 7 in which leads to inclusion of a pseudoexon and an additional 36 amino acids in the extracellular domain of the GHR.
At the age of 9 years and 3 months she was noted to be at breast stage 3 and in order to preserve height potential she has been treated with GnRH analogue (Zoladex LA). The IGF-I dose has been increased to maintain dose in the range 100 – 120 mcg/kg/BD and at 10 years 3 months height is 125.8 cm (-2.1 SD) with weight 32 kg (-0.2 SD). There has been some lipophypertrophy around the injection sites and she required an adenoidectomy due to a recurrence of her snoring (with daytime somnolescence) caused by a large obstructing adenoidal pad.
Baseline Investigations
Serum electrolytes, urea, creatinine, liver function tests, calcium, phosphate, hemoglobin – all normal
Karyotype 46 XX
TSH 2.2 mU/L (0.3 -5.0) free T4 17 pmol/L (11 - 24)
Prolactin 174 mU/l (85 – 250)
IGF-I <25 ng/mL (55 – 280)
IGFBP-3 0.7 mg/L (1.5 – 3.4)
ALS 3.2 mg/L (2.3 – 11)
Fasting glucose 4.0 mmol/L Insulin 2.1 mIU/L (2.3 - 26)
Skeletal survey – no evidence of skeletal dysplasia
Bone Age delayed by 18 months
Arginine stimulation Test
Time (min) Growth Hormone (µg/L)
-15 19.3
0 4.0
15 4.8
30 14
60 >40
90 >40
120 15.6
Standard Synacthen Test
Time (min) Cortisol (nmol/L)
0 min 213
30 min 624
60 min 742
GnRH Test at age 5 years
Time LH (IU/L) FSH (IU/L)
0 <0.1 1.7
30 2.7 14
60 3.3 18
INTRODUCTION
Growth is a fundamental process of childhood. It can be divided into four phases – fetal, infancy, childhood, and pubertal growth. Although growth occurs as a continuum, the endocrine control of each phase is distinct. The fetal phase includes the fastest period of growth with a crown-rump velocity of 62cm/year during the second trimester. Growth during this phase is dependent upon placental function and maternal nutrition in addition to hormonal factors especially IGF-I, IGF-II and insulin (1,2). Although size at birth (and hence fetal growth) is profoundly affected by IGF-I deficiency during fetal life (3), the effects of congenital GH deficiency are much less marked with a mild reduction in birth size (4).
Fetal Phase
During the first year of life, growth declines from an initial velocity of around 25cm/year to around 10cm/year. Previously it has been thought that during this period growth hormone did not have a significant influence on growth however it is now clear that children with growth hormone deficiency display reduced height velocity from birth (5). In addition to growth hormone, thyroid hormone and adequate nutrition are vital for normal growth during infancy.
Infancy Phase
During the first two years of life there is a significant period of catch-up or catch-down growth so while size at birth is not well correlated with parental height, by two years of age the correlation between parental and child heights significantly improves (6). It has been hypothesized that this catch up growth is the result of a central mechanism which detects the difference between the actual and expected size and acts to increase growth velocity (7). No experimental evidence exists for this hypothesis. The second hypothesis on the origin of this catch up/down growth is that it arises from alterations in growth plate senescence. Catch down growth is associated with a reduction in the number of stem cell divisions within the growth plate while catch up growth would be due to a compensatory increase in the number of stem cell divisions within the growth plate (8).
Childhood Phase
There is a gradual transition from the infancy phase into the childhood phase of growth from 6 months to 3 years of age. Prepubertal growth velocity is relatively constant between 4-7 cm/year with the lowest growth velocity of life occurring immediately before the onset of puberty. During childhood growth is mainly controlled by the influence of the GH-IGF-I axis along with thyroid hormone.
Pubertal Growth
The final phase of growth is puberty – the period of transition from the pre-pubertal state to the full development of secondary sexual characteristics and achievement of final height. Puberty begins with the onset of activity within the hypothalamic-pituitary-gonadal axis leading to the production of androgens (in males) and estrogen (in females). In males the first sign of pubertal development is enlargement of the testes while in females it is development of breast buds. The production of androgens and estrogen is associated with an increase in activity within the GH-IGF-I axis. Administration of testosterone to boys increased both GH and IGF-I concentrations (9) but this effect is dependent upon aromatization as co-administration of an estrogen receptor antagonist (10) or administration of dihydrotestosterone (11) (the active form of testosterone that cannot be aromatized) does not lead to an increase in GH or IGF-I concentrations. In girls there is also an increase in IGF-I levels and GH secretion during puberty but the mechanisms underlying this are less clear. Administration of oral or transdermal estrogen induces a decline in serum IGF-I concentrations and a consequent increase in GH secretion (12).
Fusion of the epiphyseal growth plates is induced by the activity of estrogen on ERα as patients with mutations in the genes encoding Erα (13) or aromatase enzyme (14) result in failure of fusion of the epiphyses and tall stature.
This chapter will firstly discuss the physiology of the GH-IGF-I axis along with signal transduction of GH and IGF-I and then consider the diagnosis and treatment of growth hormone deficiency before discussing individual pathological conditions associated with both GH deficiency and GH excess. Disorders leading to GH deficiency have been divided into congenital and acquired.
GH-IGF-I AXIS
Physiology of the GH-IGF-I Axis
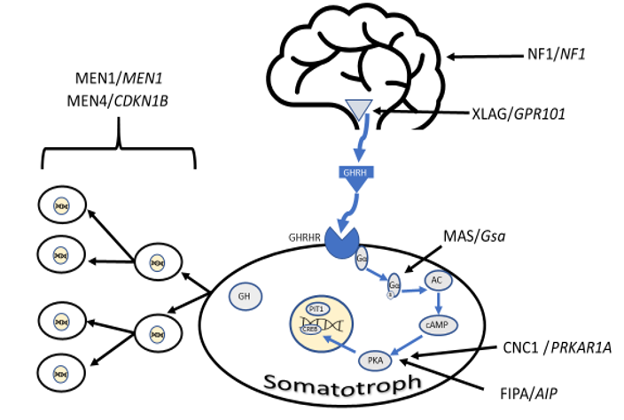
Release of Growth Hormone Releasing Hormone (GHRH) from the hypothalamus regulates the secretion of GH from the anterior pituitary both by increasing GH1 gene transcription and by promoting the secretion of stored GH. GHRH release is pulsatile and influenced by somatostatin and Ghrelin. Ghrelin is a 28 amino acid peptide produced in the stomach (15) and acts via the GH secretagogue receptor (GHSR). The active hormone is the octanoylated form produced by Ghrelin O-acetyltransferase(16) and is cleaved from the 117 amino acid preprohormone. In addition to the role in GH secretion Ghrelin also acts as an appetite stimulant (17) and stimulates the secretion of insulin (18), ACTH (19), and prolactin (19). In vivo the action of Ghrelin requires an intact GHRH system to influence GH secretion (20) but in vitro is capable of directly stimulating GH (15). Somatostatin is a peptide derived from pre-pro-somatostatin within neurons of the anterior periventricular nucleus which project to the median eminence. There are two main forms of somatostatin – 14 and 28 amino acid variants. It acts via the somatostatin receptors of which there are 5 subtypes (SSTR1-5). The anterior pituitary expresses SSTR1, 2, 3 and 5 (21). Somatostatin acts to decrease the secretion of GH by inhibiting GHRH secretion, directly inhibiting GH secretion in the anterior pituitary (22), antagonizing the activity of Ghrelin (20) as well as inhibiting its secretion (23). Somatostatin tone determines trough levels of GH and reductions in somatostatin tone are a major factor in determining the time of a pulse of GH. GH secretion is also stimulated by hypoglycemia and exercise. A summary of the factors influencing GH secretion is given in Figure 1.
GH is released from the somatotrophs of the anterior pituitary in a pulsatile manner with the pulses predominantly overnight, increasing in amplitude with age (24). The pulse amplitude is maximal in the pubertal years consistent with the raised IGF-I levels and growth velocity at this time (25). In males there is greater diurnal variation in peak amplitude, with higher peaks overnight and a lower baseline GH level compared to females. Overall GH production is higher in females. GH peak amplitude is linked to IGF-I concentrations while nadir GH is linked to waist-hip ratio (26).
Growth Hormone and GH signal Transduction
Growth Hormone (GH) is encoded by the GH1 gene located at chromosome 17q23.3 and is a 191 amino acid single chain polypeptide (27). There are 20 and 22kDa isoforms of GH generated by alternative splicing (the smaller isoform lacks amino acids 32-46) with the 20kDa accounting for around 10-20% of circulating GH (28). While GH1 is expressed within the anterior pituitary a 20kDa variant of GH is encoded by the GH2 gene but this is expressed in placenta and not in the pituitary (29).
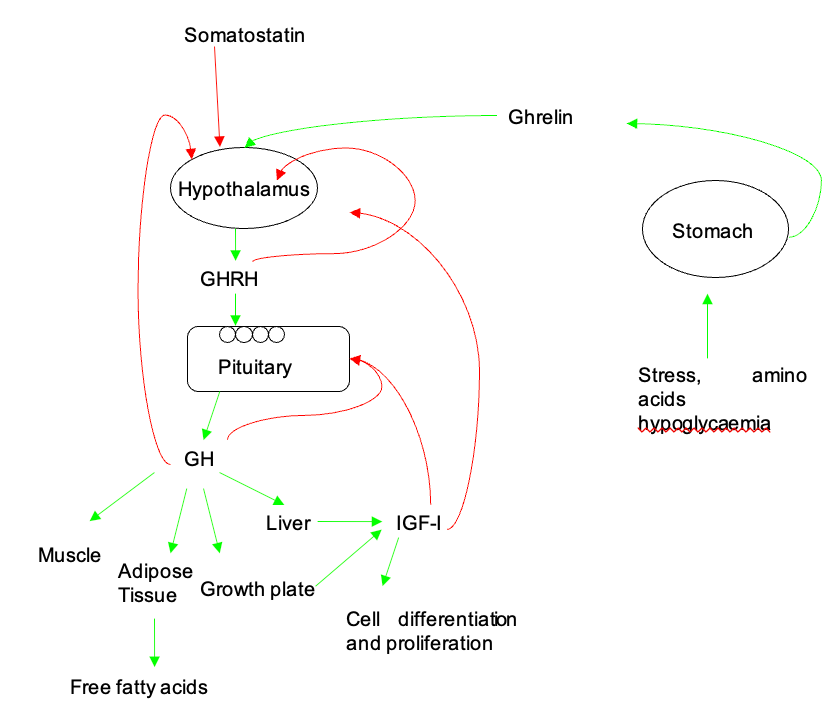
Figure 1. Physiology of the GH-IGF-I Axis. Release of GHRH from the hypothalamus is under the control of somatostatin (inhibitory) and Ghrelin (stimulatory). Alterations in GHRH tone led to pulsatile release of GH from the anterior pituitary. GH has widespread effects on muscle, fat and in the growth plate. IGF-I is produced in liver and in local tissues in response to GH stimulation. Red lines indicate feedback loops. Figure reproduced and adapted from Butcher I Molecular and Metabolomic Mechanisms Affecting Growth in Children Born Small for Gestational Age PhD thesis University of Manchester 2013.
In the circulation GH is bound to Growth Hormone Binding Protein (GHBP). GHBP is generated either by proteolysis cleavage of the extracellular domain of the growth hormone receptor (GHR) by metzincin metalloproteinase tumor necrosis factor-α converting enzyme (30) or by alternative splicing of the GHR (31). The 22kDa isoform of GH has the highest affinity for GHBP with the 20kDa and placental GH having a lower affinity (32). GHBP has a molecular mass of 60kDa and acts to prolong the half-life of GH with an increase from 11 minutes to 80 minutes (33). GHBP also acts to maintain the circulating pool of GH within the vasculature (34), reducing the ability of the circulating pool of GH to bind to peripheral GHRs.
The actions of GH are mediated via the GHR, a 620 amino acid protein containing a 246-residue extracellular domain, a single24 amino acid transmembrane helix and a 350 amino acid intracellular domain. The GHR gene is located on chromosome 5p13 and contains 10 exons. The GHR exists in a pre-dimerized form on the cell surface. In contrast to previous models, it is now recognized that dimerization per se is insufficient to initiate signaling (35). GH binds to the GHR via two binding sites – initial binding is via the high affinity site 1 followed by binding to the low affinity binding site 2 (36). GH binding induces a conformational change in the dimerized GHR including rotation of one of the GHR subunits (see Figure 2). This results in locking together of the extracellular receptor-receptor interaction domain and repositioning of the box 1 motifs in the intracellular domain increasing the distance between them. In turn this leads to repositioning of tyrosine kinases, including JAK2 (37). This repositioning is crucial to JAK2 activation. In the inactive state two JAK2 molecules (each attached to one of two dimerized GHRs) are positioned so that the kinase domain of one JAK2 molecule interacts with the inhibitory pseudokinase domain of the other JAK2 molecule. After repositioning, due to the conformational change induced by GH binding, the inhibitory kinase-pseudokinase interaction is lost and the kinase domains of each JAK2 molecule interact with each other leading to JAK2 activation (38).
Activation of the GHR results in JAK2 mediated phosphorylation of the signal transducers and activator of transcription proteins (STAT), including STAT1, STAT3, STAT5A and STAT5B. STAT5A and 5B are recruited to the phosphorylated GHR where their Src homology 2 (SH2) domain is phosphorylated by JAK2. STAT5A/B then homo- or heterodimers and translocate to the nucleus (37,39) (see Figure 3). Activation of STAT1 and STAT3 is also via phosphorylation by JAK2 but this does not require recruitment to the GHR. JAK2 also phosphorylates the Src homology domain of SHC (leading to activation of the mitogen activated protein kinase pathway) and the insulin receptor substrates (IRS-1, IRS-2 and IRS-3), which, in turn activate phosphatidylinositol-3 kinase and induces translocation of GLUT4 to the membrane. In addition to activation of JAK2, activation of the GHR also leads to direct activation of the Src family kinases, which are capable of activating the mitogen activated protein kinase pathway (40), and activation of protein kinase C via phospholipase C. Activation of protein kinase C stimulates lipogenesis, c-fos expression and increases intracellular calcium levels by activating type 1 calcium channels.
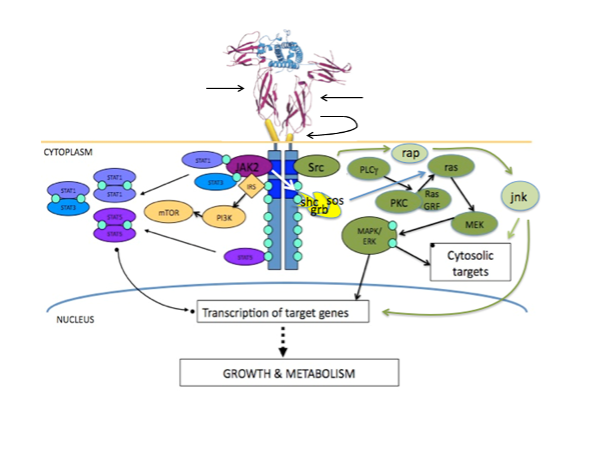
Figure 2. Growth hormone binding to the extracellular domain of the growth hormone receptor reorients the pre-existing homodimer so that one growth hormone receptor subunit rotates relative to the other. This structural reorientation is transmitted through the transmembrane domain resulting in a repositioning of tyrosine kinases bound to the cytoplasmic domain of the receptors. The distance between the box 1 motifs increases between inactive and active states and this movement is fundamental to activation of JAK2. Phosphorylation of JAK2 in turn leads to phosphorylation of STAT molecules, activation of the MAPK cascade and activation of IRS-1. STAT5a and STAT5b homo/heterodimerize and translocate to the nucleus. Figure kindly supplied by Dr Andrew Brooks, Institute for Molecular Bioscience, The University of Queensland.
GH signal transduction is regulated via several mechanisms: JAK2 is autoinhibitory with the pseudokinase domain inhibiting the catalytic domain (41), SHP1 binds to and dephosphorylates JAK2 in response to GH and GH also phosphorylates the transmembrane signal regulatory glycoprotein SIRPα1 which dephosphorylates JAK2 and the GHR.
The net result of GH signal transduction is the transcription of a set of GH dependent genes and the production of IGF-I the combination of which mediates the actions of GH including effects on cell proliferation, bone density, glucose homeostasis and serum lipids.
Insulin Like Growth Factors, Their Binding Proteins and Signal Transduction
INSULIN LIKE GROWTH FACTORS
The two insulin-like growth factors, IGF-I and IGF-II, are single chain polypeptide hormones sharing 50% homology with insulin. IGF-I is a 70 amino acid 7.5 kDa protein with four domains – A, B, C and D. The prohormone also contains a c-terminal peptide that is cleaved in the Golgi apparatus before secretion. IGF-II is a 67 amino acid peptide also with a molecular weight of 7.5 kDa. The mitogenic and, in part, the metabolic effects of GH are mediated via IGF-I rather than IGF-II. The IGFs circulate bound to the IGF binding proteins (IGFBPs), of which there are six classical high affinity IGFBPs. The IGFs form a ternary complex with an IGFBP and the Acid Labile Subunit (ALS), an 85kDa protein secreted by the liver. 99% of serum IGF-I is bound to a ternary complex which acts to prolong the half-life of IGF-I (42). IGF-I is produced in both the liver and in peripheral tissues and thus can act in an autocrine and paracrine manner.
IGF RECEPTORS
The IGF-1R is a transmembrane heterotetramer consisting of consisting of two extracellular α chains and two membrane-spanning β chains linked by several disulphide bonds (43). Ligand binding sites are present in the α subunits while the β subunits contain the juxtamembrane domain, tyrosine kinase domain and a carboxy terminal domain (44). Ligand binding to the α subunit activates the intrinsic tyrosine kinase activity of the β subunit which leads to autophosphorylation of tyrosine kinases in the juxtamembrane, tyrosine kinase and carboxy terminal domains. This autophosphorylation provides docking sites for substrates including the insulin receptor substrates (IRS-1, -2, -3, -4) and Shc. IRS-1 and Shc recruit the growth factor receptor bound protein 2 that associates with son of sevenless to activate the MAPK pathway. IRS-1 also activates PI3K via its regulatory subunit, p85, leading to activation of AKT which phosphorylates BAD and activates mTOR leading to inhibition of apoptosis and stimulation of proliferation. A summary of IGF-I signal transduction is given in Figure 3.
Mouse studies have delineated the relative contribution to growth of the GH-IGF system – deletion of Igf1 or Igf2 results in a 40% reduction in birth weight with a reduction of 55% where Igf1r is deleted (45). Deletion of Igf1 with Igf1r or Igf2 leads to a 70% reduction in birth weight and death from respiratory distress at birth (45) whereas the Igf2r appears to negatively regulate growth as deletion of this gene results in an increase in size to 130% of wild type. IGF-I is produced in both the liver and in peripheral tissues and thus can act in an autocrine and paracrine manner. It appears that autocrine/paracrine IGF-I is more important for growth than liver derived IGF-I as a hepatic specific deletion of Igf1 in mouse resulted in no impairment of growth despite a 75% reduction in serum IGF-I concentrations (46) while a triple liver specific deletion of Igf1/Igfals/Igfbp3 resulted in a 97.5% reduction in circulating IGF-I concentrations with a 6% decrease in body length (47).
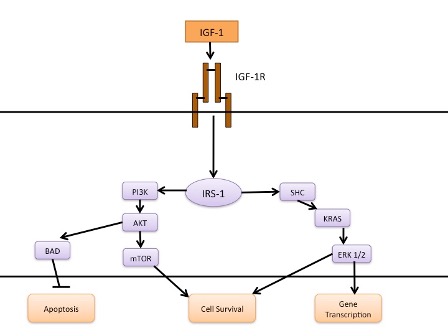
Figure 3. IGF-I Signal Transduction. Binding of IGF-I leads to phosphorylation and activation of IRS-1 which, in turn, activates the PI3K and MAPK pathways.
DIAGNOSIS OF GROWTH HORMONE DEFICIENCY IN CHILDHOOD
The diagnosis of growth hormone deficiency in childhood is multifactorial process and includes 1) auxological assessment 2) biochemical tests of the GH-IGF-I axis and 3) radiological evaluation of the hypothalamus and pituitary (normally with MR imaging). Prior to evaluation of the GH-IGF-I axis in a short child other diagnosis such as familial short stature, hypothyroidism, Turner syndrome, chronic illness such as Crohn’s disease and skeletal dysplasias should be considered and evaluated appropriately. Patients to be evaluated for growth hormone deficiency include (48,49):
- Severe short stature (defined height >3 SD below mean)
- Height more than 1.5 SD below mid parental height
- Height >2 SD below mean with height velocity over 1 year >1 SD below the mean for chronological age or a decrease of more than 0.5 SD in height over 1 year in children aged >2 years
- In the absence of short stature – a height velocity more than 2 SD below mean over 1 year or >1.5 SD below mean sustained over 2 years
- Signs indicative of an intracranial lesion or history of brain tumor, cranial irradiation, or other organic pituitary abnormality.
- Radiological evidence of a pituitary abnormality
- Signs and/or symptoms of neonatal GHD
Etiology
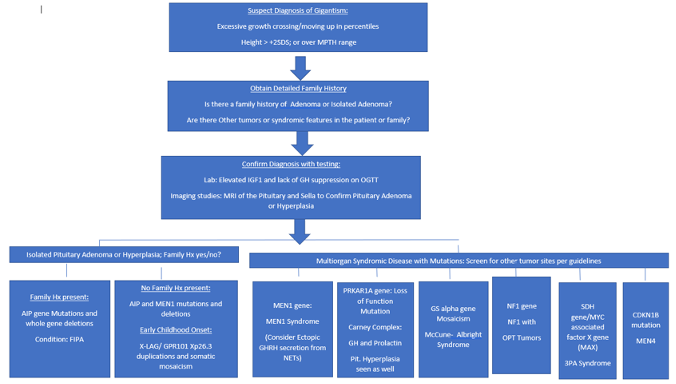
Disorders of GH can be divided into those that cause growth hormone deficiency or growth hormone excess. In childhood growth hormone deficiency is rare with an incidence of 1 in 4000 while the incidence of childhood GH excess is not known but only around 200 cases have been reported in the literature (50). Causes of GH deficiency are listed in Table 1.
|
Table 1. Causes of Growth Hormone Deficiency
|
|
Cause
|
Examples
|
|
Idiopathic
|
|
|
Genetic
|
GHRHR mutations
GH1 mutations
|
|
Structural brain malformations
|
Pituitary stalk interruption syndrome
Rathke’s cyst
Agenesis of corpus callosum
Septo-optic dysplasia
Holoprosencephaly
|
|
Midline Tumors
|
Craniopharyngioma
Optic nerve Glioma
Germinoma
Pituitary adenoma
|
|
Cranial Irradiation
|
|
|
Traumatic Brain Injury
|
Road Traffic Accident
|
|
CNS infections
|
|
|
Inflammation and Auto-immunity
|
Sarcoidosis
Langerhans Cell Histiocytosis
Hypophysitis
|
|
Psychosocial deprivation
|
|
Clinical Presentation of GH Deficiency
GH deficiency can present either in isolation (isolated GHD - IGHD) or in combination with other pituitary hormone insufficiencies (multiple pituitary hormone deficiency - MPHD). In the neonatal period MPHD typically presents with reduced penile size, episodes of hypoglycemia, and prolonged unconjugated hyperbilirubinemia. MPHD is associated with breech delivery, adverse incidents in pregnancy, and admission to the newborn intensive care unit (51). Children with severe growth hormone deficiency often appear young for their age and have midface hypoplasia and increased truncal adiposity (see Figure 4). The major clinical feature of GH deficiency is growth failure; typically, this occurs after the first year of life but may be apparent earlier in severe GHD. The earliest manifestations are a reduction in height velocity followed by a reduction in height standard deviation score (SDS) adjusted for mean parental height SDS. The child’s height SDS will ultimately fall below -2SD with the time taken to achieve this depending on the severity and duration of GHD.
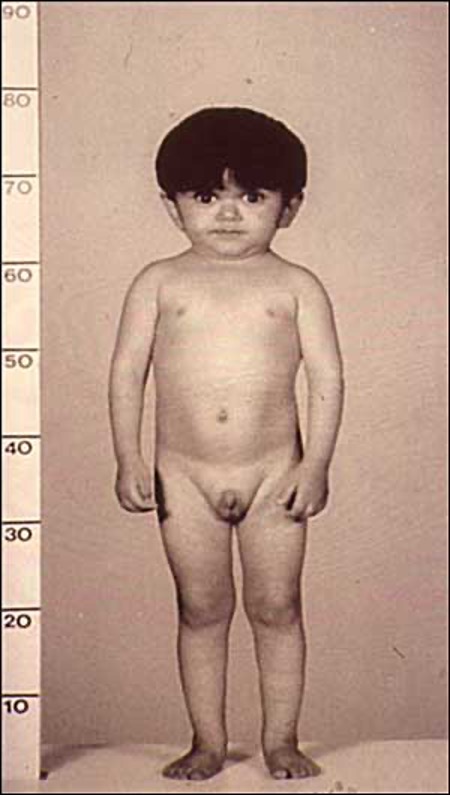
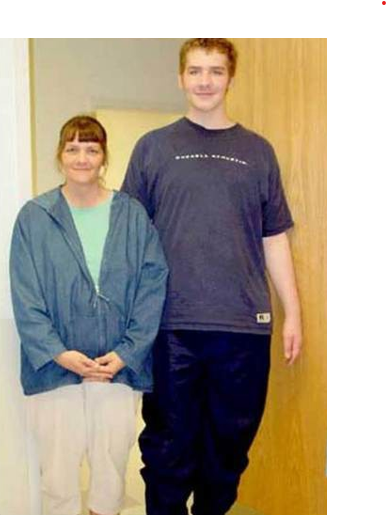
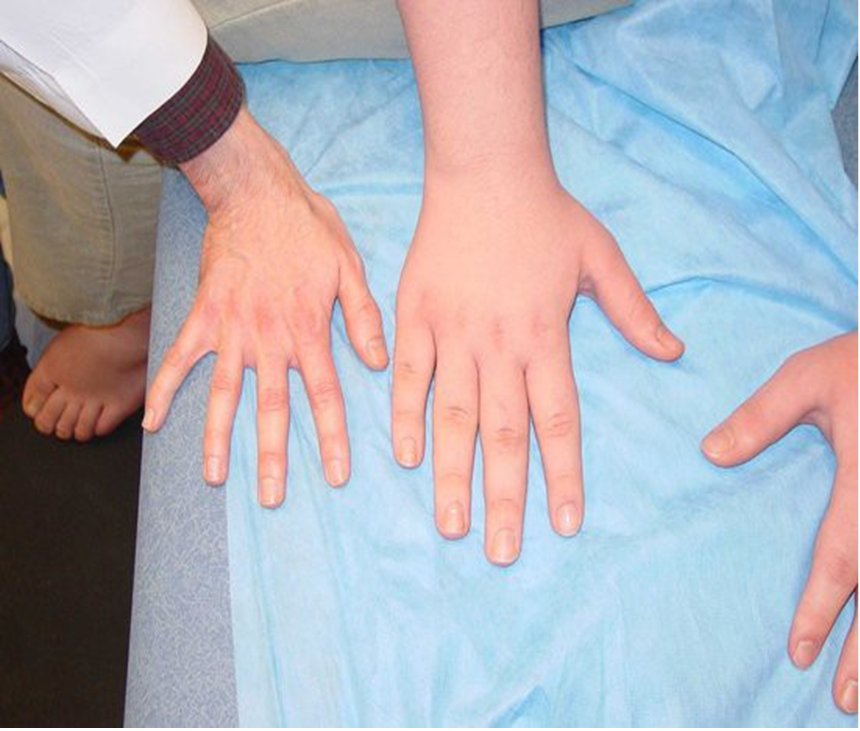
Figure 4. Child with Laron syndrome. Short stature with typical facial appearance of GH insensitivity with midface hypoplasia, this finding is common to GH deficiency as well.
Biochemical Assessment of the GH-IGF-I Axis
Multiple assays have been developed to measure GH in serum. A consensus statement of the GH-IGF-I research society in 2000 recommended that assays used should use monoclonal antibodies to measure the 22kDa variant of human GH and that the reference preparation should be the WHO standard 88/624 (a recombinant human 22kDa GH at 3 IU = 1mg) (48,52).
Growth Hormone Stimulation Tests and GH Profiles
A number of growth hormone stimulation tests have been developed and can be divided into screening tests or definitive tests. Screening tests include exercise, fasting, levodopa, and clonidine and are characterized by low toxicity, ease of administration but low specificity. Definitive tests include the insulin tolerance test, glucagon, and arginine stimulation tests. Using the auxological criteria above a peak GH concentration below 10µg/L has traditionally been used to support the diagnosis of GHD. GHD is not a dichotomous state but exists as a continuum from severe GHD to normality and there is known to be an overlap in peak GH concentrations between normal children and those with GHD. For this reason, and due to the advent of more sensitive monoclonal antibodies based on the recombinant human GH reference standard, some units will use a more stringent cut-off for the diagnosis of GHD e.g., 7µg/L. Where the diagnosis is isolated idiopathic GHD two pharmacological tests are required. Only one provocative test of GH secretion is required in children with one or more of the following criteria:
- Central nervous system pathology affecting the pituitary or hypothalamus
- A history of cranial irradiation
- An identified pathological genetic variant known to be associated with GHD
- Multiple pituitary hormone deficiency
INSULIN TOLERANCE TEST
The gold standard test is considered to be the Insulin Tolerance Test. This test relies upon an intravenous dose of insulin to induce hypoglycemia with a subsequent rise in GH expected as part of the counter regulatory response to hypoglycemia (53). Cortisol secretion also rises in response to hypoglycemia and thus this test also assesses the hypothalomo- pituitary-adrenal axis. The patient is required to fast overnight and, in the morning, a reliable intravenous line is inserted following which an insulin dose of 0.1units/kg is administered. The dose is reduced to 0.05 units/kg in children under 4 and where there is known or likely multiple pituitary hormone deficiency. This test is generally not recommended for infants and in this group the dose of insulin would be reduced further to 0.01units/kg. After administration of insulin there is careful bedside monitoring of blood glucose concentration and once the blood glucose has reached <2.6 mmol/L (47 mg/dL) the patient eats a high carbohydrate meal. Administration of 10% glucose at 2ml/kg may be required in order to restore adequate blood glucose concentrations. This should be prepared in advance of the start of the test along with an appropriate dose of IV hydrocortisone (this should be given after hypoglycemia where there is known adrenal insufficiency or where hypoglycemia is more severe or prolonged than expected). 50% dextrose is recommended by some for the correction of hypoglycemia during the test but administration of such hyperosmolar solutions has been associated with adverse outcome (54) including cerebral edema. Due to the risks associated with this test it should only ever be performed in a center with appropriate experience.
GLUCAGON TEST
The glucagon test is one of a number of safer alternative GH provocation tests. Intramuscular administration of glucagon leads to an increase in GH due to a rise in insulin levels compensating for the increase in serum glucose (55). Maximum GH peak occurs 2-3 hours after injection of glucagon. Although less common than with the insulin tolerance test hypoglycemia can occur with the glucagon stimulation test where there is an excessive insulin response. There should therefore be blood glucose monitoring throughout the test and a meal consumed at the end of the test. Nausea and vomiting are other common side effects.
ARGININE STIMULATION TEST
Arginine administration stimulates the release of GH by inhibiting somatostatin release. Following an overnight fast arginine is administered intravenously at 0.5g/kg (maximum dose 30g) over 30 minutes. Unlike glucagon or insulin, arginine does not directly cause hypoglycemia and thus the arginine stimulation test may be safer, particularly for those patients with predisposition to hypoglycemia. Examples of patients where an arginine test would be suitable where the insulin or glucagon-based tests would not be suitable include patients with diabetes and a history of seizures or children with disorders of cerebral glucose uptake (GLUT2 deficiency) where the patient should be continuously ketotic. Arginine can be combined with L-dopa or GHRH. For combined tests, particularly the arginine-GHRH test it is important to have a test specific cut off for the diagnosis of GHD as with a powerful stimulus of GH secretion a higher cut off is required (a normal peak GH response for arginine-GHRH has been defined at 19-120 µg/L(56)). GHRH can be used on its own as a provocative agent but is greatly affected by variations in somatostatin tone leading to a highly variable response. In addition, false negative tests may occur in children with hypothalamic damage.
Oral agents used in GH stimulation tests include clonidine and L-Dopa. Both clonidine and L-Dopa act by increasing adrenergic tone to increase GHRH and decrease somatostatin levels. A fast of 6 hours is required prior to the test. Since clonidine is a drug used to lower blood pressure hypotension is a potential side effect. Drowsiness is also a frequent occurrence during this test.
INTERPRETATION
Significant problems exist with GH stimulation tests – peak GH varies according to the stimulus used (57), false positive results in normal pre-pubertal children are frequent (56), the tests have poor reproducibility and there is also variability in GH level with GH assay used (58). Peak GH is also reduced in obesity and for adults BMI specific cut-offs for the diagnosis of GHD have been developed (59).
Low GH levels to provocation tests frequently occur in the immediate peripubertal period. Given the known action of the sex steroids to augment endogenous GH secretion this has led some pediatric endocrinologists to prime children of peripubertal age but without clinical signs of puberty undergoing GH stimulation testing with exogenous sex steroids (diethylstilbestrol, ethinylestradiol and testosterone can be used). Around 50% of pediatric endocrinologists routinely use priming for GH stimulation tests(60). Some endocrinologists will prime boys >9 years and girls >8 years others will prime only those with a delayed puberty >13-14 years in boys and > 11 or 12 years in girls. In one study by Marin et al(61) where 61% of healthy prepubertal children failed to demonstrate a peak GH >7µg/L to three GH provocative tests (exercise, insulin and arginine) but after administration of estrogen 95% of these children demonstrated a peak GH >7 µg/L. Multiple other studies have confirmed this result in healthy peripubertal children with growth impairment (62). Thus, the argument in favor of priming is that it prevents false positive diagnoses of GHD in this group. The concerns about priming are that it only briefly augments the GH response which then returns to suboptimal levels which may be insufficient for normal growth. Thus priming may result in failure to treat children with transient peripubertal GH deficiency who would have benefitted from treatment (62).
24 hour or overnight 12-hour GH profiles with measurement of serum GH every 20 minutes have been proposed as an alternative assessment of GH secretion. The obvious disadvantages are the large number of samples required and costs, particularly of the overnight hospital admission. While a 24 hour GH profile has a high reproducibility there is also a large degree of inter individual variability limiting the usefulness of the procedure as a diagnostic test (63).
A diagnosis of GH neurosecretory dysfunction can be made where the patient presents with signs/symptoms of GHD with low IGF-I concentration, a normal peak GH level to pharmacological stimulation but absence of spontaneous GH peaks on 24 hour serum GH profile (64). This diagnosis has not been identified in adults and given the interindividual variability in 24-hour GH profiles caution should be made before coming to GH neurosecretory dysfunction as a diagnosis, particularly where there is no history of cranial irradiation.
Measurement of IGF-I and/or IGFBP-3
IGF-I and IGFBP-3 are, unlike GH, present at relatively constant concentrations in serum throughout the day and can therefore be measured by a simple blood test without the need for pharmacological stimulation. IGF-I is suppressed in states of poor nutrition and both IGF-I and IGFBP-3 concentrations vary with age and pubertal stage, thus normative ranges taking into account age, Tanner stage, and BMI have been recommended (52). The majority of IGF-I exists bound in the ternary IGF-I/IGFBP-3/ALS complex (thus free IGF-I is very low and difficult to measure) and assays therefore require a step to remove the IGF binding proteins before measurement of total IGF-I. Incomplete removal of IGF-I can potentially lead to false low IGF-I concentrations. Both IGF-I and IGFBP-3 have a low sensitivity (~50%) with a high specificity (97%) (65,66) and thus are of limited value in isolation. They do, however, form a vital component of the assessment of a child for GHD combined with auxological, other biochemical and radiological data.
Neuroimaging
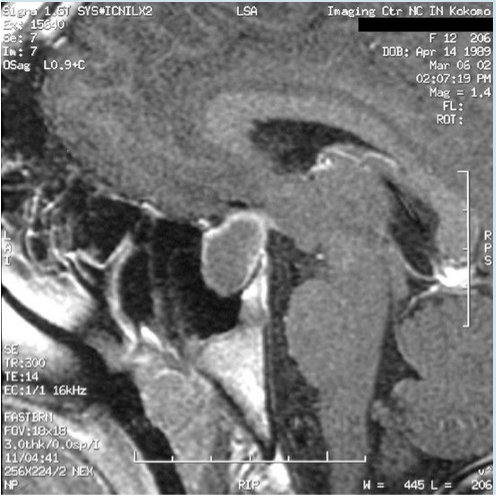
Identifying abnormalities of the hypothalamo-pituitary axis provides powerful evidence for the diagnosis of GH deficiency in the short child. The most common abnormality identified in congenital GHD is the so-called pituitary stalk interruption syndrome consisting of a variable combination of anterior pituitary hypoplasia, ectopic posterior pituitary, and thinning or interruption of the pituitary stalk (67). Loss of the vascular pituitary stalk increases the risk of MPHD 27-fold but required gadolinium-DTPA administration to reliably distinguish presence/absence of vascular stalk (68). Other potential findings in congenital GHD include
- Septo-optic dysplasia – combination of absence of septum pellucidium, optic nerve hypoplasia and hypopituitarism. May be associated with an ectopic posterior pituitary and anterior pituitary hypoplasia.
- Abnormalities of the corpus callosum – agenesis, corpus callosum cysts
- Holoprosencephaly
- Eye abnormalities – microphthalmia or anophthalmia (GLI2 or OTX2 mutations)
- Absent olfactory bulbs (FGFR1, FRF8 and PROKR2 mutations)
- Pituitary hyperplasia (seen in patients with PROP1 mutations)
- Hypothalamic hamartoma (Pallister-Hall syndrome)
- Empty sella
- Absence of the internal carotid artery
- Arnold-Chiari malformations
- Arachnoid cysts
- Syringomyelia
In acquired GHD tumors affecting the hypothalamo-pituitary axis will frequently be identified – craniopharyngiomas, adenomas, and germinomas. Thickening of the pituitary stalk may be identified in Langerhans cell histiocytosis.
As well as a role in the diagnosis of GH deficiency MR imaging can also help predict which patients will require re-testing of growth hormone status at the end of growth. Young adults with MRI abnormalities have an increased risk of persisting GHD into adulthood (69).
GH Therapy
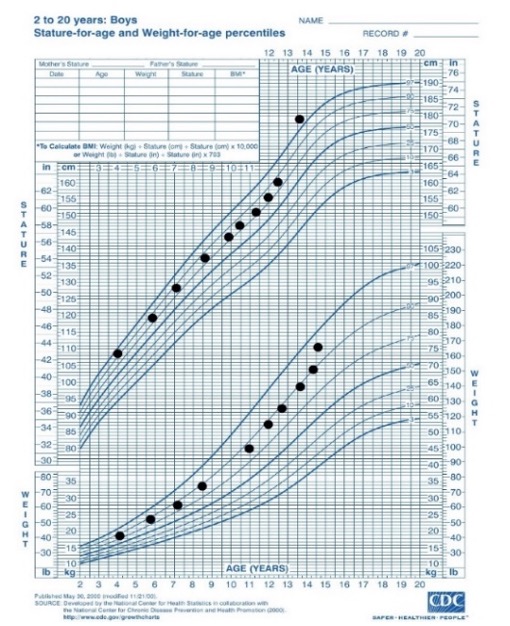
All children diagnosed with GH deficiency should be treated with recombinant human growth hormone as soon as possible after the diagnosis is made. The aim of treatment is to normalize height – both to within the normal range for the population and to achieve a height within the child’s target range. GH is administered as a once daily subcutaneous injection in the evening. Starting dose is usually in the range of 25-35µg/kg/day with maximum dose being 50µg/kg/day. In children with more severe GHD (evidence by a lower peak GH level, more severe presentation, MRI abnormality) the response to GH is better and often height can be normalized with lower doses of GH e.g., 17-35 µg/kg/day (70). Prediction models (discussed below) are available and in GHD have been shown to reduce variability in response but do not improve height gain (71). Children receiving GH therapy should be seen every 3-6 months and the GH dose titrated to height velocity and height gain. Monitoring of IGF-I concentrations is recommended to avoid prolonged periods of supraphysiological IGF-I levels. In general, IGF-I should be measured at least annually but can be measured more frequently particularly where there has been a recent increase in dose. A reduction in dose would normally be considered were two consecutive IGF-I levels were above +2 SD. As a guide to dose adjustment a 20% alteration in dose leads, on average, to a 1 SD change in IGF-I concentration (72). Treatment is continued until the child is post-pubertal and growth is either completely ceased or is <2cm per year. A growth chart from a child with congenital GHD treated with recombinant human GH therapy is shown in Figure 5.
Currently there is no single accepted definition of poor response to GH treatment with suggestions including change in height SDS <0.3 or 0.5 during the first year of treatment, change in height velocity <+3cm/year during 1st year of treatment, change in height velocity <+1SD or a height velocity <-1 SD during the first year of therapy. Depending on the definition used 20-35% of patients display a poor response (73). It is important to discuss the possibility of a poor response with the family prior to staring therapy.
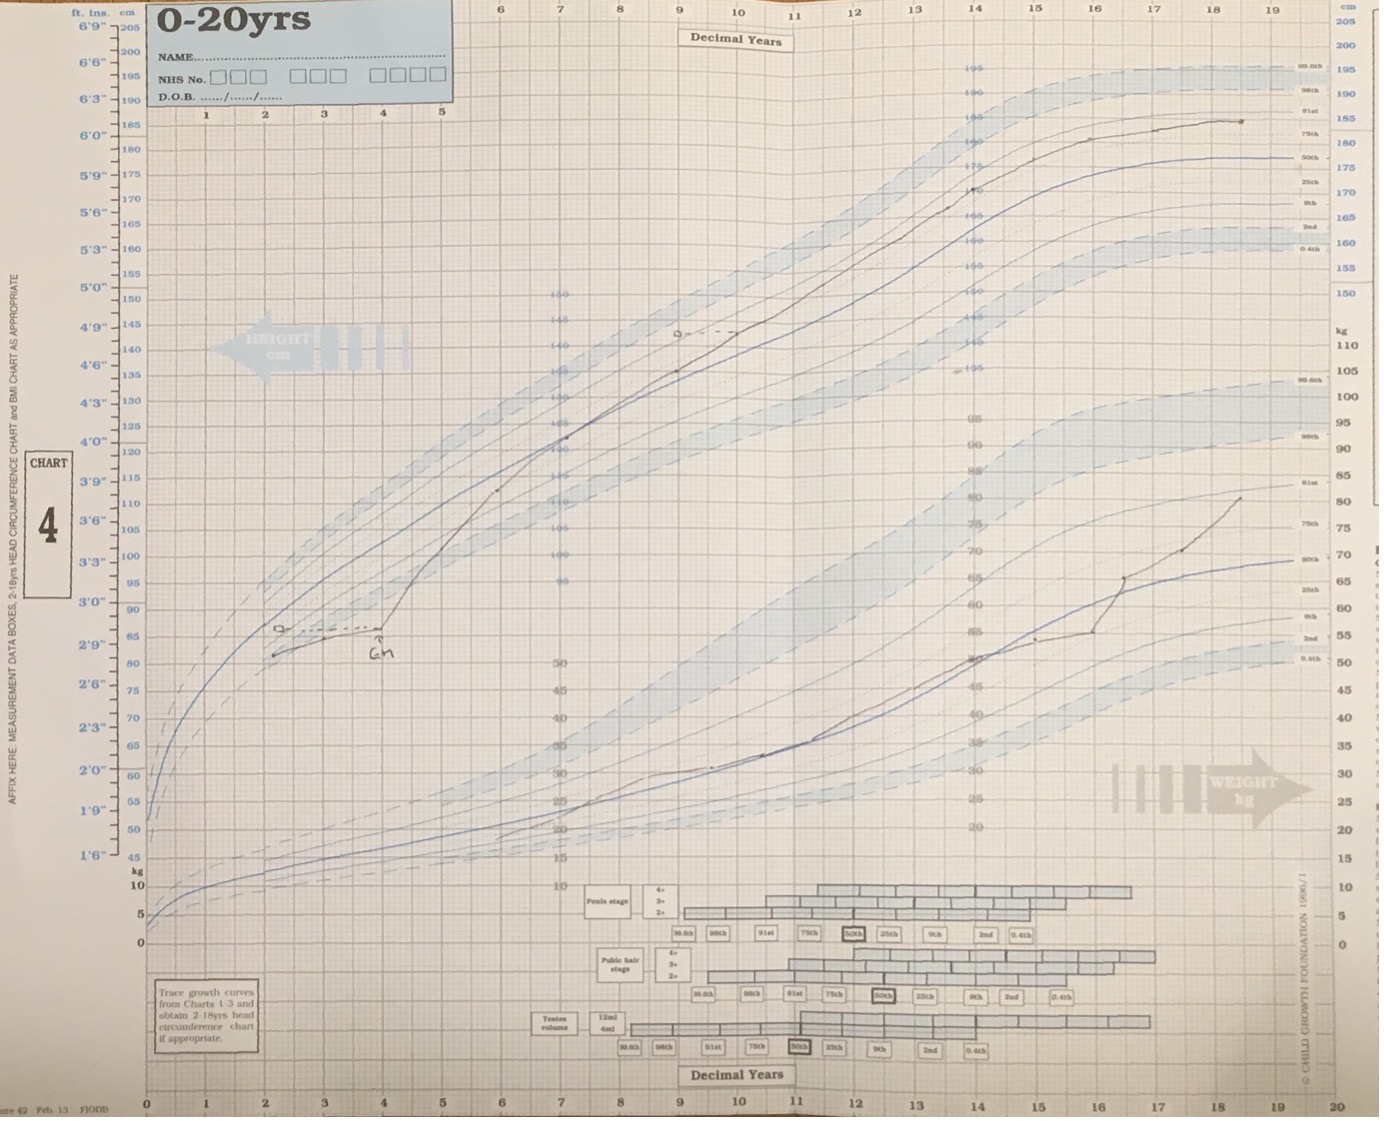
Figure 5. Growth Chart from child with GH deficiency. GH therapy is started at age 4 with height SDS -3.7 SD. There is a sustained improvement in height velocity leading to a final height of +1.5 SD.
Multiple long-acting preparations of growth hormone are at various stages of development (74). A phase three trial in adults with GHD have been completed and has demonstrated similar efficacy with a once weekly injection of a long-acting GH compared to conventional daily GH (75). Trials in children are currently ongoing.
Prediction of Response to GH Therapy and the d3-Growth Hormone Receptor Polymorphism
Initial work predicting the response to GH therapy was based on auxological and biochemical data, particularly from the Kabi International Growth Study (KIGS), a large surveillance study of over 62,000 patients treated with GH in childhood. Prediction models developed included models for idiopathic isolated GH deficiency (76) and early onset isolated GH deficiency (77). For the idiopathic isolated GH deficiency prediction model the model explained 61% of the variability on GH response. Factors included in the prediction model were peak GH during stimulation test, age at start of GH therapy, height SDS minus mean parental height SDS, growth hormone dose and weight SDS. Other prediction models derived from alternative datasets have also been produced for GHD (78,79).
Around 50% of the European population are homo- or heterozygous for a polymorphism of the GHR that leads to deletion of exon 3 and 22 amino acid residues near the N-terminal. In 2004 it was reported that GH signaling via the GHR with the d3 was increased and that children treated with GH under the SGA license or with idiopathic short stature showed an increased first year growth velocity where they were homo- or heterozygous for the d3 polymorphism (80). Since this original report there have been many studies assessing the effect on the d3 polymorphism on response to GH therapy in GH deficiency, Turner syndrome, SGA children and in children with idiopathic short stature. A meta-analysis of these studies in 2011 indicated that, compared to children homozygous for the full-length allele, children homozygous for the d3 polymorphism have an increase in 1st year height velocity SDS of 0.14 SD and children heterozygous for the d3 polymorphism has an increase of 0.09 SD (81). Thus, it appears that the d3 polymorphism has a modest effect mediating the response to GH therapy.
The PREDICT study was a large international observational study which assessed the contribution of single nucleotide polymorphisms in over 100 candidate genes to GH response in a cohort of children with GH deficiency or Turner syndrome (82,83). GH response was assessed by change in IGF-I concentrations over 1 month and by height velocity change over the first year of treatment. Carriage of 10 polymorphisms within 7 different genes, related in particular to cell signaling, were identified to be associated with change in IGF-I over the first month of GH treatment and height velocity over the first year of treatment. In addition to assessing association between genotype and response to GH therapy the PREDICT study also assessed the use of basal gene expression in peripheral blood mononuclear cells to predict GH response. There were 1188 genes where the expression level was associated with low response and 865 genes where expression level was associated with a high response to GH therapy (83). Network analysis of the human interactome associated with these genes indicated that glucocorticoid, estrogen, and insulin receptor signaling, and protein ubiquitination pathways were most represented by the genes where association was linked to high or low response to GH therapy.
A recent genome wide association study examining GH responsiveness did not identify any significant SNPs in their primary analysis (the primary analysis utilized all diagnostic groups for GH treatment together) (84). They did identify 4 SNPs in a secondary analysis stratifying by diagnosis and limiting to European ancestry – the closest associate genes are UBE4B, LAPTM4B, COL1A1/NT5DC1 and CLEC7A/OLR1(84).
INHERITED DISORDERS OF THE GH-IGF-I AXIS
Genetic Disorders Causing Isolated Growth Hormone Deficiency
Initial reports suggested that only around 12% of cases of isolated growth hormone deficiency were associated with abnormalities of the hypothalamus or pituitary on MR imaging (85). More recent studies have indicated that up to 26% of cases of isolated GHD are associated with MR abnormalities (86), particularly anterior pituitary hypoplasia and ectopic posterior pituitary. Within the remaining cohort of patients with IGHD an increasing number of genetic causes have been identified.
IGHD TYPE 1
IGHD type 1a is inherited in an autosomal recessive manner and is due to homozygous deletions and nonsense mutations in the GH1 gene leading to a complete absence of the GH protein from serum. The clinical presentation is with severe growth hormone deficiency and growth failure from 6 months of life with height SDS >4.5 SD below mean. Typically patients respond well to initial therapy with GH but then develop anti-GH antibodies leading to a loss of efficacy (87). Treatment with IGF-I is an option for such patients.
IGHD type 1b is also autosomal recessive and caused by mutations in the GH1 gene – either mis-sense, splice site or nonsense or by mutations within the GHRHR (the gene encoding the GHRH receptor). The clinical phenotype in IGHD type 1b is milder than that of IGHD 1a with the presence of low but detectable levels of GH to stimulation tests. These patients show a good response to treatment with GH without the development of anti-GH antibodies.
The GHRHR is a 423 amino acid G-coupled protein receptor. It contains seven transmembrane domains encoded for by a 13-exon gene on chromosome 7p15. While human mutations leading to isolated GH deficiency have been found in the GHRHR gene, to date no such mutations have been identified in the gene encoding the ligand, GHRH. The initial link between a GHRHR mutation and impaired growth was in the little mouse, where Lin et al identified an amino acid substitution in codon 60 of the mouse GHRHR (88). The substitution of glycine for aspartic acid (D60G) prevented the binding of GHRH to the mutant receptor. Subsequent to the identification of the mutation in mouse a nonsense mutation (p.E72X) was identified in two patients in a consanguineous family of Indian ethnic origin (89). Since this initial report multiple families have been reported and splice site mutations, missense mutations, nonsense mutations, microdeletions and one mutation in the promoter (90). The clinical phenotype of an individual with a GHRHR mutation is that of autosomal recessive inheritance of IGHD, anterior pituitary hypoplasia (defined as pituitary height more than 2 SD below mean), GH concentrations are either undetectable or very low in response to provocation tests and IGF-I/IGFBP-3 levels are low. In contrast to patients with GH1 mutations midface hypoplasia, neonatal hypoglycemia and microphallus are less common. Intelligence is normal and affected individuals are fertile.
Expression of GHRHR is upregulated by the pituitary transcription factor POU1F1 and this results in somatotroph hypertrophy. Because of this effect on somatotrophs anterior pituitary hypoplasia is commonly seen on MR imaging but there have been reports of GHRHR mutations with normal pituitary morphology (91).
IGHD TYPE 2
IGHD Type 2 is an autosomal dominant disorder caused by mutations in the GH1 gene. The severity of GH deficiency is highly variable. While the name of the condition suggests only GH is affected, in practice loss of other pituitary hormones has been reported and patient must be followed up to identify these additional hormone deficiencies. Loss of TSH, ACTH, prolactin and gonadotrophins have all been reported (92).
IGHD type 2 is most commonly caused by mutations that affect splicing of GH1, particularly splicing of exon 3 (93). The most frequent mutations are within the first six bp of the exon 3 donor splice site (93) but mutations in the exon 3 splice enhancers and intron splice enhancers have also been reported (90). The exon 3 splice mutations lead to the exclusion of exon 3 and the production of a 17.5kDa isoform of GH lacking amino acids 31-71, responsible for connecting helix 1 and helix 2 of the mature GH molecule. This abnormal 17.5 kDa variant GH is retained within the endoplasmic reticulum, disrupts the Golgi apparatus and reduces the stability of the 22kDa GH isoform (94). In addition to GH trafficking of other hormones including ACTH is disrupted. A mouse model overexpressing the 17.5kDa isoform demonstrated anterior pituitary hypoplasia with invasion by activated macrophages. The loss of additional pituitary hormones is likely to result from the disrupted hormone trafficking as well as the pituitary inflammation and destruction. Children with IGHD type II may display anterior pituitary hypoplasia on MR imaging. Currently there is no specific treatment in man to ameliorate the effects of the 17.5kDa isoform. A small interfering RNA based therapy has been successful in the mouse model of IGHD type 2 (95) but the delivery system used involved inserting the short hairpin RNA as a transgene. Successful implementation of such a therapy in humans will require an alternative mode of delivery capable of crossing the blood-brain barrier. As well as the classical exon 3 splice site mutations IGHD type 2 is also caused by missense mutations. These have been reported to lead to impaired GH release (96) or to alter folding of GH (97).
IGHD TYPE 3
IGHD Type 3 is of x-linked recessive inheritance and the males described were both immunoglobulin and GH deficient. A single patient has been reported with a mutation in the BTK gene (resulting in exon skipping) with x-linked agammaglobulinemia and GH deficiency (98).
One family has been reported with isolated GHD caused by mutations in RNPC3 (99). The three affected sisters had compound heterozygous mutations in RNPC3 (p.P474T and p.R502X) and presented with classical severe isolated GHD with anterior pituitary hypoplasia on MR imaging. RNPC3 encodes a component of the minor spliceosome responsible for splicing of a small subset (<0.5%) of introns which are present in ~3% of human genes. Given that splicing is an essential basic process present in all tissues it is interesting that the phenotype seen is pituitary specific. The patients displayed relatively minor perturbations in splicing which is hypothesized to be tolerated in most tissues, but not in the developing pituitary. Response to GH treatment is reported to be excellent (100).
Genetic Disorders Leading to Abnormal Pituitary Development and Multiple Pituitary Hormone Deficiency
Mutations in an increasing number of genes lead to loss of multiple pituitary hormones including growth hormone (summarized in Table 2). A brief summary of each is given below – for an extensive review of pituitary development and it’s genetic control see Bancalari et al (101).
HESX1
The paired homeobox domain protein HESX1 is one of the earliest specific markers of the pituitary primordium and it acts as a transcriptional repressor. Mutations in HESX1 are associated with septo-optic dysplasia (102) and MPHD (103,104) which can be inherited in an autosomal recessive or autosomal dominant pattern. In addition to the MRI appearances associated with septo-optic dysplasia patients with HESX1 mutations can have an ectopic posterior pituitary (104).
OTX2
The OTX2 homeobox gene is a homologue of the Drosophila orthodenticle protein. It is expressed early in gastrulation and is involved in development of the central nervous system and eye. In humans OTX2 mutations have been identified in patients with anophthalmia or microphthalmia with isolated GHD or MPHD (105). On MR imaging an ectopic posterior pituitary and small anterior pituitary have been associated with OTX2 mutations.
SOX3
SOX3 is a single exon gene located on the X chromosome, is expressed widely throughout the ventral diencephalon and is involved in the development of Rathke’s pouch (106). In humans SOX3 duplications (107) or polyalanine expansion (108,109) have been associated with X-linked hypopituitarism with or without mental retardation. The pituitary phenotype is variable from isolated GHD to MPHD. MRI findings may include anterior pituitary hypoplasia, ectopic posterior pituitary, and corpus callosum abnormalities.
PITX2
PITX2 is a homeodomain transcription factor expressed in the rostral brain and oral ectoderm during development and throughout the anterior pituitary in adult life. Axenfeld-Riegler syndrome is an autosomal dominant disorder characterized by ocular, dental and craniofacial abnormalities in addition to pituitary abnormalities. Mutations in PITX2 have been found in patients with Axenfeld-Riegler syndrome and GH deficiency (110).
LHX3 and LHX4
LHX3 and LHX4 encode LIM domain proteins expressed in Rathke’s pouch involved in transcriptional regulation. Homozygous loss of function mutations in LHX3 have been associated with hypopituitarism, sensorineural deafness and cervical abnormalities (rigid cervical spine and cervical spina bifida occulta) (111,112). The MRI appearance may be of a small or enlarged pituitary or a hypointense lesion compatible with a microadenoma. Mutations in LHX4 lead to a range of pituitary dysfunction from GHD to MPHD (113) with a pituitary phenotype including anterior pituitary hypoplasia, ectopic posterior pituitary and in one family there was pointed cerebellar tonsils suggestive of an Arnold Chiari Malformation (114).
GLI2
GLI2 is a mediator of Sonic Hedgehog signal transduction and is expressed in the oral ectoderm and ventral diencephalon. Heterozygous mutations in GLI2 lead to a variable combination of holoprosencephaly and hypopituitarism (115,116). Other clinical findings may include a cleft lip/palate, postaxial polydactyly and anophthalmia.
FGFR1, FGF8 and PROKR2
FGFR1, FGF8 and PROKR2 were previously known to be involved in the pathogenesis of Kallmann syndrome (hypogonadotropic hypogonadism with anosmia). Screening of a cohort of 103 patients with hypopituitarism identified mutations in these Kallmann syndrome genes in eight patients (FGFR1 n=3, FGF8 n=1, PROKR2 n=4) (117). An EPP was identified in one patient with an FGFR1 mutation and a hypoplastic anterior pituitary in one patient with a PROKR2 mutation.
PROP1
Prophet of Pit-1 (PROP1) is a homeodomain transcription factor with expression limited to the anterior pituitary. It acts as a transcriptional repressor downregulating HESX1 and as an activator of POU1F1. PROP1 mutations are associated with GH, prolactin, TSH and LH/FSH deficiency with rare cases of ACTH deficiency. PROP1 mutations are the commonest genetic cause of hereditary MPHD accounting for ~50% of familial cases (117). MRI findings include both small and large anterior pituitary glands and even extension of the pituitary to form a large suprasellar mass which waxes and wanes before involuting (118). Gonadotrophin deficiency in patients with PROP1 mutations is highly variable and can present with micropenis and cryptorchidism to delayed pubertal onset potentially indicating a role of PROP1 in maintenance of gonadotrophin function.
POU1F1
The first genetic cause of multiple pituitary hormone deficiency, identified in 1992, was mutations in the POU1F1transcription factor (119). It is essential for the development of somatotrophs, lactotrophs, and thyrotrophs, consequently mutations in POU1F1 lead to deficiency of GH, TSH and prolactin. Anterior pituitary size is most often small but can be normal with normal stalk and normally sited posterior pituitary. The hormone deficiencies can present at any time from birth to adolescence.
IGSF1
Mutations in IGSF1 (immunoglobulin superfamily member 1) were identified initially as a cause of central hypothyroidism and macro-orchidism (120). IGSF1 is a membrane glycoprotein expressed in Rathke’s pouch. The identified mutations lead to aberrant protein trafficking and protein mislocalisation. In a small number of subjects mild or transient GHD has been identified (121,122). It is clear that the immunoglobulin superfamily of proteins may have a wider role in controlling pituitary hormone secretion with mutations in immunoglobulin superfamily member 10 associated with constitutional delay in growth and puberty (123).
ARNT2
A single family with a homozygous frameshift loss of function mutation in ARNT2 has been described. The affected individuals demonstrated multiple pituitary hormone deficiency including diabetes insipidus along with post-natal microcephaly, frontal and temporal lobe hypoplasia, seizures, developmental delay, visual impairment and congenital abnormalities of the urinary tract (124). ARNT2 is a HLH transcription factor which is known to dimerize with SIM1, a known regulator of neuronal differentiation.
TCF7L1
Transcription factor 7-like 1 is a regulator of WNT/β-catenin signaling and is expressed in the developing forebrain and pituitary. Two patients with heterozygous missense variants have been reported – one diagnosed with GHD and one with low IGF-I concentrations (124). MRI findings are listed in Table 2. In both families there were unaffected family members also carrying the variant. Given functional studies confirmed the deleterious nature of the variant this is likely to represent autosomal dominant inheritance with variable penetrance.
RAX
RAX encodes a transcription factor involved in eye and forebrain development. A child with a homozygous frameshift truncating mutation in RAX has been identified with a phenotype including anophthalmia, bilateral cleft lip and palate with congenital hypopituitarism (125).
LAMB2
Laminin b2 is a basement membrane protein with autosomal recessive mutations associated with congenital nephrotic syndrome, ocular abnormalities and developmental delay. One patient has been reported with isolated growth hormone deficiency, optic nerve hypoplasia, and a small anterior pituitary in association with focal segmental glomerulosclerosis with a compound heterozygous missense mutation in LAMB2 (126).
TBC1D32
TBC1 Domain Family member 32 is thought to be a ciliary protein and a cause of oral facial digital syndrome type IX (127). Two families with biallelic mutations in TBC1D32 and hypopituitarism have been reported (128). For the first family there were two affected siblings and they had panhypopituitarism with an absent anterior pituitary, ectopic posterior pituitary and retinal dystrophy while in a third family the affected proband had anterior pituitary hypoplasia, growth hormone deficiency and developmental delay (128). Facial dysmorphism was present with prominent forehead, low set posteriorly rotated ears, hypertelorism and a flat nasal bridge. Autosomal recessive mutations in another ciliopathy related gene IFT172 have been reported to cause GHD with an ectopic posterior pituitary (129).
MAGEL2 and L1CAM
MAGEL2 and L1CAM mutations have been identified in patients with a combination of hypopituitarism and arthrogryposis (130). MAGEL2 mutations cause Schaaf-Yang syndrome which is similar to Prader-Willi Syndrome with hypotonic, obesity, developmental delay, contractures and dysmorphism. GHD, diabetes insipidus and ACTH deficiency have been reported in 4 patients. In one patient with L1 syndrome due to a L1CAM mutation arthrogryposis was present with GHD.
EIF2S3
EIF2S3 encodes a protein involved in the initiation of protein synthesis with mutations associated with developmental delay and microcephaly. In three patients’ mutations in EIF2S3 have been associated with GHD and central hypothyroidism (131). Inheritance is X-linked.
FOXA2
FOXA2 is a transcription factor involved in pituitary and pancreatic B-cell development and de novo heterozygous mutations cause a phenotype of congenital hypopituitarism with congenital hyperinsulinism (132).
OTHER MUTATIONS
In addition to the above mutations in CDON (133) (nonsense heterozygous), GPR161(134) (homozygous missense) and ROBO1(135) (heterozygous frameshift, nonsense and missense) have been associated with pituitary stalk interruption syndrome.
|
Table 2. Genetic Defects of Pituitary Development and their Phenotype
|
|
Gene
|
Pituitary Deficiencies
|
MRI phenotype
|
Inheritance
|
Other phenotypic features
|
|
ARNT2
|
GH, TSH, ACTH, LH, FSH, ADH
|
Absent PP, ectopic PP, thin stalk, thin corpus callosum, delayed myelination
|
AR
|
Hip dysplasia, hydronephrosis, vesico-ureteric reflux, neuropathic bladder, microcephaly, prominent forehead, deep set eyes, retrognathia
|
|
CDON
|
GH, TSH, ACTH
|
Small anterior pituitary, ectopic posterior pituitary, absent stalk
|
AD
|
|
|
EIF2S3
|
GH, TSH
|
Small anterior pituitary, white matter loss,
|
X-linked recessive
|
Developmental delay and microcephaly, glucose dysregulation (hyperinsulinemia hypoglycemia and post-prandial hyperglycemia)
|
|
GPR161
|
GH, TSH, ADH
|
Small anterior pituitary, ectopic posterior pituitary
|
AR
|
Congenital ptosis, alopecia, syndactyly, nail hypoplasia
|
|
FGFR1
|
GH, TSH, LH, FSH and ACTH
|
Normal or small anterior pituitary, corpus callosum agenesis
|
AD
|
ASD and VSD, brachydactyly, brachycephaly, preauricular skin tags, ocular abnormalities, seizures
|
|
FGF8
|
GH, TSH, ACTH, ADH
|
Absent corpus callosum, optic nerve hypoplasia
|
AD or AR
|
Holoprosencephaly, Moebius syndrome, craniofacial defects, high arched palate, maxillary hypoplasia, microcephaly, spastic diplegia
|
|
FOXA2
|
GH, TSH, ACTH
|
Small shallow sella turcica, anterior pituitary hypoplasia, absent stalk
|
AR
|
Congenital hyperinsulinism
|
|
GLI2
|
GH, TSH and ACTH with variable gonadotrophin deficiency
|
Anterior pituitary hypoplasia
|
AD
|
Holoprosencephaly, cleft lip and palate, anophthalmia, postaxial polydactyly, imperforate anus, laryngeal cleft, renal agenesis
|
|
GLI3
|
GH, TSH, LH, FSH, ACTH
|
Anterior pituitary hypoplasia
|
AD
|
Pallister-Hall syndrome Postaxial polydactyly, hamartoblastoma
|
|
HESX1
|
Isolated GHD through to panhypopituitarism with TSH, LH, FSH, ACTH, prolactin and ADH deficiency
|
Optic nerve hypoplasia, absence of the septum pellucidum, ectopic posterior pituitary, anterior pituitary hypoplasia
|
AR and AD
|
Developmental delay
|
|
IFT172
|
GHD
|
Ectopic posterior pituitary, anterior pituitary hypoplasia
|
AR
|
Retinopathy, metaphyseal dysplasia, and hypertension with renal failure
|
|
IGSF1
|
GH (transient/partial), TSH, prolactin
|
Normal in the majority of cases. Frontoparietal hygroma, hypoplasia of the corpus callosum, and small stalk lesion reported.
|
X-linked recessive
|
Macro-orchidism, delay in puberty
|
|
L1CAM
|
GHD
|
Generalized white matter loss and thin corpus callosum
|
X-linked recessive
|
Arthrogryposis, hydrocephalus, VSD, developmental delay, scoliosis, astigmatism
|
|
LAMB2
|
GHD
|
Small anterior pituitary, optic nerve hypoplasia
|
AR
|
Congenital nephrotic syndrome, focal segmental glomerulosclerosis, developmental delay
|
|
LHX3
|
GH, TSH, LH, FSH, prolactin
|
Small, normal or enlarged anterior pituitary
|
AR
|
Short neck with limited rotation
|
|
LHX4
|
GH, TSH and ACTH deficiency
|
Small anterior pituitary, ectopic posterior pituitary, cerebellar abnormalities, corpus callosum hypoplasia
|
AD
|
|
|
MAGEL2
|
GHD, ACTH, ADH
|
Small posterior pituitary, thin corpus callosum and optic nerve hypoplasia
|
Heterozygous mutations on paternal allele
|
hypotonia, obesity, developmental delay, contractures and dysmorphism
|
|
OTX2
|
GH, TSH, LH, FSH and ACTH
|
Normal or small AP, pituitary stalk agenesis, ectopic posterior pituitary, Chiari I malformation
|
AR or AD
|
Microcephaly, bilateral anophthalmia, developmental delay, cleft palate
|
|
POU1F1
|
GH, TSH, prolactin
|
Small or normally sized anterior pituitary
|
AR and AD
|
|
|
PROKR2
|
GH, TSH, ACTH
|
Hypoplastic corpus callosum, normal or small anterior pituitary
|
AD
|
Club foot, syrinx spinal cord, microcephaly, epilepsy
|
|
PROP1
|
GH, TSH, LH, FSH, prolactin, evolving ACTH deficiency
|
Small, normal or enlarged anterior pituitary – may evolve over time
|
AR
|
|
|
RAX
|
GH, TSH, LH, FSH, ACTH, ADH
|
Absent sella turcica and pituitary
|
AR
|
Anophthalmia, bilateral cleft lip and palate
|
|
ROBO1
|
GH, TSH
|
Small or absent anterior pituitary, ectopic or absent posterior pituitary, interrupted or absent stalk
|
AD
|
Strabismus, ptosis
|
|
SOX3
|
GH, TSH, LH, FSH, ACTH. Most commonly isolated GHD
|
Anterior pituitary and infundibular hypoplasia, ectopic posterior pituitary, corpus callosum abnormalities including cysts
|
X-linked recessive
|
Learning difficulties
|
|
SOX2
|
LH, FSH variable GH deficiency
|
Anterior pituitary hypoplasia, optic nerve hypoplasia, septo-optic dysplasia, hypothalamic hamartoma
|
AR
|
Microphthalmia, anophthalmia, micropenis, sensorineural deafness, gastro-intestinal tract defects.
|
|
TBC1D32
|
Isolated GHD to panhypopituitarism
|
Absent or hypoplastic anterior pituitary, ectopic posterior pituitary
|
AR
|
Retinal dystrophy, developmental delay, facial dysmorphism (prominent forehead, low set posteriorly rotated ears, hypertelorism and a flat nasal bridge).
|
|
TCFL7
|
GH
|
Absent posterior pituitary, anterior pituitary hypoplasia, optic nerve hypoplasia, parital agenesis of corpus callosum, thin anterior commissure
|
AD
|
|
Bioinactive GH
Short stature associated with normal to high levels of growth hormone with low serum IGF-I concentrations “bioinactive GH” was first described in 1978 (136). This disorder is associated with a good clinical response to GH therapy and multiple subsequent cases have been reported in the literature (90). These multiple case reports contained no information on the genetic cause of the disorder. The first demonstration of the mechanism responsible for bioinactive GH came in 1997 (137) when Takashi and co-workers described a heterozygous glycine to aspartic acid substitution at amino acid 112 of the GH molecule resulting in impaired binding of the mutant GH to GHR. Reported mutations such as the R77C mutation (138,139) have also been found in normally statured relatives and functional work has failed to identify any difference between wild type and R77C GH on GHR binding, activation of the JAK/STAT pathway, secretion studies or ability to induce cell proliferation (140,141). The clinical scenario of normal to high GH concentrations with low IGF-I levels is not uncommon and a diagnosis of bioinactive GH should not be made unless a mutation is identified where there is a demonstration that the function of the variant GH is impaired.
A homozygous missense mutation (C53S) in the GH1 gene was reported in a Serbian patient with height SDS of -3.6 at 9 years of age (142). Altered affinity for the GH receptor was demonstrated in functional studies, presumably due to alteration of the disulphide bond between Cys-53 and Cys-65 in the GH molecule.
Laron Syndrome
Laron syndrome, caused by loss of function mutations in the GHR gene(143), was first described in 1966 (144). Since then more than 250 patients have been described in the literature with over 70 missense, nonsense, indels and splice mutations within the GHR gene (145). The majority of mutations describe are inherited in an autosomal recessive manner but autosomal dominant inheritance has been described in a small number of cases (146). Patients present with severe short stature having been born with normal birth size. The facial phenotype is similar to severe GH deficiency with frontal bossing and midface hypoplasia. Intellect, development and head circumference are normal. IGF-I, IGFBP-3 and ALS concentrations are low in serum with normal to raised baseline GH levels with raised peak stimulated GH level. Typical adult height is around -5 SD. Measurement of GHBP in serum is useful as, when markedly low, indicates absence of the extracellular component of the GHR. Since mutations can occur in the transmembrane or intracellular domains, the presence of GHBP in serum does not exclude a diagnosis of Laron syndrome. The standard diagnostic test is an IGF-I generation test. Specificity of this test is around 77-91% and when applied to a population with low prevalence of GH insensitivity the positive predictive value of the test is likely to be low (147). In addition, there is a limited normative data for the IGF-I generation test. Buckway at al reported the results of IGF-I generation tests in normal subjects and subjects with GH deficiency, Laron syndrome and idiopathic short stature (148). Sensitivity of the IGF-I generation test in this population (who all had the same E180 splice mutation in the GHR, was 77% (the cut off for a normal result on this test was an increase in IGF-I to >15ng/mL post-GH stimulation (149)). Diagnosis of Laron syndrome therefore relies upon integration of clinical and biochemical findings and selecting patients for further genetic studies.
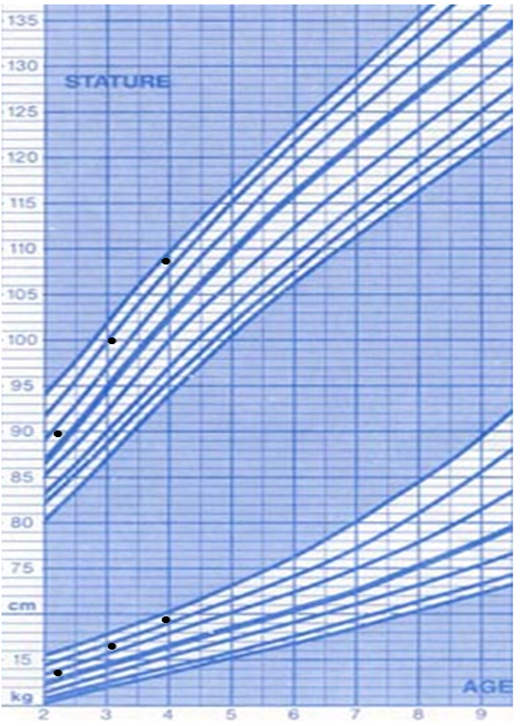
Recombinant human IGF-I therapy provides limited benefit in improving height. In an observational study containing 28 patients with Laron syndrome the results of treatment with 120 mg/kg/day IGF-I for a mean duration of 5 years increased height SDS from -6.1 SD to -5.1 SD (150). In the first year of treatment there was a marked increase in height velocity from 2.8 to 8.7 cm but height velocity markedly decreased after the first year of treatment. In a separate report of 21 individuals with GH insensitivity – 5 of whom had Laron syndrome there was an increase in height SDS from baseline of +1.9 SD with treatment of 120 mcg/kg/day IGF-I for a mean of 10.5 years (151). The treatment effect is markedly lower than that of GH in children with severe congenital GH deficiency (an example of a growth chart of a child with Laron syndrome treated with IGF-I is given in Figure 6). While GH therapy stimulates both hepatic and local IGF-I production, subcutaneous injections of IGF-I do not simulate this local IGF-I production. In addition, GH therapy normalizes not only IGF-I levels but levels of IGFBP-3 and ALS whereas in GH insensitive subjects treated with IGF-I there is no increase in IGFBP-3 or ALS concentrations. Thus, it would be expected that the injected IGF-I would have a much lower half life than endogenous IGF-I. A combined therapy of IGF-I with IGFBP-3 disappointingly was less effective in improving height (152).
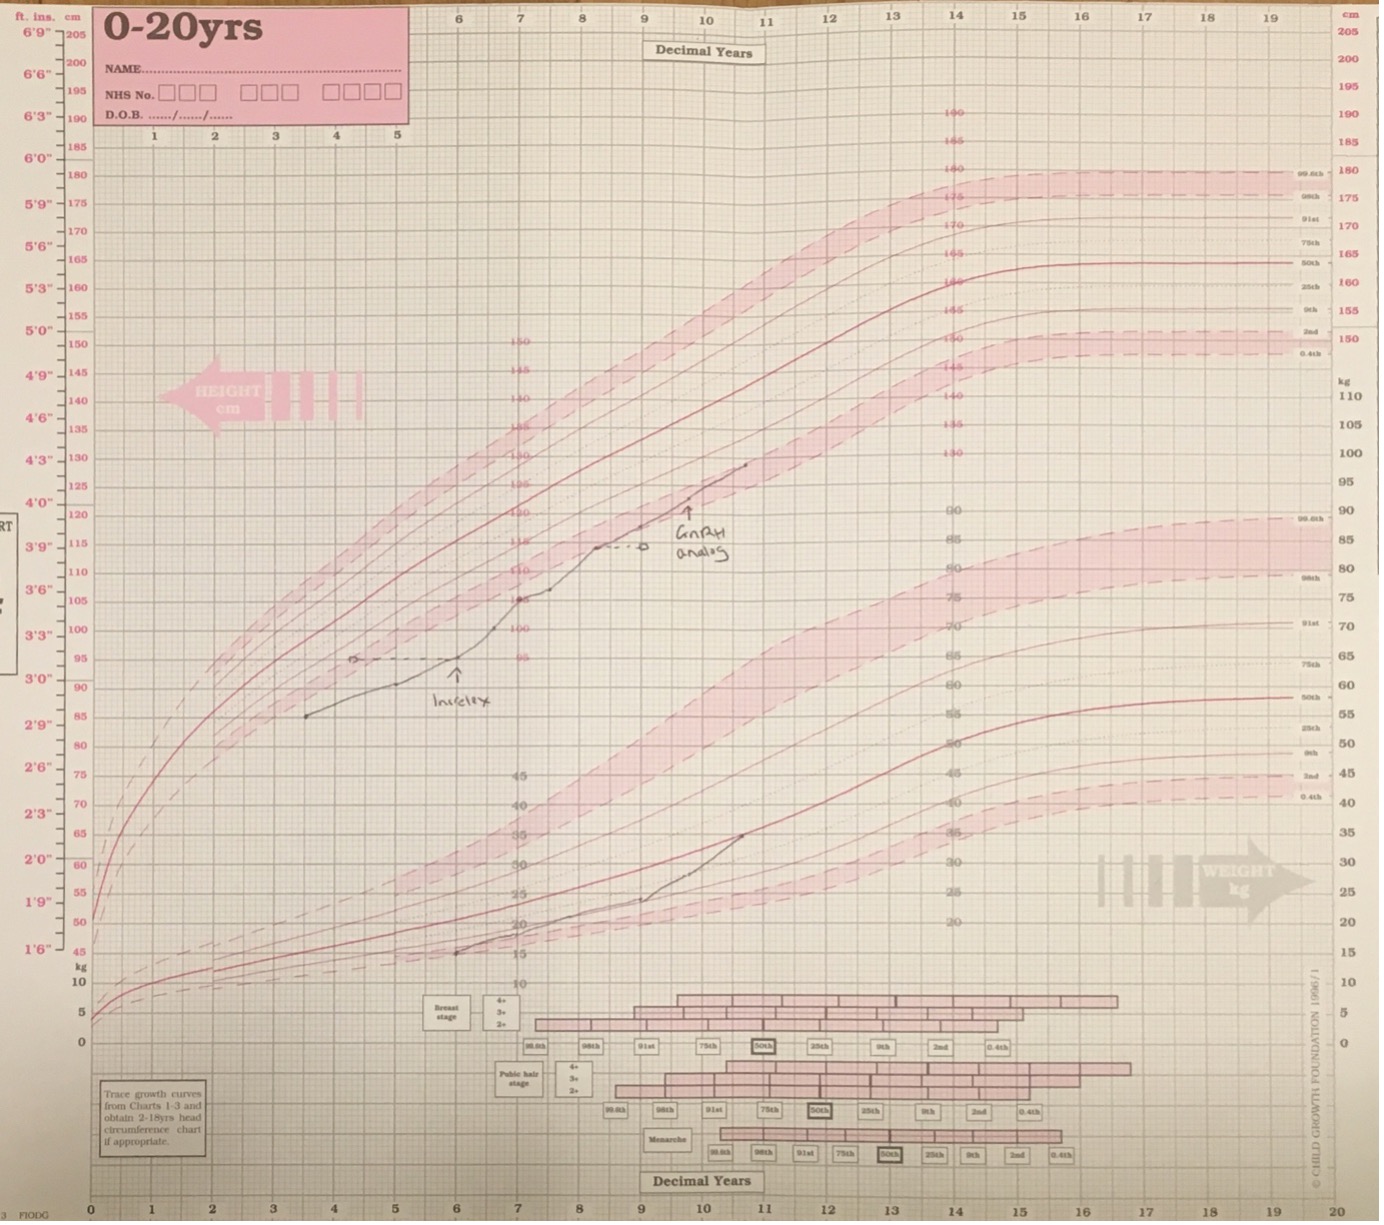
Figure 6. Growth chart of girl with Laron syndrome treated with recombinant human IGF-I (Increlex) from age of 5.8 years when height SDS was -4.2 SD. There is an increase in height velocity over the first year of treatment which is reduced in subsequent years of therapy. Height SDS improves to -2.1 SD by 10.25 years but this has been associated with the onset of puberty at 9 years (treatment with the GnRH analogue Zoladex was introduced at 9.8 years). Current height lies within parental target range. M denotes maternal height and F denotes adjusted paternal height.
STAT5b Mutations
The signal transducers and activators of transcription (STAT) family contains seven proteins (STAT1, -2, -3, -4, -5a, -5b and -6). Mutations in STAT1(153) and STAT3 are associated with immune deficiency and a mutation in STAT5b was described in a patient with growth hormone insensitivity and immune deficiency (154). The initial report was of a homozygous missense mutation in exon 15, encoding the critical SH2 domain leading to aberrant folding and aggregation of the protein. Six other mutations have been described including a nonsense mutation in exon 5 (155), two distinct nucleotide insertions (156,157) in exons 9 and 10 containing the DNA binding domain, a missense variant within the SH2 domain (158), a four nucleotide deletion in exon 5 (159) and a single nucleotide deletion in the Linker domain (160).
Until recently all the mutations identified were homozygous and the disorder is predominantly inherited in an autosomal recessive manner but dominant negative mutations have now been reported (161). There is some evidence of a mild effect of the heterozygous state as height SDS in parents of affected children is consistently below mean height for the population with range from -0.3 SD to -2.8 SD. Birth weight appears to be within normal limits but postnatal height is severely impaired with height SDS range of -3 to -9.9 (158). Growth is comparable to children with Laron syndrome. Bone age and puberty is commonly delayed perhaps reflecting in part the chronic state of ill health. A prominent forehead, depressed nasal bridge and high-pitched voice are seen in some patients. The biochemical findings are compatible with growth hormone insensitivity with normal to high basal growth hormone concentrations and a raised stimulated peak GH level. Of note, 1 subject had a low stimulated peak GH concentration of 6.6 mcg/. Serum IGF-I, IGFBP-3 and ALS concentrations were consistently low in all subjects, remaining low at end of an IGF-I stimulation test.
Clinical differentiation of patients with STAT5b mutations form those with Laron syndrome can be made with the immunodeficiency. All but one of the reported cases has presented with chronic pulmonary disease, particularly lymphoid interstitial pneumonia, with the other child having severe hemorrhagic varicella. Two patients have died from their lung disease and a further patient has required lung transplantation. Patients with STAT5b mutations also have raised serum prolactin levels which can also be helpful with diagnosis.
Acid Labile Subunit Deficiency
The human IGFALS gene is located on chromosome 16p13.3 and ALS deficiency is inherited in an autosomal recessive pattern with homozygous and compound heterozygous mutations identified including missense, nonsense, deletions, duplications and insertions. The mutations are spread throughout the IGFALS gene which contains 2 exons and encodes a protein of 605 amino acids (162). The majority of the mutations are located in the 20 central leucine rich domains. The clinical phenotype, first described in 2004 (163), is of very low serum concentrations of IGF-I, IGFBP-3 and ALS with a moderate degree of short stature (-2 to -3SD).
Limited data is available on size at birth but weight appears to be within the lower half of the normal range (-0.2 to -1.9 SD) with only one individual reported to be SGA with a birth weight of -2.2 SD. The data on birth length is even more limited but all individuals measured were within normal range at -1.5 to +1.0 SD. Data on height during childhood is more abundant and hemorrhagic it is clear that postnatal growth is affected in the majority of individuals carrying ALS mutations. Mean prepubertal height in 17 patients was reported as -2.61 SD (range -3.9 to -1.06 SD) with final adult height of -2.15 SD (range -0.5 to -4.2 SD). There is a preponderance of males in the literature (88% reported cases) which may represent the increased likelihood of males with short stature to present to health care providers. In male’s pubertal onset is commonly delayed (6/11 with onset puberty >14 years and 3/11 onset >15 years). Serum IGF-I and IGFBP-3 standard deviation scores are very low (-3.3 to -11.2 SD for IGF-I and -3.6 to -18.5 for IGFBP-3), with undetectable ALS concentrations in all but one case (164). Levels of GH are increased with a mean peak GH of 46µg/L.
The relatively modest growth impairment in ALS deficiency is likely to be due to the preservation of the local production and action of IGF-I with deficiency of hepatic derived IGF-I. The diagnosis should be suggested by the presence of very low concentrations of IGF-I and, in particular, IGFBP-3 in the presence of moderate growth impairment. Although measurement of ALS is not routinely available this would also be a useful diagnostic tool.
Response to treatment with GH therapy has been poor and one child treated with recombinant human IGF-I did not improve height after 1 year of treatment.
IGF-I Gene Mutations
Deletions and mutations within the IGF1 gene are an extremely rare cause of GH insensitivity. The first patient was reported in 1996 (3) and there have been four subsequent affected families reported (165-168). The first patient described had a homozygous deletion of exons 3 and 5 of the IGF1 gene leading to frameshift and generation of a premature termination codon. He had undetectable levels of serum IGF-I with normal concentrations of IGFBP-3 and ALS with raised baseline and spontaneous GH peak levels. He was born small for gestational age at 1.4 kg at term and displayed profound post-natal growth impairment with sensorineural hearing loss, microcephaly and developmental delay.
One subsequent report identified a similar phenotype of growth impairment, developmental delay, microcephaly and hearing impairment with a homozygous missense variant in exon 6 of IGF-1(167). The patient also had low IGF-I concentrations and high GH levels. Subsequent studies have identified this variant in individuals with normal height and there may be an alternative cause for this child’s growth impairment.
There have been two cases reported with similar phenotype of growth impairment, microcephaly and hearing impairment in individuals associated with homozygous mutations within the IGF1 gene (166,168). These mutations (V44M and R36Q) reduce the binding affinity of IGF-I for IGF1R. A large family with short stature and a heterozygous IGF1 mutation (c.402+1G>C) inducing splicing out of exon 4 with subsequent frameshift and truncated peptide (165)has also been reported. This family included 5 short individuals with the heterozygous IGF1 mutation and an additional 5 individuals who are short but do not have the IGF1 variant. The phenotype of the proband was less severe than other IGF1 mutation patients with normal birth size (3.0kg) but significant post-natal growth impairment (presenting height -4.0 SD), normal hearing, normal development except for attention deficit hyperactivity disorder and mildly reduced serum concentrations of IGF-I (-2.2 SD) with normal IGFBP-3 serum levels (-1.25 SD).
For all patients reported to date, treatment with GH has been ineffective. Treatment with recombinant human IGF-1 may be more effective but may be complicated by the development of antibodies in those patients with IGF1deletions. It should however be effective for patients with bioinactive IGF-I.
Chromosome 15 Abnormalities and Mutations Affecting the IGF-I Receptor
The phenotype of patients with mutations in the IGF1R gene is similar, if slightly milder, to patients with IGF1 gene defects. They are born SGA and continue to grow poorly with microcephaly and variable developmental delay. Reported birth weights are from -1.5 to -3.5 SD with head circumference of -2.0 to -3.2 SD. Birth length SDS is highly variable at -1.0 to -5.0 SD while childhood height ranges from -2.1 to -4.8 SD (169). The initial patient described had a compound heterozygous mutation (170) within IGF1R while all other patients to date have heterozygous mutations. These mutations are dispersed throughout the gene (169). Missense (171,172), nonsense (170), small deletions (173)and duplications (174) have already been identified leading to a variety of deleterious effects on the IGF1R including loss via nonsense mediated decay (174), production of a truncated protein (170), altered trafficking(171), reduced ligand binding (175) and altered tyrosine kinase activity (172). Serum IGF-I concentrations can be normal or raised but are generally > +1 SD.
Response to treatment with GH therapy is variable – of 5 patients reported no response was seen in two patients, an equivocal response seen in another two patients and only one patient responded well to therapy (169). GH dose ranged from 0.025 to 0.07 mg/kg/day with the best responder treated with the lowest dose of GH. The rationale behind GH therapy is that it increases hepatic and local production of IGF-I to improve growth. Where there is resistance to IGF-I it is not surprising that GH therapy is less effective. For most disorders clinicians the aim of GH therapy is to improve growth without generating IGF-I concentrations above the normal rage. For IGF1R mutations, given the IGF-I resistance, it may not be possible to achieve adequate growth without using high dose GH therapy with subsequent IGF-I concentrations above the normal reference range. The long-term effects of such therapy in this patient group are unknown and before embarking on such a strategy a careful discussion about the risks and benefits should be undertaken with the child/parents
Prior to the identification of mutations within the IGF1R gene there were reports of patients with abnormalities of chromosome 15 including monosomy, ring chromosome and unbalanced translocations. Allelic loss of chromosome 15 was described to result in growth impairment (176) while trisomy of chromosome 15 results in overgrowth (177), given the location of IGF1R at chromosome 15q26 it was hypothesized that the growth alterations were due to a dosage effect on IGF1R. The clinical phenotype is highly variable depending on the chromosomal aberration e.g., 15q26 deletion is associated with congenital diaphragmatic hernia as well as growth impairment (178). Response to GH therapy appears better for patients with chromosome 15 abnormalities with a first-year increase in height SDS of 0.8-1.5 (179).
Pregnancy-Associated Plasma Protein A2 Deficiency
Pregnancy-associated plasma protein A2 is a metalloproteinase responsible for the cleavage of IGFBP-3 and IGFBP-5, an essential step in releasing IGF-I from the ternary complex and allowing it to bind to the IGF1R. Two families have been reported with loss of function mutations in PAPPA2 leading to growth impairment with increased concentrations of IGF-I, ALS, IGFBP-3 and IGFBP-5 and a resultant reduction in free IGF-I (180). GH concentrations are raised due to the reduced free IGF-I. Birth size is moderately reduced in some subjects and the degree of postnatal growth impairment is highly variable ranging from -3.8 SD to -1.0 SD. Other clinical features include mild microcephaly, small chins and long thin fingers. Treatment with rhIGF-I in one family demonstrated an increase in height SDS of +0.4 SD over 1 year of treatment (181) while in the second family treatment was discontinued due to headache in one of two siblings (182).
ACQUIRED GH DEFICIENCY
Tumors of the Hypothalamus or Pituitary
CRANIOPHARYNGIOMA
Craniopharyngiomas are non-glial intracranial tumors derived from malformed embryonal tissue thought to originate from ectodermal remnants of Rathke’s pouch or residual embryonal epithelium of the anterior pituitary (183). More than 70% of adamantinomatous craniopharyngiomas contain a mutation of the β-catenin gene (184). Although rare, craniopharyngiomas are the commonest childhood tumor affecting the hypothalamo-pituitary axis accounting for 55-90% of sellar and parasellar lesions in childhood (185). The incidence is 0.5-2 per million per year (186) with 30-50% of cases diagnosed in childhood. In contrast to adulthood where the commonest histological type of craniopharyngioma is papillary, in excess of 70% of childhood craniopharyngiomas are adamantinomatous and associated with cyst formation. Survival rates with craniopharyngiomas are excellent exceeding 90% at 10 years (187)after diagnosis but morbidity with visual defects, hypothalamic obesity, and pituitary hormone deficiency is high.
Presentation is with a combination of symptoms of raised intracranial pressure, visual impairment, and endocrine deficits. Up to 87% of cases present with a least one pituitary hormone deficiency – the commonest being GH deficiency present in up to 75% of cases at diagnosis (188). The prevalence of GH deficiency rises after treatment to >90% of patients – with both surgical intervention and radiotherapy implicated in this increase in GH deficiency. Additional pituitary hormone deficits are common including diabetes insipidus which is present in 92% of cases (189).
Therapy for craniopharyngiomas can include a combination of surgery, radiotherapy and intra-lesional chemotherapy. Surgery can be via the transcranial or transsphenoidal route. Where it is possible to remove the entire tumor without causing damage to the hypothalamus or optic nerves this is the treatment of choice. For larger tumors involving these structures controversy exists on whether the benefits of a complete resection, namely a reduction in the risk of recurrence/progression, are outweighed by the surgical morbidity particularly hypothalamic obesity, visual impairment, and adipsic diabetes insipidus (190,191). The alternative strategy is a limited surgical resection followed by adjuvant treatment with either conventional radiotherapy or proton beam therapy. Recurrence rates for complete resection are 15-46% (192), 70-90% for patients treated with surgical partial resection alone and 21% for patients treated with surgical resection and radiotherapy (193).
There is good evidence to suggest that replacement GH therapy does not increase the risk of recurrence in craniopharyngioma (194,195) and that the gain in height is similar to that seen in congenital isolated GH deficiency. In one report the mean time between diagnosis and initiation of GH therapy was 2.3 years (194). A period of time after diagnosis, prior to the introduction of GH therapy, allows the completion of surgery and radiotherapy and a period of observation. Despite the reports on the overall safety of GH in craniopharyngioma rapid regrowth of the tumor after the initiation of GH therapy has been reported (196).
PITUITARY ADENOMAS
Pituitary adenomas are rare in childhood comprising only 3% of supratentorial tumors of childhood (197). Functioning adenomas are more common than non-functioning adenomas with the commonest being prolactinomas, followed by ACTH secreting adenomas then GH secreting adenomas. In one series of 41 patients with childhood onset adenomas, 29 (70%) were prolactinomas, 5 (12%) were ACTH secreting adenomas, one patient (2%) presented with a GH secreting adenoma and the remaining 6 patients (15%) presented with non-functioning adenomas (198). GH deficiency was present in four out of the 41 patients during childhood and 13 patients during follow up into adulthood. All patients who developed GH deficiency had a macroadenoma. In approximately 5% of cases pituitary adenomas are familial and this is known to be caused by mutations in the genes encoding MENIN (199) and Aryl Hydrocarbon Receptor Interacting Protein (200).
OPTIC PATHWAY GLIOMA
Optic pathway gliomas are tumors of the pre-cortical visual pathway which may also involve the hypothalamus. In around 1 in 3 cases they are associated with neurofibromatosis type 1 (201). They commonly present with ophthalmological signs and symptoms with the main endocrine presentation being precocious puberty. In the majority of cases there is limited or no progression of the tumor and only monitoring is required. Surgery not recommended for most cases due to the possibility of post-operative visual impairment. Where required initial treatment is with chemotherapy with radiotherapy reserved for teenagers and younger children who have not responded to chemotherapy. Although effective with a 90% 10-year progression free survival radiotherapy is associated with an increased risk of worsening visual impairment, endocrine deficits, cerebrovascular disease, and neurocognitive deficits.
GH deficiency in optic pathway gliomas can be present prior to radiotherapy but is much more common post radiotherapy. In one study of 68 children with optic pathway gliomas 19 developed GH deficiency, 15 of whom had received radiotherapy (202). In another study of 21 patients with optic pathway gliomas treated with radiotherapy only one patient had GH deficiency pre-radiotherapy while all patients had GH deficiency post radiotherapy (203). GH therapy is highly effective and restores adult height to within normal range (204). Optic pathway gliomas can be associated with GH excess, especially in NF1 syndrome related cases.
LANGERHANS CELL HISTIOCYTOSIS
Langerhans cell histiocytosis (LCH) is a rare disorder with a prevalence of ~4 per million children (205). It is a condition in which there is proliferation and accumulation of clonal dendritic cells (LCH cells) bearing an immunophenotype very close to that of the normal epidermal Langerhans cells of the skin (205). LCH cells can spread to nearly any site in the body, proliferate and lead to local inflammation and tissue destruction. The commonest pituitary hormone deficit in Langerhans cell histiocytosis is diabetes insipidus which develops in around 25% of childhood patients with LCH while GH deficiency is the second commonest endocrinopathy present in 9-12% of childhood LCH patients.
Radiation
Neuroendocrine abnormalities of the hypothalamo-pituitary axis evolve with time after radiation induced damage. The first, and sometimes only, hormone deficiency following radiation exposure of the HPA axis is growth hormone deficiency. The risk of GH deficiency is related to the total radiation dose, fraction size and time between fractions. Almost all children exposed to >30 Gy cranial irradiation will develop GH deficiency around 65% of those receiving <30 Gy develop GH deficiency by 5 years post radiotherapy (206). Isolated GH deficiency has also been reported in children exposed to 18-24 Gy as used prophylactically in acute lymphoblastic leukemia (207) and in children exposed to as little as 10 Gy as part of total body irradiation (208).
The hypothalamus is thought to be the site of radiation induced damage to the HPA as when exposed to radiation <50 Gy hormone deficiencies remain common ~90% after 10 years (209) but in contrast delivery of radiation doses 500-1500 Gy to the pituitary alone result in lower rates of endocrinopathy – 40% 14 years after exposure (210). Additional evidence of the susceptibility of the hypothalamus to radiation induced damage comes from the high prevalence rates of hypothalamic dysfunction on dynamic endocrine tests observed after radiation exposure (211) and the presence of impaired GH secretion to stimuli acting through the hypothalamus with normal GH secretion to stimuli acting directly on the pituitary (212). Within the hypothalamic-pituitary axis there is differential sensitivity to radiation induced damage with the somatotrophic axis being the most vulnerable to damage, followed by GnRH-FSH/LH and then the CRH-ACTH and TRH-TSH axes which are the least sensitive to radiation induced damage (213). This sequence of loss of pituitary hormones in radiation induced damage is seen in both animal models (213,214) and in humans where lower doses of radiation (e.g. 18-30 Gy used in treatment of childhood leukemia and brain tumors) leads to isolated GHD(215) whereas higher doses of radiation >60 Gy, used in the treatment of skull base tumors and nasopharyngeal carcinomas, leads to multiple pituitary hormone deficiency (216,217). Risk of pituitary hormone deficiency increases with time elapsed after radiation exposure in addition to the radiation dose – in one study around 50% of children treated with 27-32 Gy for a brain tumor were GHD after one year of treatment, with 85% GHD by 5 years post treatment and almost all GHD by 9 years post treatment (206).
GH NEUROSECRETORY DYSFUNCTION
One form of GHD particularly well described following radiation injury to the hypothalamic-pituitary axis is GH neurosecretory dysfunction (218-220). Neurosecretory dysfunction is characterized by normal responses to pharmacological stimuli of GH secretion but reduced spontaneous physiological GH secretion. GH neurosecretory function in seen most frequently with lower radiation doses of <24 Gy (220) and it appears that doses >27 Gy both spontaneous and pharmacologically stimulated GH responses are reduced (221). The possibility of GH neurosecretory dysfunction makes the diagnosis of GHD in children exposed to cranial irradiation challenging. The presence of normal IGF-I and IGFBP-3 concentrations in many children with radiation induced GH deficiency (222-225) (proven with multiple pharmacological stimulation tests) compounds these difficulties.
For children with brain tumors that can exfoliate cells into the cerebrospinal fluid (e.g., ependymoma or medulloblastoma) radiotherapy is delivered to the spine in addition to cranial irradiation. Spinal irradiation has a profound effect on growth and leads to reduced height and disproportionate growth with decreased upper to lower segment ratio (226). Brauner et al compared children treated with craniospinal irradiation to those receiving cranial irradiation alone with height SDS being significantly lower in the craniospinal group at 1.46 SD compared to the cranial irradiation only group with a height SDS of -0.15 (221). Final height in adults who received craniospinal irradiation is also significantly lower than adults receiving cranial irradiation alone (-2.37 v -1.14 SD) (227). Lower age at radiation exposure is associated with a lower adult height SDS (227) with height loss from spinal irradiation estimated at 9 cm when exposed at 1 year, 7cm when exposed at 5 years and 5.5 cm when exposed at 10 years.
Response to treatment with GH therapy is poorer in children with radiation induced GH deficiency than in children with congenital GHD. For most patients with congenital GHD, GH therapy will lead to significant catch-up growth but in patients with radiation induced GH deficiency catch up growth is rare (228,229). However, while GH treatment does not appear to induce catch up growth it prevents a further decline in height SDS (228,230). The cause of the poorer response seen in patients with radiation induced GH deficiency are likely to be multifactorial including early puberty, delayed GH therapy, use of lower doses of GH and the direct effect of spinal irradiation. GH therapy in children who have previously received craniospinal radiotherapy does prevent further height loss but does so at the expense of further exaggerating the skeletal disproportion seen in these patients.
There is extensive evidence linking the GH-IGF-I system to risk of cancer via several sources:
- Up-regulating the activity of the GH-IGF-I axis in leads to increased development of tumors in animal models (for review see Yaker et al (231)).
- In vitro evidence of expression of GH, GHR and IGF-I/II by tumors and the ability GH and IGF-I to induce cancer cell proliferation and metastases (for review see Clayton et al (232))
- Epidemiological evidence has linked higher serum IGF-I concentrations to cancer risk (233-236)
- Increased risk colorectal and thyroid cancers in patients with acromegaly (a condition of chronic GH excess) (237-239)
This evidence did lead to concerns about the risk of administration of GH therapy to patients with GH deficiency and a history of cancer. The majority of studies examining risk of recurrence in children with cancers treated with GH indicate that there is no increased risk of recurrence (240-244). One notable exception is the Childhood Cancer Survivor Study based in centers in North America where the standardized incidence ratio of second malignancy was elevated (2.1 at average follow up of 18 years) in the 361 individuals treated with GH (245). The majority of brain tumor recurrences occur during the first two years after completion of primary treatment and this has led to the recommendation that treatment with GH should be considered after this time point. This strategy prevents the association between early tumor recurrence and GH therapy by families but potentially denies children with tumor or radiation induced GH deficiency treatment for a considerable length of time. Children with brain tumors require monitoring of growth and consideration should be given to testing for GH deficiency in children with growth failure who have completed primary treatment. GH therapy should be carefully discussed with the family and oncologist where it is considered before 2 years post primary treatment.
Trauma
Traumatic brain injury is relatively common in childhood with ~180 children per 100,000 population sustaining a closed head injury each year. The proposed mechanism for traumatic brain injury induced hypopituitarism is that injury to the hypophyseal vessels which transverse the stalk leads to anterior pituitary ischemia and infarction. Postmortem studies of fatal closed head injuries identified hypothalamic lesions suggestive of infarction and ischemia in 43% of cases and pituitary lesions in 28% of cases (246). Although there have been multiple published case reports of anterior pituitary dysfunction in traumatic brain injury for many years (247) there has been a large increase in the number of systematic studies of pituitary function in survivors of traumatic brain injury since 2000. Several moderately sized studies of adult traumatic brain injury survivors have demonstrated risk of post-injury hypopituitarism. Deficiency of GH and gonadotrophins was more common than TSH or ACTH deficiency with 10-28% of patients being GH deficient and 8-30% of patients being gonadotrophin deficient (248-253). In the majority of these studies there has been no relationship between time post injury or injury severity and risk of pituitary dysfunction.
Until 2006 the literature on childhood traumatic brain injury and hypopituitarism was limited to case reports (for review of the case reports see Acerini et al (254)). The first report of pituitary function in children with traumatic brain injury studies a cohort of 55 patients (22 studied retrospectively and 30 studied prospectively) and identified 2 patients with low peak GH concentrations (255). Khadr et al reported a 39% rate of abnormalities of pituitary function tests in 33 childhood traumatic brain injury patients (256). None of these were felt to be clinically significant. In this study 7 patients had a low peak GH concentration but 6 out of the 7 were thought to have peri-pubertal blunting of the GH response with one borderline post-pubertal GHD patient who declined further examination (256). Poomthavorn et al (257) described a cohort of 54 patients with childhood brain injury 4 of whom had known multiple pituitary hormone deficiency prior to the start of the study, in the 50 patients screened however, there were no patients identified with GH deficiency.
The largest study of childhood traumatic brain injury and pituitary function is by Heather et al (258). It examined the pituitary function of 198 survivors of childhood traumatic brain injury. Importantly they used an integrated assessment of GH stimulation tests (including 2nd test with priming where required), auxology and IGF-I concentrations in order to reach a diagnosis of GHD. While a low peak GH concentration (<5µg/L, used as the cut off for diagnosis of GHD in New Zealand at the time of the study) was identified in 16 patients, height SDS ranged from -0.9 SD to +3.6 SD and IGF-I concentrations were within normal limits for all subjects. For this study population had the diagnosis of GHD been based solely on a GH stimulation test and a cut off of 10µg/L for the diagnosis of GHD, 33% of patients would have been incorrectly diagnosed as GHD.
The risk of hypopituitarism in childhood traumatic brain injury appears to be low and currently routine screening of pituitary function in this group is not justified outside the context of on-going research studies.
Hypophysitis
Hypophysitis is characterized by cellular infiltration and inflammation and can be classified as lymphocytic, xanthomatous, granulomatous, necrotizing, IgG4-related and mixed forms. Lymphocytic hypophysitis is the commonest type but overall the disease is extremely rare with an estimated incidence of 1 per 9 million population (259). Presentation is often with visual disturbance, headache and vomiting. MRI may identify a homogeneous enhancing sellar mass. In adults’ deficiency of TSH and ACTH are particularly common and diabetes insipidus is said to be rare (260). The limited pediatric case reports include several children with diabetes insipidus and it may be that the pattern of hormone insufficiency is influenced by age at presentation. Hypophysitis is more common in pregnant women but can also occur in non-pregnant women, men and in children (261,262). Definitive diagnosis is with histopathology while treatment includes hormone replacement therapy and surgery where the sellar mass compresses the optic chiasm. The medical treatment of choice is high dose glucocorticoid therapy but alternative reported therapies include azathioprine (263), methotrexate (264), cyclosporin A (265) and stereotactic radiation (266).
GROWTH HORMONE EXCESS
While short stature and GHD are common reasons to consult a pediatric endocrinologist, tall stature is a far less common reason to present to a pediatric endocrinologist. Within the group of patients presenting with tall stature in childhood the majority will have either familial tall stature or a genetic/syndromic cause for their tall stature (e.g., Beckwith Wiedemann syndrome, Sotos syndrome, Marfan Syndrome, Simpson-Golabi-Behmel syndrome). GH excess is an extremely rare disorder in pediatric practice. Causes of GH excess include GH secreting pituitary micro or macroadenomas, ectopic GHRH production and genetic abnormalities affecting GH secretion (McCune Albright syndrome and Carney complex).
The commonest symptom of GH excess in childhood is rapid growth. In a series of 15 childhood patients (6 female) with GH secreting adenomas reported by Takumi eta al (267) all the patients presented with rapid growth although 3 also had visual signs/symptoms, 3 amenorrhea, 2 headaches, 1 with hypogonadism and 1 with precocious puberty. Microadenomas were present in 4/15 patients. Acromegalic features such as soft tissue growth of the hands and feet, mandibular overgrowth with prognathism, forehead protrusion and deepening of voice can also occur. The presence of acromegalic features in likely to be linked to the timing of onset (more common with onset in adolescence) and the presence of hypogonadism. Additional clinical features include excessive sweating, carpal tunnel syndrome, lethargy, arthropathy, impaired glucose tolerance and hypertension. Although rare in childhood, hypertension and glucose intolerance are seen in approximately 15% of adolescents presenting with GH excess (268).
The diagnosis of GH excess is based on the clinical features and auxology in combination with biochemical evidence. Measurement of IGF-I concentration is useful but the reference range used must be specific for the gender, age and pubertal stage of the child. As IGF-I concentrations rise during puberty a precocious puberty will lead to a raised growth velocity with a serum IGF-I concentration which may be raised for age and gender will not be raised for pubertal stage. Due to the variability of GH levels throughout the day assessment of growth hormone levels is either via an oral glucose tolerance test for GH suppression or a GH day curve. The oral glucose tolerance test for GH suppression is essentially identical to a standard oral glucose tolerance test but with measurement of glucose, insulin and GH at 0, 60, 90, 120 and 150 minutes. A normal response is suppression of GH levels to < 0.4 mcg/L (269). Some centers will undertake a GH day curve – measurement of at least 5 separate GH levels over 12 hours, however, given that adolescence is the age at which there is maximal physiological GH secretion and the lack of GH day curve normative data in adolescence interpretation of this test can be challenging.
Benign GH secreting adenomas are the most common cause of GH excess. Mutations in the genes encoding GPR101 (causing X-linked acrogigantism), MENIN (270), aryl hydrocarbon receptor interacting protein (200) and p27 (271) are known to predispose to the development of pituitary adenomas. Overall, most GH secreting adenomas are sporadic but the proportion with a genetic basis is likely to be higher in childhood.
Transsphenoidal surgery is the treatment of choice for patients with microadenomas, macroadenomas without cavernous sinus or bone extension or where the tumor is causing symptoms from compression (272). Surgical removal is expected to lead to a biochemical cure in 75-95% of patients, with lower probability of cure in patients with macroadenomas. There are three classes of medical treatments for GH excess:
- Dopamine agonists – cabergoline, bromocriptine
- Somatostatin analogues – octreotide, pasireotide, lanreotide
- GH receptor antagonists - pegvisomant
Medical therapy can be used either where there is failure of surgical therapy, where the tumor is not amenable to surgery or prior to surgery/radiotherapy. Dopamine agonists are the only oral therapy available. Of the dopamine agonists available, only cabergoline has shown efficacy (273) in acromegalic patients and as monotherapy achieves a biochemical cure in a minority of patients (274). Cabergoline is most useful either in tumors which co-secrete prolactin as well as GH or in combination with another therapeutic agent. The somatostatin analogues are effective in both reducing GH and IGF-I levels as well as reducing tumor size. Long acting, once monthly preparations of the somatostatin analogues represent the mainstay of therapy. Somatostatin analogues achieve biochemical resolution in up to 70% of patients (275) and tumor shrinkage (mean size reduction of 50%) in 75% of patients (276). Pegvisomant is the only GH receptor antagonist therapy available and is the most effective therapy at achieving a biochemical cure but in a small proportion (~2%) leads to tumor growth. Radiotherapy is generally reserved as a third line treatment due to the long-time taken to achieve maximum effect (up to 10 years (277)) and risks of hypopituitarism (up to 50% by 5 years post radiotherapy), visual problems and late effects of cerebrovascular disease and second tumors. Given the rarity of GH secreting tumors in childhood close liaison with an adult endocrinologist experienced in the management of acromegaly is recommended for a pediatric endocrinologist when faces with such a patient.
McCune Albright Syndrome
McCune Albright syndrome is disorder characterized by the clinical triad of polyostotic fibrous dysplasia, café au lait skin hyperpigmentation and gonadotrophin independent precocious puberty. It is caused by postzygotic activating mutations of GNAS which encodes a stimulatory subunit of G protein, Gsα (278). GHRH receptor is a G protein coupled receptor and thus McCune Albright syndrome can lead to autonomous GH hypersecretion from the pituitary by activating the signal transduction pathway downstream of this receptor. In a cohort of 58 children and adults with McCune Albright syndrome Akintoye et al (279) identified 12 patients (21%) with GH excess including 6 (4 female, 2 male) who were <16 years. IGF-I concentrations in 10/12 were >2.5 SD above mean but in 2 patients surprisingly they were low at -2.5 and -0.2 SD. This may be due to the cyclical nature of the hormone hypersecretion in McCune Albright syndrome. MR imaging identified microadenomas in 4 patients and no tumor visible in the remaining patients. Clinical diagnosis of GH excess remains difficult as the facial changes can be masked or mistaken for the development of fibrous dysplastic changes in bone and the precocious puberty can mask the GH induced growth excess. The presence of a normal final height in a patient with precocious puberty indicates the potential presence of GH excess (279). Co-secretion of prolactin is common and the majority of patients have hyperprolactinemia. Due to bone thickening and fibrous dysplasia surgery is not usually an option for treatment and radiotherapy is contra-indicated because of the potential for sarcomatous change in fibrous dysplasia. Of the 11 patients with MAS associated acromegaly 6 were treated with cabergoline and then octreotide. Although 5/6 responded to cabergoline treatment with a reduction in IGF-I concentrations none normalized their IGF-I concentration and a combination of cabergoline and octreotide normalized IGF-I concentrations in 4/6 patients. In a crossover trial of somatostatin analogue therapy and Pegvisomant in McCune Albright induced GH excess pegvisomant was effective in normalizing IGF-I concentrations in 4/5 patients while somatostatin therapy was effective in 3/5 patients (280).
Carney Complex
The Carney complex is an autosomal dominant disorder characterized by skin pigmentary abnormalities, myxomas, endocrine tumors or overactivity, and schwannomas. It is known to be caused by loss of function mutations in the PRKAR1A gene which encodes the regulatory subunit of protein kinase A (281). Dissociation of the regulatory subunits from the catalytic subunits of protein kinase A leads to activation of signal transduction. Under normal circumstances this dissociation is triggered by cAMP. Carney complex associated mutations lead to loss of the regulatory subunit and increased activity of protein kinase A associated signal transduction. GH secreting adenomas are reported in 10% of patients with carney complex but these are rare before puberty (282). Mild abnormalities in GH, IGF-I and prolactin levels are present in up to 79% of patients and there probably a long period of sommatomammotroph cell hypertrophy and mild hypersecretion prior to the development of true GH excess (283). Histology of Carney complex associated GH tumors is distinct and includes the presence of multifocal tumors, somatomammotroph hypertrophy and the secretion of multiple hormones from the tumor (284).
CONCLUSIONS
Growth disorders are one of the most common reasons for referral to a pediatric endocrinologist. GH deficiency can be effectively treated with recombinant human growth hormone but controversy still exists over the diagnosis of GH deficiency in childhood, particularly in relation to priming of GH stimulation tests. Over the past decade there has been a great expansion in our knowledge of the genetic causes underlying the congenital disorders causing hypopituitarism and GH deficiency but this has not yet led to any new therapies. While extremely rare in pediatric practice GH excess is an important diagnosis to consider in the tall child/adolescent and management should be undertaken in conjunction with an adult endocrinologist.
Important Concepts
- GH signal transduction is not induced by GHR dimerization but by a conformational change in the predimerized GHR leading to repositioning of the BOX1 motifs
- The diagnosis of growth hormone deficiency is made by combining information from auxology, biochemistry, and neuroimaging.
- In addition to GH deficiency and Laron syndrome there are now additional disorders of the GH-IGF-I axis – Stat5b deficiency, ALS deficiency, haploinsufficiency, and mutations in IGF1R and mutations in the IGF-I gene.
- There is an expanding number of genes where mutations lead to a disturbance of pituitary gland formation and pituitary hormone deficiency, however in the majority of patients with congenital hypopituitarism the genetic etiology remains unknown. Consider genetic screening in patients where there are multiple affected individuals in the family and in children where they have associated eye abnormalities.
- Response to growth hormone therapy is generally very good in patients with congenital GH deficiency where a final adult height within parental target range should be expected. In contrast, in patients with radiation induced GH deficiency, GH treatment is less effective and acts mainly to prevent further height loss.
- Recombinant human IGF-I is available for treating children with GH insensitivity. While first year height velocity often improves significantly the long-term effects on height are less effective than in children with congenital GH deficiency treated with growth hormone.
- GH excess is an extremely rare disorder in childhood. All childhood patients with a GH secreting adenoma should be screened for mutations in AIP and MEN1 and management should be shared with an adult endocrinologist.
REFERENCES
- Gluckman PD, Johnson-Barrett JJ, Butler JH, Edgar BW, Gunn TR. Studies of insulin-like growth factor -I and -II by specific radioligand assays in umbilical cord blood. Clinical endocrinology 1983; 19:405-413
- Verhaeghe J, Van Bree R, Van Herck E, Laureys J, Bouillon R, Van Assche FA. C-peptide, insulin-like growth factors I and II, and insulin-like growth factor binding protein-1 in umbilical cord serum: correlations with birth weight. American journal of obstetrics and gynecology 1993; 169:89-97
- Woods KA, Camacho-Hubner C, Savage MO, Clark AJ. Intrauterine growth retardation and postnatal growth failure associated with deletion of the insulin-like growth factor I gene. The New England journal of medicine 1996; 335:1363-1367
- Binder G, Hettmann S, Weber K, Kohlmuller D, Schweizer R. Analysis of the GH content within archived dried blood spots of newborn screening cards from children diagnosed with growth hormone deficiency after the neonatal period. Growth hormone & IGF research : official journal of the Growth Hormone Research Society and the International IGF Research Society 2011; 21:314-317
- Mayer M, Schmitt K, Kapelari K, Frisch H, Kostl G, Voigt M. Spontaneous growth in growth hormone deficiency from birth until 7 years of age: development of disease-specific growth curves. Hormone research in paediatrics 2010; 74:136-144
- Tanner JM. Fetus into man:physical growth from conception to maturity. . Cambridge, MA: Harvard University Press.
- Tanner JM. Regulation of Growth in Size in Mammals. Nature 1963; 199:845-850
- Baron J, Klein KO, Colli MJ, Yanovski JA, Novosad JA, Bacher JD, Cutler GB, Jr. Catch-up growth after glucocorticoid excess: a mechanism intrinsic to the growth plate. Endocrinology 1994; 135:1367-1371
- Giustina A, Scalvini T, Tassi C, Desenzani P, Poiesi C, Wehrenberg WB, Rogol AD, Veldhuis JD. Maturation of the regulation of growth hormone secretion in young males with hypogonadotropic hypogonadism pharmacologically exposed to progressive increments in serum testosterone. The Journal of clinical endocrinology and metabolism 1997; 82:1210-1219
- Weissberger AJ, Ho KK. Activation of the somatotropic axis by testosterone in adult males: evidence for the role of aromatization. The Journal of clinical endocrinology and metabolism 1993; 76:1407-1412
- Veldhuis JD, Metzger DL, Martha PM, Jr., Mauras N, Kerrigan JR, Keenan B, Rogol AD, Pincus SM. Estrogen and testosterone, but not a nonaromatizable androgen, direct network integration of the hypothalamo-somatotrope (growth hormone)-insulin-like growth factor I axis in the human: evidence from pubertal pathophysiology and sex-steroid hormone replacement. The Journal of clinical endocrinology and metabolism 1997; 82:3414-3420
- Meinhardt UJ, Ho KK. Modulation of growth hormone action by sex steroids. Clinical endocrinology 2006; 65:413-422
- Smith EP, Boyd J, Frank GR, Takahashi H, Cohen RM, Specker B, Williams TC, Lubahn DB, Korach KS. Estrogen resistance caused by a mutation in the estrogen-receptor gene in a man. The New England journal of medicine 1994; 331:1056-1061
- Morishima A, Grumbach MM, Simpson ER, Fisher C, Qin K. Aromatase deficiency in male and female siblings caused by a novel mutation and the physiological role of estrogens. The Journal of clinical endocrinology and metabolism 1995; 80:3689-3698
- Kojima M, Hosoda H, Date Y, Nakazato M, Matsuo H, Kangawa K. Ghrelin is a growth-hormone-releasing acylated peptide from stomach. Nature 1999; 402:656-660
- Gnanapavan S, Kola B, Bustin SA, Morris DG, McGee P, Fairclough P, Bhattacharya S, Carpenter R, Grossman AB, Korbonits M. The tissue distribution of the mRNA of ghrelin and subtypes of its receptor, GHS-R, in humans. The Journal of clinical endocrinology and metabolism 2002; 87:2988
- Inui A, Asakawa A, Bowers CY, Mantovani G, Laviano A, Meguid MM, Fujimiya M. Ghrelin, appetite, and gastric motility: the emerging role of the stomach as an endocrine organ. FASEB J 2004; 18:439-456
- Date Y, Nakazato M, Hashiguchi S, Dezaki K, Mondal MS, Hosoda H, Kojima M, Kangawa K, Arima T, Matsuo H, Yada T, Matsukura S. Ghrelin is present in pancreatic alpha-cells of humans and rats and stimulates insulin secretion. Diabetes 2002; 51:124-129
- Takaya K, Ariyasu H, Kanamoto N, Iwakura H, Yoshimoto A, Harada M, Mori K, Komatsu Y, Usui T, Shimatsu A, Ogawa Y, Hosoda K, Akamizu T, Kojima M, Kangawa K, Nakao K. Ghrelin strongly stimulates growth hormone release in humans. The Journal of clinical endocrinology and metabolism 2000; 85:4908-4911
- Tannenbaum GS, Epelbaum J, Bowers CY. Interrelationship between the novel peptide ghrelin and somatostatin/growth hormone-releasing hormone in regulation of pulsatile growth hormone secretion. Endocrinology 2003; 144:967-974
- Panetta R, Patel YC. Expression of mRNA for all five human somatostatin receptors (hSSTR1-5) in pituitary tumors. Life sciences 1995; 56:333-342
- Siler TM, VandenBerg G, Yen SS, Brazeau P, Vale W, Guillemin R. Inhibition of growth hormone release in humans by somatostatin. The Journal of clinical endocrinology and metabolism 1973; 37:632-634
- Broglio F, Koetsveld Pv P, Benso A, Gottero C, Prodam F, Papotti M, Muccioli G, Gauna C, Hofland L, Deghenghi R, Arvat E, Van Der Lely AJ, Ghigo E. Ghrelin secretion is inhibited by either somatostatin or cortistatin in humans. The Journal of clinical endocrinology and metabolism 2002; 87:4829-4832
- Hindmarsh PC, Matthews DR, Brook CG. Growth hormone secretion in children determined by time series analysis. Clinical endocrinology 1988; 29:35-44
- Skinner AM, Price DA, Addison GM, Clayton PE, Mackay RI, Soo A, Mui CY. The influence of age, size, pubertal status and renal factors on urinary growth hormone excretion in normal children and adolescents. Growth Regul 1992; 2:156-160
- Hindmarsh PC, Fall CH, Pringle PJ, Osmond C, Brook CG. Peak and trough growth hormone concentrations have different associations with the insulin-like growth factor axis, body composition, and metabolic parameters. The Journal of clinical endocrinology and metabolism 1997; 82:2172-2176
- Niall HD. Revised primary structure for human growth hormone. Nature: New biology 1971; 230:90-91
- Masuda N, Watahiki M, Tanaka M, Yamakawa M, Shimizu K, Nagai J, Nakashima K. Molecular cloning of cDNA encoding 20 kDa variant human growth hormone and the alternative splicing mechanism. Biochimica et biophysica acta 1988; 949:125-131
- Lewis UJ, Dunn JT, Bonewald LF, Seavey BK, Vanderlaan WP. A naturally occurring structural variant of human growth hormone. The Journal of biological chemistry 1978; 253:2679-2687
- Zhang Y, Jiang J, Black RA, Baumann G, Frank SJ. Tumor necrosis factor-alpha converting enzyme (TACE) is a growth hormone binding protein (GHBP) sheddase: the metalloprotease TACE/ADAM-17 is critical for (PMA-induced) GH receptor proteolysis and GHBP generation. Endocrinology 2000; 141:4342-4348
- Martini JF, Pezet A, Guezennec CY, Edery M, Postel-Vinay MC, Kelly PA. Monkey growth hormone (GH) receptor gene expression. Evidence for two mechanisms for the generation of the GH binding protein. The Journal of biological chemistry 1997; 272:18951-18958
- Baumann G. Growth hormone binding protein 2001. Journal of pediatric endocrinology & metabolism : JPEM 2001; 14:355-375
- Fairhall KM, Carmignac DF, Robinson IC. Growth hormone (GH) binding protein and GH interactions in vivo in the guinea pig. Endocrinology 1992; 131:1963-1969
- Maheshwari H, Lillioja S, Castillo CE, Mercado M, Baumann G. Growth hormone-binding protein in human lymph. The Journal of clinical endocrinology and metabolism 1995; 80:3582-3584
- Brown RJ, Adams JJ, Pelekanos RA, Wan Y, McKinstry WJ, Palethorpe K, Seeber RM, Monks TA, Eidne KA, Parker MW, Waters MJ. Model for growth hormone receptor activation based on subunit rotation within a receptor dimer. Nature structural & molecular biology 2005; 12:814-821
- Strous GJ, dos Santos CA, Gent J, Govers R, Sachse M, Schantl J, van Kerkhof P. Ubiquitin system-dependent regulation of growth hormone receptor signal transduction. Current topics in microbiology and immunology 2004; 286:81-118
- Brooks AJ, Waters MJ. The growth hormone receptor: mechanism of activation and clinical implications. Nature reviews Endocrinology 2010; 6:515-525
- Brooks AJ, Dai W, O'Mara ML, Abankwa D, Chhabra Y, Pelekanos RA, Gardon O, Tunny KA, Blucher KM, Morton CJ, Parker MW, Sierecki E, Gambin Y, Gomez GA, Alexandrov K, Wilson IA, Doxastakis M, Mark AE, Waters MJ. Mechanism of activation of protein kinase JAK2 by the growth hormone receptor. Science 2014; 344:1249783
- Lanning NJ, Carter-Su C. Recent advances in growth hormone signaling. Reviews in endocrine & metabolic disorders 2006; 7:225-235
- Rowlinson SW, Yoshizato H, Barclay JL, Brooks AJ, Behncken SN, Kerr LM, Millard K, Palethorpe K, Nielsen K, Clyde-Smith J, Hancock JF, Waters MJ. An agonist-induced conformational change in the growth hormone receptor determines the choice of signalling pathway. Nature cell biology 2008; 10:740-747
- Saharinen P, Vihinen M, Silvennoinen O. Autoinhibition of Jak2 tyrosine kinase is dependent on specific regions in its pseudokinase domain. Molecular biology of the cell 2003; 14:1448-1459
- Boisclair YR, Rhoads RP, Ueki I, Wang J, Ooi GT. The acid-labile subunit (ALS) of the 150 kDa IGF-binding protein complex: an important but forgotten component of the circulating IGF system. The Journal of endocrinology 2001; 170:63-70
- Seccareccia E, Brodt P. The role of the insulin-like growth factor-I receptor in malignancy: an update. Growth hormone & IGF research : official journal of the Growth Hormone Research Society and the International IGF Research Society 2012; 22:193-199
- Dupont J, Holzenberger M. IGF type 1 receptor: a cell cycle progression factor that regulates aging. Cell cycle 2003; 2:270-272
- Baker J, Liu JP, Robertson EJ, Efstratiadis A. Role of insulin-like growth factors in embryonic and postnatal growth. Cell 1993; 75:73-82
- Liu JL, Yakar S, LeRoith D. Conditional knockout of mouse insulin-like growth factor-1 gene using the Cre/loxP system. Proc Soc Exp Biol Med 2000; 223:344-351
- Yakar S, Rosen CJ, Beamer WG, Ackert-Bicknell CL, Wu Y, Liu JL, Ooi GT, Setser J, Frystyk J, Boisclair YR, LeRoith D. Circulating levels of IGF-1 directly regulate bone growth and density. J Clin Invest 2002; 110:771-781
- Growth Hormone Research S. Consensus guidelines for the diagnosis and treatment of growth hormone (GH) deficiency in childhood and adolescence: summary statement of the GH Research Society. GH Research Society. The Journal of clinical endocrinology and metabolism 2000; 85:3990-3993
- Richmond EJ, Rogol AD. Growth hormone deficiency in children. Pituitary 2008; 11:115-120
- Eugster EA, Pescovitz OH. Gigantism. The Journal of clinical endocrinology and metabolism 1999; 84:4379-4384
- Murray PG, Hague C, Fafoula O, Patel L, Raabe AL, Cusick C, Hall CM, Wright NB, Amin R, Clayton PE. Associations with multiple pituitary hormone deficiency in patients with an ectopic posterior pituitary gland. Clinical endocrinology 2008; 69:597-602
- Clemmons DR. Consensus statement on the standardization and evaluation of growth hormone and insulin-like growth factor assays. Clinical chemistry 2011; 57:555-559
- Kaplan SL, Abrams CA, Bell JJ, Conte FA, Grumbach MM. Growth and growth hormone. I. Changes in serum level of growth hormone following hypoglycemia in 134 children with growth retardation. Pediatric research 1968; 2:43-63
- Shah A, Stanhope R, Matthew D. Hazards of pharmacological tests of growth hormone secretion in childhood. Bmj 1992; 304:173-174
- Mitchell ML, Sawin CT. Growth hormone response to glucagon in diabetic and nondiabetic persons. Israel journal of medical sciences 1972; 8:867
- Ghigo E, Bellone J, Aimaretti G, Bellone S, Loche S, Cappa M, Bartolotta E, Dammacco F, Camanni F. Reliability of provocative tests to assess growth hormone secretory status. Study in 472 normally growing children. The Journal of clinical endocrinology and metabolism 1996; 81:3323-3327
- Zadik Z, Chalew SA, Gilula Z, Kowarski AA. Reproducibility of growth hormone testing procedures: a comparison between 24-hour integrated concentration and pharmacological stimulation. The Journal of clinical endocrinology and metabolism 1990; 71:1127-1130
- Muller A, Scholz M, Blankenstein O, Binder G, Pfaffle R, Korner A, Kiess W, Heider A, Bidlingmaier M, Thiery J, Kratzsch J. Harmonization of growth hormone measurements with different immunoassays by data adjustment. Clinical chemistry and laboratory medicine : CCLM / FESCC 2011; 49:1135-1142
- Corneli G, Di Somma C, Baldelli R, Rovere S, Gasco V, Croce CG, Grottoli S, Maccario M, Colao A, Lombardi G, Ghigo E, Camanni F, Aimaretti G. The cut-off limits of the GH response to GH-releasing hormone-arginine test related to body mass index. European journal of endocrinology / European Federation of Endocrine Societies 2005; 153:257-264
- Tauber M, Moulin P, Pienkowski C, Jouret B, Rochiccioli P. Growth hormone (GH) retesting and auxological data in 131 GH-deficient patients after completion of treatment. The Journal of clinical endocrinology and metabolism 1997; 82:352-356
- Marin G, Domene HM, Barnes KM, Blackwell BJ, Cassorla FG, Cutler GB, Jr. The effects of estrogen priming and puberty on the growth hormone response to standardized treadmill exercise and arginine-insulin in normal girls and boys. The Journal of clinical endocrinology and metabolism 1994; 79:537-541
- Lazar L, Phillip M. Is sex hormone priming in peripubertal children prior to growth hormone stimulation tests still appropriate? Hormone research in paediatrics 2010; 73:299-302
- Saini S, Hindmarsh PC, Matthews DR, Pringle PJ, Jones J, Preece MA, Brook CG. Reproducibility of 24-hour serum growth hormone profiles in man. Clinical endocrinology 1991; 34:455-462
- Spiliotis BE, August GP, Hung W, Sonis W, Mendelson W, Bercu BB. Growth hormone neurosecretory dysfunction. A treatable cause of short stature. Jama 1984; 251:2223-2230
- Juul A, Skakkebaek NE. Prediction of the outcome of growth hormone provocative testing in short children by measurement of serum levels of insulin-like growth factor I and insulin-like growth factor binding protein 3. The Journal of pediatrics 1997; 130:197-204
- Cianfarani S, Tondinelli T, Spadoni GL, Scire G, Boemi S, Boscherini B. Height velocity and IGF-I assessment in the diagnosis of childhood onset GH insufficiency: do we still need a second GH stimulation test? Clinical endocrinology 2002; 57:161-167
- Triulzi F, Scotti G, di Natale B, Pellini C, Lukezic M, Scognamiglio M, Chiumello G. Evidence of a congenital midline brain anomaly in pituitary dwarfs: a magnetic resonance imaging study in 101 patients. Pediatrics 1994; 93:409-416
- Genovese E, Maghnie M, Beluffi G, Villa A, Sammarchi L, Severi F, Campani R. Hypothalamic-pituitary vascularization in pituitary stalk transection syndrome: is the pituitary stalk really transected? The role of gadolinium-DTPA with spin-echo T1 imaging and turbo-FLASH technique. Pediatric radiology 1997; 27:48-53
- Murray PG, Hague C, Fafoula O, Gleeson H, Patel L, Banerjee I, Raabe AL, Hall CM, Wright NB, Amin R, Clayton PE. Likelihood of persistent GH deficiency into late adolescence: relationship to the presence of an ectopic or normally sited posterior pituitary gland. Clinical endocrinology 2009; 71:215-219
- Collett-Solberg PF, Ambler G, Backeljauw PF, Bidlingmaier M, Biller BMK, Boguszewski MCS, Cheung PT, Choong CSY, Cohen LE, Cohen P, Dauber A, Deal CL, Gong C, Hasegawa Y, Hoffman AR, Hofman PL, Horikawa R, Jorge AAL, Juul A, Kamenicky P, Khadilkar V, Kopchick JJ, Kristrom B, Lopes MLA, Luo X, Miller BS, Misra M, Netchine I, Radovick S, Ranke MB, Rogol AD, Rosenfeld RG, Saenger P, Wit JM, Woelfle J. Diagnosis, Genetics, and Therapy of Short Stature in Children: A Growth Hormone Research Society International Perspective. Horm Res Paediatr 2019; 92:1-14
- Kristrom B, Aronson AS, Dahlgren J, Gustafsson J, Halldin M, Ivarsson SA, Nilsson NO, Svensson J, Tuvemo T, Albertsson-Wikland K. Growth hormone (GH) dosing during catch-up growth guided by individual responsiveness decreases growth response variability in prepubertal children with GH deficiency or idiopathic short stature. The Journal of clinical endocrinology and metabolism 2009; 94:483-490
- Cohen P, Rogol AD, Weng W, Kappelgaard AM, Rosenfeld RG, Germak J, American Norditropin Study G. Efficacy of IGF-based growth hormone (GH) dosing in nonGH-deficient (nonGHD) short stature children with low IGF-I is not related to basal IGF-I levels. Clinical endocrinology 2013; 78:405-414
- Bang P, Ahmed SF, Argente J, Backeljauw P, Bettendorf M, Bona G, Coutant R, Rosenfeld RG, Walenkamp MJ, Savage MO. Identification and management of poor response to growth-promoting therapy in children with short stature. Clinical endocrinology 2012; 77:169-181
- Lal RA, Hoffman AR. Long-Acting Growth Hormone Preparations in the Treatment of Children. Pediatr Endocrinol Rev 2018; 16:162-167
- Johannsson G, Gordon MB, Hojby Rasmussen M, Hakonsson IH, Karges W, Svaerke C, Tahara S, Takano K, Biller BMK. Once-weekly Somapacitan is Effective and Well Tolerated in Adults with GH Deficiency: A Randomized Phase 3 Trial. The Journal of clinical endocrinology and metabolism 2020; 105
- Ranke MB, Lindberg A, Chatelain P, Wilton P, Cutfield W, Albertsson-Wikland K, Price DA. Derivation and validation of a mathematical model for predicting the response to exogenous recombinant human growth hormone (GH) in prepubertal children with idiopathic GH deficiency. KIGS International Board. Kabi Pharmacia International Growth Study. The Journal of clinical endocrinology and metabolism 1999; 84:1174-1183
- Ranke MB, Lindberg A, Albertsson-Wikland K, Wilton P, Price DA, Reiter EO. Increased response, but lower responsiveness, to growth hormone (GH) in very young children (aged 0-3 years) with idiopathic GH Deficiency: analysis of data from KIGS. The Journal of clinical endocrinology and metabolism 2005; 90:1966-1971
- Schonau E, Westermann F, Rauch F, Stabrey A, Wassmer G, Keller E, Bramswig J, Blum WF, German Lilly Growth Response Study G. A new and accurate prediction model for growth response to growth hormone treatment in children with growth hormone deficiency. European journal of endocrinology / European Federation of Endocrine Societies 2001; 144:13-20
- Sudfeld H, Kiese K, Heinecke A, Bramswig JH. Prediction of growth response in prepubertal children treated with growth hormone for idiopathic growth hormone deficiency. Acta Paediatr 2000; 89:34-37
- Dos Santos C, Essioux L, Teinturier C, Tauber M, Goffin V, Bougneres P. A common polymorphism of the growth hormone receptor is associated with increased responsiveness to growth hormone. Nature genetics 2004; 36:720-724
- Renehan AG, Solomon M, Zwahlen M, Morjaria R, Whatmore A, Audi L, Binder G, Blum W, Bougneres P, Santos CD, Carrascosa A, Hokken-Koelega A, Jorge A, Mullis PE, Tauber M, Patel L, Clayton PE. Growth hormone receptor polymorphism and growth hormone therapy response in children: a Bayesian meta-analysis. American journal of epidemiology 2012; 175:867-877
- Clayton P, Chatelain P, Tato L, Yoo HW, Ambler GR, Belgorosky A, Quinteiro S, Deal C, Stevens A, Raelson J, Croteau P, Destenaves B, Olivier C. A pharmacogenomic approach to the treatment of children with GH deficiency or Turner syndrome. European journal of endocrinology / European Federation of Endocrine Societies 2013; 169:277-289
- Stevens A, Clayton P, Tato L, Yoo HW, Rodriguez-Arnao MD, Skorodok J, Ambler GR, Zignani M, Zieschang J, Della Corte G, Destenaves B, Champigneulle A, Raelson J, Chatelain P. Pharmacogenomics of insulin-like growth factor-I generation during GH treatment in children with GH deficiency or Turner syndrome. The pharmacogenomics journal 2013;
- Dauber A, Meng Y, Audi L, Vedantam S, Weaver B, Carrascosa A, Albertsson-Wikland K, Ranke MB, Jorge AAL, Cara J, Wajnrajch MP, Lindberg A, Camacho-Hubner C, Hirschhorn JN. A Genome-Wide Pharmacogenetic Study of Growth Hormone Responsiveness. The Journal of clinical endocrinology and metabolism 2020; 105
- Cacciari E, Zucchini S, Carla G, Pirazzoli P, Cicognani A, Mandini M, Busacca M, Trevisan C. Endocrine function and morphological findings in patients with disorders of the hypothalamo-pituitary area: a study with magnetic resonance. Archives of disease in childhood 1990; 65:1199-1202
- Maghnie M, Lindberg A, Koltowska-Haggstrom M, Ranke MB. Magnetic resonance imaging of CNS in 15,043 children with GH deficiency in KIGS (Pfizer International Growth Database). European journal of endocrinology / European Federation of Endocrine Societies 2013; 168:211-217
- Phillips JA, 3rd, Cogan JD. Genetic basis of endocrine disease. 6. Molecular basis of familial human growth hormone deficiency. The Journal of clinical endocrinology and metabolism 1994; 78:11-16
- Lin SC, Lin CR, Gukovsky I, Lusis AJ, Sawchenko PE, Rosenfeld MG. Molecular basis of the little mouse phenotype and implications for cell type-specific growth. Nature 1993; 364:208-213
- Wajnrajch MP, Gertner JM, Harbison MD, Chua SC, Jr., Leibel RL. Nonsense mutation in the human growth hormone-releasing hormone receptor causes growth failure analogous to the little (lit) mouse. Nature genetics 1996; 12:88-90
- Mullis PE. Genetics of isolated growth hormone deficiency. Journal of clinical research in pediatric endocrinology 2010; 2:52-62
- Alba M, Hall CM, Whatmore AJ, Clayton PE, Price DA, Salvatori R. Variability in anterior pituitary size within members of a family with GH deficiency due to a new splice mutation in the GHRH receptor gene. Clinical endocrinology 2004; 60:470-475
- Alatzoglou KS, Dattani MT. Phenotype-genotype correlations in congenital isolated growth hormone deficiency (IGHD). Indian journal of pediatrics 2012; 79:99-106
- Binder G, Keller E, Mix M, Massa GG, Stokvis-Brantsma WH, Wit JM, Ranke MB. Isolated GH deficiency with dominant inheritance: new mutations, new insights. The Journal of clinical endocrinology and metabolism 2001; 86:3877-3881
- Lee MS, Wajnrajch MP, Kim SS, Plotnick LP, Wang J, Gertner JM, Leibel RL, Dannies PS. Autosomal dominant growth hormone (GH) deficiency type II: the Del32-71-GH deletion mutant suppresses secretion of wild-type GH. Endocrinology 2000; 141:883-890
- Shariat N, Ryther RC, Phillips JA, 3rd, Robinson IC, Patton JG. Rescue of pituitary function in a mouse model of isolated growth hormone deficiency type II by RNA interference. Endocrinology 2008; 149:580-586
- Zhu YL, Conway-Campbell B, Waters MJ, Dannies PS. Prolonged retention after aggregation into secretory granules of human R183H-growth hormone (GH), a mutant that causes autosomal dominant GH deficiency type II. Endocrinology 2002; 143:4243-4248
- Salemi S, Yousefi S, Baltensperger K, Robinson IC, Eble A, Simon D, Czernichow P, Binder G, Sonnet E, Mullis PE. Variability of isolated autosomal dominant GH deficiency (IGHD II): impact of the P89L GH mutation on clinical follow-up and GH secretion. European journal of endocrinology / European Federation of Endocrine Societies 2005; 153:791-802
- Duriez B, Duquesnoy P, Dastot F, Bougneres P, Amselem S, Goossens M. An exon-skipping mutation in the btk gene of a patient with X-linked agammaglobulinemia and isolated growth hormone deficiency. FEBS Lett 1994; 346:165-170
- Argente J, Flores R, Gutierrez-Arumi A, Verma B, Martos-Moreno GA, Cusco I, Oghabian A, Chowen JA, Frilander MJ, Perez-Jurado LA. Defective minor spliceosome mRNA processing results in isolated familial growth hormone deficiency. EMBO molecular medicine 2014; 6:299-306
- Martos-Moreno GA, Travieso-Suarez L, Pozo-Roman J, Munoz-Calvo MT, Chowen JA, Frilander MJ, Perez-Jurado LA, Hawkins FG, Argente J. Response to growth hormone in patients with RNPC3 mutations. EMBO Mol Med 2018; 10
- Bancalari RE, Gregory LC, McCabe MJ, Dattani MT. Pituitary gland development: an update. Endocrine development 2012; 23:1-15
- Dattani MT, Martinez-Barbera JP, Thomas PQ, Brickman JM, Gupta R, Martensson IL, Toresson H, Fox M, Wales JKH, Hindmarsh PC, Krauss S, Beddington RSP, Robinson ICAF. Mutations in the homeobox gene HESX1/Hesx1 associated with septo-optic dysplasia in human and mouse. Nature genetics 1998; 19:125-133
- Brickman JM, Clements M, Tyrell R, McNay D, Woods K, Warner J, Stewart A, Beddington RS, Dattani M. Molecular effects of novel mutations in Hesx1/HESX1 associated with human pituitary disorders. Development (Cambridge, England) 2001; 128:5189-5199
- Reynaud R, Albarel F, Saveanu A, Kaffel N, Castinetti F, Lecomte P, Brauner R, Simonin G, Gaudart J, Carmona E, Enjalbert A, Barlier A, Brue T. Pituitary stalk interruption syndrome in 83 patients: novel HESX1 mutation and severe hormonal prognosis in malformative forms. European journal of endocrinology / European Federation of Endocrine Societies 2011; 164:457-465
- Dateki S, Kosaka K, Hasegawa K, Tanaka H, Azuma N, Yokoya S, Muroya K, Adachi M, Tajima T, Motomura K, Kinoshita E, Moriuchi H, Sato N, Fukami M, Ogata T. Heterozygous orthodenticle homeobox 2 mutations are associated with variable pituitary phenotype. The Journal of clinical endocrinology and metabolism 2010; 95:756-764
- Rizzoti K, Lovell-Badge R. Early development of the pituitary gland: induction and shaping of Rathke's pouch. Reviews in endocrine & metabolic disorders 2005; 6:161-172
- Solomon NM, Nouri S, Warne GL, Lagerstrom-Fermer M, Forrest SM, Thomas PQ. Increased gene dosage at Xq26-q27 is associated with X-linked hypopituitarism. Genomics 2002; 79:553-559
- Laumonnier F, Ronce N, Hamel BC, Thomas P, Lespinasse J, Raynaud M, Paringaux C, Van Bokhoven H, Kalscheuer V, Fryns JP, Chelly J, Moraine C, Briault S. Transcription factor SOX3 is involved in X-linked mental retardation with growth hormone deficiency. American journal of human genetics 2002; 71:1450-1455
- Alatzoglou KS, Kelberman D, Cowell CT, Palmer R, Arnhold IJ, Melo ME, Schnabel D, Grueters A, Dattani MT. Increased transactivation associated with SOX3 polyalanine tract deletion in a patient with hypopituitarism. The Journal of clinical endocrinology and metabolism 2011; 96:E685-690
- Tumer Z, Bach-Holm D. Axenfeld-Rieger syndrome and spectrum of PITX2 and FOXC1 mutations. Eur J Hum Genet 2009; 17:1527-1539
- Bonfig W, Krude H, Schmidt H. A novel mutation of LHX3 is associated with combined pituitary hormone deficiency including ACTH deficiency, sensorineural hearing loss, and short neck-a case report and review of the literature. European journal of pediatrics 2011; 170:1017-1021
- Pfaeffle RW, Savage JJ, Hunter CS, Palme C, Ahlmann M, Kumar P, Bellone J, Schoenau E, Korsch E, Bramswig JH, Stobbe HM, Blum WF, Rhodes SJ. Four novel mutations of the LHX3 gene cause combined pituitary hormone deficiencies with or without limited neck rotation. The Journal of clinical endocrinology and metabolism 2007; 92:1909-1919
- Pfaeffle RW, Hunter CS, Savage JJ, Duran-Prado M, Mullen RD, Neeb ZP, Eiholzer U, Hesse V, Haddad NG, Stobbe HM, Blum WF, Weigel JF, Rhodes SJ. Three novel missense mutations within the LHX4 gene are associated with variable pituitary hormone deficiencies. The Journal of clinical endocrinology and metabolism 2008; 93:1062-1071
- Machinis K, Pantel J, Netchine I, Leger J, Camand OJ, Sobrier ML, Dastot-Le Moal F, Duquesnoy P, Abitbol M, Czernichow P, Amselem S. Syndromic short stature in patients with a germline mutation in the LIM homeobox LHX4. American journal of human genetics 2001; 69:961-968
- Franca MM, Jorge AA, Carvalho LR, Costalonga EF, Vasques GA, Leite CC, Mendonca BB, Arnhold IJ. Novel heterozygous nonsense GLI2 mutations in patients with hypopituitarism and ectopic posterior pituitary lobe without holoprosencephaly. The Journal of clinical endocrinology and metabolism 2010; 95:E384-391
- Roessler E, Du YZ, Mullor JL, Casas E, Allen WP, Gillessen-Kaesbach G, Roeder ER, Ming JE, Ruiz i Altaba A, Muenke M. Loss-of-function mutations in the human GLI2 gene are associated with pituitary anomalies and holoprosencephaly-like features. Proceedings of the National Academy of Sciences of the United States of America 2003; 100:13424-13429
- Raivio T, Avbelj M, McCabe MJ, Romero CJ, Dwyer AA, Tommiska J, Sykiotis GP, Gregory LC, Diaczok D, Tziaferi V, Elting MW, Padidela R, Plummer L, Martin C, Feng B, Zhang C, Zhou QY, Chen H, Mohammadi M, Quinton R, Sidis Y, Radovick S, Dattani MT, Pitteloud N. Genetic overlap in Kallmann syndrome, combined pituitary hormone deficiency, and septo-optic dysplasia. The Journal of clinical endocrinology and metabolism 2012; 97:E694-699
- Turton JP, Mehta A, Raza J, Woods KS, Tiulpakov A, Cassar J, Chong K, Thomas PQ, Eunice M, Ammini AC, Bouloux PM, Starzyk J, Hindmarsh PC, Dattani MT. Mutations within the transcription factor PROP1 are rare in a cohort of patients with sporadic combined pituitary hormone deficiency (CPHD). Clinical endocrinology 2005; 63:10-18
- Tatsumi K, Miyai K, Notomi T, Kaibe K, Amino N, Mizuno Y, Kohno H. Cretinism with combined hormone deficiency caused by a mutation in the PIT1 gene. Nature genetics 1992; 1:56-58
- Sun Y, Bak B, Schoenmakers N, van Trotsenburg AS, Oostdijk W, Voshol P, Cambridge E, White JK, le Tissier P, Gharavy SN, Martinez-Barbera JP, Stokvis-Brantsma WH, Vulsma T, Kempers MJ, Persani L, Campi I, Bonomi M, Beck-Peccoz P, Zhu H, Davis TM, Hokken-Koelega AC, Del Blanco DG, Rangasami JJ, Ruivenkamp CA, Laros JF, Kriek M, Kant SG, Bosch CA, Biermasz NR, Appelman-Dijkstra NM, Corssmit EP, Hovens GC, Pereira AM, den Dunnen JT, Wade MG, Breuning MH, Hennekam RC, Chatterjee K, Dattani MT, Wit JM, Bernard DJ. Loss-of-function mutations in IGSF1 cause an X-linked syndrome of central hypothyroidism and testicular enlargement. Nature genetics 2012; 44:1375-1381
- Joustra SD, Schoenmakers N, Persani L, Campi I, Bonomi M, Radetti G, Beck-Peccoz P, Zhu H, Davis TM, Sun Y, Corssmit EP, Appelman-Dijkstra NM, Heinen CA, Pereira AM, Varewijck AJ, Janssen JA, Endert E, Hennekam RC, Lombardi MP, Mannens MM, Bak B, Bernard DJ, Breuning MH, Chatterjee K, Dattani MT, Oostdijk W, Biermasz NR, Wit JM, van Trotsenburg AS. The IGSF1 deficiency syndrome: characteristics of male and female patients. The Journal of clinical endocrinology and metabolism 2013; 98:4942-4952
- Joustra SD, Heinen CA, Schoenmakers N, Bonomi M, Ballieux BE, Turgeon MO, Bernard DJ, Fliers E, van Trotsenburg AS, Losekoot M, Persani L, Wit JM, Biermasz NR, Pereira AM, Oostdijk W, Group ICC. IGSF1 Deficiency: Lessons From an Extensive Case Series and Recommendations for Clinical Management. The Journal of clinical endocrinology and metabolism 2016; 101:1627-1636
- Howard SR, Guasti L, Ruiz-Babot G, Mancini A, David A, Storr HL, Metherell LA, Sternberg MJ, Cabrera CP, Warren HR, Barnes MR, Quinton R, de Roux N, Young J, Guiochon-Mantel A, Wehkalampi K, Andre V, Gothilf Y, Cariboni A, Dunkel L. IGSF10 mutations dysregulate gonadotropin-releasing hormone neuronal migration resulting in delayed puberty. EMBO molecular medicine 2016; 8:626-642
- Webb EA, AlMutair A, Kelberman D, Bacchelli C, Chanudet E, Lescai F, Andoniadou CL, Banyan A, Alsawaid A, Alrifai MT, Alahmesh MA, Balwi M, Mousavy-Gharavy SN, Lukovic B, Burke D, McCabe MJ, Kasia T, Kleta R, Stupka E, Beales PL, Thompson DA, Chong WK, Alkuraya FS, Martinez-Barbera JP, Sowden JC, Dattani MT. ARNT2 mutation causes hypopituitarism, post-natal microcephaly, visual and renal anomalies. Brain : a journal of neurology 2013; 136:3096-3105
- Brachet C, Kozhemyakina EA, Boros E, Heinrichs C, Balikova I, Soblet J, Smits G, Vilain C, Mathers PH. Truncating RAX Mutations: Anophthalmia, Hypopituitarism, Diabetes Insipidus, and Cleft Palate in Mice and Men. The Journal of clinical endocrinology and metabolism 2019; 104:2925-2930
- Tahoun M, Chandler JC, Ashton E, Haston S, Hannan A, Kim JS, D'Arco F, Bockenhauer D, Anderson G, Lin MH, Marzouk S, Saied MH, Miner JH, Dattani MT, Waters AM. Mutations in LAMB2 Are Associated With Albuminuria and Optic Nerve Hypoplasia With Hypopituitarism. The Journal of clinical endocrinology and metabolism 2020; 105
- Adly N, Alhashem A, Ammari A, Alkuraya FS. Ciliary genes TBC1D32/C6orf170 and SCLT1 are mutated in patients with OFD type IX. Hum Mutat 2014; 35:36-40
- Hietamaki J, Gregory LC, Ayoub S, Iivonen AP, Vaaralahti K, Liu X, Brandstack N, Buckton AJ, Laine T, Kansakoski J, Hero M, Miettinen PJ, Varjosalo M, Wakeling E, Dattani MT, Raivio T. Loss-of-Function Variants in TBC1D32 Underlie Syndromic Hypopituitarism. The Journal of clinical endocrinology and metabolism 2020; 105
- Lucas-Herald AK, Kinning E, Iida A, Wang Z, Miyake N, Ikegawa S, McNeilly J, Ahmed SF. A case of functional growth hormone deficiency and early growth retardation in a child with IFT172 mutations. The Journal of clinical endocrinology and metabolism 2015; 100:1221-1224
- Gregory LC, Shah P, Sanner JRF, Arancibia M, Hurst J, Jones WD, Spoudeas H, Le Quesne Stabej P, Williams HJ, Ocaka LA, Loureiro C, Martinez-Aguayo A, Dattani MT. Mutations in MAGEL2 and L1CAM Are Associated With Congenital Hypopituitarism and Arthrogryposis. The Journal of clinical endocrinology and metabolism 2019; 104:5737-5750
- Gregory LC, Ferreira CB, Young-Baird SK, Williams HJ, Harakalova M, van Haaften G, Rahman SA, Gaston-Massuet C, Kelberman D, Gosgene, Qasim W, Camper SA, Dever TE, Shah P, Robinson I, Dattani MT. Impaired EIF2S3 function associated with a novel phenotype of X-linked hypopituitarism with glucose dysregulation. EBioMedicine 2019; 42:470-480
- Vajravelu ME, Chai J, Krock B, Baker S, Langdon D, Alter C, De Leon DD. Congenital Hyperinsulinism and Hypopituitarism Attributable to a Mutation in FOXA2. The Journal of clinical endocrinology and metabolism 2018; 103:1042-1047
- Bashamboo A, Bignon-Topalovic J, Rouba H, McElreavey K, Brauner R. A Nonsense Mutation in the Hedgehog Receptor CDON Associated With Pituitary Stalk Interruption Syndrome. The Journal of clinical endocrinology and metabolism 2016; 101:12-15
- Karaca E, Buyukkaya R, Pehlivan D, Charng WL, Yaykasli KO, Bayram Y, Gambin T, Withers M, Atik MM, Arslanoglu I, Bolu S, Erdin S, Buyukkaya A, Yaykasli E, Jhangiani SN, Muzny DM, Gibbs RA, Lupski JR. Whole-exome sequencing identifies homozygous GPR161 mutation in a family with pituitary stalk interruption syndrome. The Journal of clinical endocrinology and metabolism 2015; 100:E140-147
- Bashamboo A, Bignon-Topalovic J, Moussi N, McElreavey K, Brauner R. Mutations in the Human ROBO1 Gene in Pituitary Stalk Interruption Syndrome. The Journal of clinical endocrinology and metabolism 2017; 102:2401-2406
- Kowarski AA, Schneider J, Ben-Galim E, Weldon VV, Daughaday WH. Growth failure with normal serum RIA-GH and low somatomedin activity: somatomedin restoration and growth acceleration after exogenous GH. The Journal of clinical endocrinology and metabolism 1978; 47:461-464
- Takahashi Y, Shirono H, Arisaka O, Takahashi K, Yagi T, Koga J, Kaji H, Okimura Y, Abe H, Tanaka T, Chihara K. Biologically inactive growth hormone caused by an amino acid substitution. J Clin Invest 1997; 100:1159-1165
- Takahashi Y, Kaji H, Okimura Y, Goji K, Abe H, Chihara K. Short stature caused by a mutant growth hormone with an antagonistic effect. Endocrine journal 1996; 43 Suppl:S27-32
- Takahashi Y, Kaji H, Okimura Y, Goji K, Abe H, Chihara K. Brief report: short stature caused by a mutant growth hormone. The New England journal of medicine 1996; 334:432-436
- Petkovic V, Besson A, Thevis M, Lochmatter D, Eble A, Fluck CE, Mullis PE. Evaluation of the biological activity of a growth hormone (GH) mutant (R77C) and its impact on GH responsiveness and stature. The Journal of clinical endocrinology and metabolism 2007; 92:2893-2901
- Petkovic V, Thevis M, Lochmatter D, Besson A, Eble A, Fluck CE, Mullis PE. GH mutant (R77C) in a pedigree presenting with the delay of growth and pubertal development: structural analysis of the mutant and evaluation of the biological activity. European journal of endocrinology / European Federation of Endocrine Societies 2007; 157 Suppl 1:S67-74
- Besson A, Salemi S, Deladoey J, Vuissoz JM, Eble A, Bidlingmaier M, Burgi S, Honegger U, Fluck C, Mullis PE. Short stature caused by a biologically inactive mutant growth hormone (GH-C53S). The Journal of clinical endocrinology and metabolism 2005; 90:2493-2499
- Godowski PJ, Leung DW, Meacham LR, Galgani JP, Hellmiss R, Keret R, Rotwein PS, Parks JS, Laron Z, Wood WI. Characterization of the human growth hormone receptor gene and demonstration of a partial gene deletion in two patients with Laron-type dwarfism. Proceedings of the National Academy of Sciences of the United States of America 1989; 86:8083-8087
- Laron Z, Pertzelan A, Mannheimer S. Genetic pituitary dwarfism with high serum concentation of growth hormone--a new inborn error of metabolism? Israel journal of medical sciences 1966; 2:152-155
- David A, Hwa V, Metherell LA, Netchine I, Camacho-Hubner C, Clark AJ, Rosenfeld RG, Savage MO. Evidence for a continuum of genetic, phenotypic, and biochemical abnormalities in children with growth hormone insensitivity. Endocrine reviews 2011; 32:472-497
- Ayling RM, Ross R, Towner P, Von Laue S, Finidori J, Moutoussamy S, Buchanan CR, Clayton PE, Norman MR. A dominant-negative mutation of the growth hormone receptor causes familial short stature. Nature genetics 1997; 16:13-14
- Coutant R, Dorr HG, Gleeson H, Argente J. Diagnosis of endocrine disease: limitations of the IGF1 generation test in children with short stature. European journal of endocrinology / European Federation of Endocrine Societies 2012; 166:351-357
- Buckway CK, Guevara-Aguirre J, Pratt KL, Burren CP, Rosenfeld RG. The IGF-I generation test revisited: a marker of GH sensitivity. The Journal of clinical endocrinology and metabolism 2001; 86:5176-5183
- Blum WF, Cotterill AM, Postel-Vinay MC, Ranke MB, Savage MO, Wilton P. Improvement of diagnostic criteria in growth hormone insensitivity syndrome: solutions and pitfalls. Pharmacia Study Group on Insulin-like Growth Factor I Treatment in Growth Hormone Insensitivity Syndromes. Acta Paediatr Suppl 1994; 399:117-124
- Chernausek SD, Backeljauw PF, Frane J, Kuntze J, Underwood LE, Group GHISC. Long-term treatment with recombinant insulin-like growth factor (IGF)-I in children with severe IGF-I deficiency due to growth hormone insensitivity. The Journal of clinical endocrinology and metabolism 2007; 92:902-910
- Backeljauw PF, Kuntze J, Frane J, Calikoglu AS, Chernausek SD. Adult and near-adult height in patients with severe insulin-like growth factor-I deficiency after long-term therapy with recombinant human insulin-like growth factor-I. Hormone research in paediatrics 2013; 80:47-56
- Tonella P, Fluck CE, Mullis PE. Insulin-like growth factor-I treatment in primary growth hormone insensitivity: effect of recombinant human IGF-I (rhIGF-I) and rhIGF-I/rhIGF-binding protein-3 complex. Hormone research in paediatrics 2010; 73:140-147
- Chapgier A, Wynn RF, Jouanguy E, Filipe-Santos O, Zhang S, Feinberg J, Hawkins K, Casanova JL, Arkwright PD. Human complete Stat-1 deficiency is associated with defective type I and II IFN responses in vitro but immunity to some low virulence viruses in vivo. Journal of immunology 2006; 176:5078-5083
- Kofoed EM, Hwa V, Little B, Woods KA, Buckway CK, Tsubaki J, Pratt KL, Bezrodnik L, Jasper H, Tepper A, Heinrich JJ, Rosenfeld RG. Growth hormone insensitivity associated with a STAT5b mutation. The New England journal of medicine 2003; 349:1139-1147
- Bernasconi A, Marino R, Ribas A, Rossi J, Ciaccio M, Oleastro M, Ornani A, Paz R, Rivarola MA, Zelazko M, Belgorosky A. Characterization of immunodeficiency in a patient with growth hormone insensitivity secondary to a novel STAT5b gene mutation. Pediatrics 2006; 118:e1584-1592
- Hwa V, Little B, Adiyaman P, Kofoed EM, Pratt KL, Ocal G, Berberoglu M, Rosenfeld RG. Severe growth hormone insensitivity resulting from total absence of signal transducer and activator of transcription 5b. The Journal of clinical endocrinology and metabolism 2005; 90:4260-4266
- Vidarsdottir S, Walenkamp MJ, Pereira AM, Karperien M, van Doorn J, van Duyvenvoorde HA, White S, Breuning MH, Roelfsema F, Kruithof MF, van Dissel J, Janssen R, Wit JM, Romijn JA. Clinical and biochemical characteristics of a male patient with a novel homozygous STAT5b mutation. The Journal of clinical endocrinology and metabolism 2006; 91:3482-3485
- Hwa V, Nadeau K, Wit JM, Rosenfeld RG. STAT5b deficiency: lessons from STAT5b gene mutations. Best Pract Res Clin Endocrinol Metab 2011; 25:61-75
- Pugliese-Pires PN, Tonelli CA, Dora JM, Silva PC, Czepielewski M, Simoni G, Arnhold IJ, Jorge AA. A novel STAT5B mutation causing GH insensitivity syndrome associated with hyperprolactinemia and immune dysfunction in two male siblings. European journal of endocrinology / European Federation of Endocrine Societies 2010; 163:349-355
- Hwa V, Camacho-Hubner C, Little BM, David A, Metherell LA, El-Khatib N, Savage MO, Rosenfeld RG. Growth hormone insensitivity and severe short stature in siblings: a novel mutation at the exon 13-intron 13 junction of the STAT5b gene. Horm Res 2007; 68:218-224
- Klammt J, Neumann D, Gevers EF, Andrew SF, Schwartz ID, Rockstroh D, Colombo R, Sanchez MA, Vokurkova D, Kowalczyk J, Metherell LA, Rosenfeld RG, Pfaffle R, Dattani MT, Dauber A, Hwa V. Dominant-negative STAT5B mutations cause growth hormone insensitivity with short stature and mild immune dysregulation. Nat Commun 2018; 9:2105
- Suwanichkul A, Boisclair YR, Olney RC, Durham SK, Powell DR. Conservation of a growth hormone-responsive promoter element in the human and mouse acid-labile subunit genes. Endocrinology 2000; 141:833-838
- Domene HM, Bengolea SV, Martinez AS, Ropelato MG, Pennisi P, Scaglia P, Heinrich JJ, Jasper HG. Deficiency of the circulating insulin-like growth factor system associated with inactivation of the acid-labile subunit gene. The New England journal of medicine 2004; 350:570-577
- Domene HM, Hwa V, Argente J, Wit JM, Camacho-Hubner C, Jasper HG, Pozo J, van Duyvenvoorde HA, Yakar S, Fofanova-Gambetti OV, Rosenfeld RG. Human acid-labile subunit deficiency: clinical, endocrine and metabolic consequences. Horm Res 2009; 72:129-141
- Fuqua JS, Derr M, Rosenfeld RG, Hwa V. Identification of a novel heterozygous IGF1 splicing mutation in a large kindred with familial short stature. Hormone research in paediatrics 2012; 78:59-66
- Walenkamp MJ, Karperien M, Pereira AM, Hilhorst-Hofstee Y, van Doorn J, Chen JW, Mohan S, Denley A, Forbes B, van Duyvenvoorde HA, van Thiel SW, Sluimers CA, Bax JJ, de Laat JA, Breuning MB, Romijn JA, Wit JM. Homozygous and heterozygous expression of a novel insulin-like growth factor-I mutation. The Journal of clinical endocrinology and metabolism 2005; 90:2855-2864
- Bonapace G, Concolino D, Formicola S, Strisciuglio P. A novel mutation in a patient with insulin-like growth factor 1 (IGF1) deficiency. J Med Genet 2003; 40:913-917
- Netchine I, Azzi S, Houang M, Seurin D, Perin L, Ricort JM, Daubas C, Legay C, Mester J, Herich R, Godeau F, Le Bouc Y. Partial primary deficiency of insulin-like growth factor (IGF)-I activity associated with IGF1 mutation demonstrates its critical role in growth and brain development. The Journal of clinical endocrinology and metabolism 2009; 94:3913-3921
- Klammt J, Kiess W, Pfaffle R. IGF1R mutations as cause of SGA. Best Pract Res Clin Endocrinol Metab 2011; 25:191-206
- Abuzzahab MJ, Schneider A, Goddard A, Grigorescu F, Lautier C, Keller E, Kiess W, Klammt J, Kratzsch J, Osgood D, Pfaffle R, Raile K, Seidel B, Smith RJ, Chernausek SD. IGF-I receptor mutations resulting in intrauterine and postnatal growth retardation. The New England journal of medicine 2003; 349:2211-2222
- Wallborn T, Wuller S, Klammt J, Kruis T, Kratzsch J, Schmidt G, Schlicke M, Muller E, van de Leur HS, Kiess W, Pfaffle R. A heterozygous mutation of the insulin-like growth factor-I receptor causes retention of the nascent protein in the endoplasmic reticulum and results in intrauterine and postnatal growth retardation. The Journal of clinical endocrinology and metabolism 2010; 95:2316-2324
- Kruis T, Klammt J, Galli-Tsinopoulou A, Wallborn T, Schlicke M, Muller E, Kratzsch J, Korner A, Odeh R, Kiess W, Pfaffle R. Heterozygous mutation within a kinase-conserved motif of the insulin-like growth factor I receptor causes intrauterine and postnatal growth retardation. The Journal of clinical endocrinology and metabolism 2010; 95:1137-1142
- Choi JH, Kang M, Kim GH, Hong M, Jin HY, Lee BH, Park JY, Lee SM, Seo EJ, Yoo HW. Clinical and functional characteristics of a novel heterozygous mutation of the IGF1R gene and IGF1R haploinsufficiency due to terminal 15q26.2->qter deletion in patients with intrauterine growth retardation and postnatal catch-up growth failure. The Journal of clinical endocrinology and metabolism 2011; 96:E130-134
- Fang P, Schwartz ID, Johnson BD, Derr MA, Roberts CT, Jr., Hwa V, Rosenfeld RG. Familial short stature caused by haploinsufficiency of the insulin-like growth factor i receptor due to nonsense-mediated messenger ribonucleic acid decay. The Journal of clinical endocrinology and metabolism 2009; 94:1740-1747
- Inagaki K, Tiulpakov A, Rubtsov P, Sverdlova P, Peterkova V, Yakar S, Terekhov S, LeRoith D. A familial insulin-like growth factor-I receptor mutant leads to short stature: clinical and biochemical characterization. The Journal of clinical endocrinology and metabolism 2007; 92:1542-1548
- Roback EW, Barakat AJ, Dev VG, Mbikay M, Chretien M, Butler MG. An infant with deletion of the distal long arm of chromosome 15 (q26.1----qter) and loss of insulin-like growth factor 1 receptor gene. American journal of medical genetics 1991; 38:74-79
- Kant SG, Kriek M, Walenkamp MJ, Hansson KB, van Rhijn A, Clayton-Smith J, Wit JM, Breuning MH. Tall stature and duplication of the insulin-like growth factor I receptor gene. European journal of medical genetics 2007; 50:1-10
- Klaassens M, Galjaard RJ, Scott DA, Bruggenwirth HT, van Opstal D, Fox MV, Higgins RR, Cohen-Overbeek TE, Schoonderwaldt EM, Lee B, Tibboel D, de Klein A. Prenatal detection and outcome of congenital diaphragmatic hernia (CDH) associated with deletion of chromosome 15q26: two patients and review of the literature. Am J Med Genet A 2007; 143A:2204-2212
- Ester WA, van Duyvenvoorde HA, de Wit CC, Broekman AJ, Ruivenkamp CA, Govaerts LC, Wit JM, Hokken-Koelega AC, Losekoot M. Two short children born small for gestational age with insulin-like growth factor 1 receptor haploinsufficiency illustrate the heterogeneity of its phenotype. The Journal of clinical endocrinology and metabolism 2009; 94:4717-4727
- Dauber A, Munoz-Calvo MT, Barrios V, Domene HM, Kloverpris S, Serra-Juhe C, Desikan V, Pozo J, Muzumdar R, Martos-Moreno GA, Hawkins F, Jasper HG, Conover CA, Frystyk J, Yakar S, Hwa V, Chowen JA, Oxvig C, Rosenfeld RG, Perez-Jurado LA, Argente J. Mutations in pregnancy-associated plasma protein A2 cause short stature due to low IGF-I availability. EMBO molecular medicine 2016; 8:363-374
- Teresa Munoz-Calvo M, Barrios V, Pozo J, Chowen JA, Martos-Moreno GA, Hawkins F, Dauber A, Domene HM, Yakar S, Rosenfeld RG, Perez-Jurado LA, Oxvig C, Frystyk J, Argente J. Treatment with recombinant human insulin-like growth factor-I improves growth in patients with PAPP-A2 deficiency. The Journal of clinical endocrinology and metabolism 2016:jc20162751
- Cabrera Salcedo CH, V.; Tyzinski, L;,Andrew, M.; Wasserman, H.; Backeljauw, P.; Dauber, A. 2016 PAPP-A2 Gene Mutation Effects on Glucose Metabolism and Bone Mineral Density and Response to Therapy with Recombinant Human IGF-I. ESPE; 2016; Paris.
- Garre ML, Cama A. Craniopharyngioma: modern concepts in pathogenesis and treatment. Current opinion in pediatrics 2007; 19:471-479
- Holsken A, Buchfelder M, Fahlbusch R, Blumcke I, Buslei R. Tumour cell migration in adamantinomatous craniopharyngiomas is promoted by activated Wnt-signalling. Acta neuropathologica 2010; 119:631-639
- Schroeder JW, Vezina LG. Pediatric sellar and suprasellar lesions. Pediatric radiology 2011; 41:287-298; quiz 404-285
- Bunin GR, Surawicz TS, Witman PA, Preston-Martin S, Davis F, Bruner JM. The descriptive epidemiology of craniopharyngioma. Neurosurgical focus 1997; 3:e1
- Muller HL. Childhood craniopharyngioma--current concepts in diagnosis, therapy and follow-up. Nature reviews Endocrinology 2010; 6:609-618
- Muller HL. Childhood craniopharyngioma. Pituitary 2013; 16:56-67
- Muller HL. Consequences of craniopharyngioma surgery in children. The Journal of clinical endocrinology and metabolism 2011; 96:1981-1991
- Visser J, Hukin J, Sargent M, Steinbok P, Goddard K, Fryer C. Late mortality in pediatric patients with craniopharyngioma. J Neurooncol 2010; 100:105-111
- Steno J, Bizik I, Steno A, Matejcik V. Craniopharyngiomas in children: how radical should the surgeon be? Child's nervous system : ChNS : official journal of the International Society for Pediatric Neurosurgery 2011; 27:41-54
- Muller HL, Gebhardt U, Schroder S, Pohl F, Kortmann RD, Faldum A, Zwiener I, Warmuth-Metz M, Pietsch T, Calaminus G, Kolb R, Wiegand C, Sorensen N, study committee of K. Analyses of treatment variables for patients with childhood craniopharyngioma--results of the multicenter prospective trial KRANIOPHARYNGEOM 2000 after three years of follow-up. Hormone research in paediatrics 2010; 73:175-180
- Becker G, Kortmann RD, Skalej M, Bamberg M. The role of radiotherapy in the treatment of craniopharyngioma--indications, results, side effects. Frontiers of radiation therapy and oncology 1999; 33:100-113
- Price DA, Wilton P, Jonsson P, Albertsson-Wikland K, Chatelain P, Cutfield W, Ranke MB. Efficacy and safety of growth hormone treatment in children with prior craniopharyngioma: An analysis of the Pharmacia and Upjohn International Growth Database (KIGS) from 1988 to 1996. Hormone Research 1998; 49:91-97
- Olsson DS, Buchfelder M, Wiendieck K, Kremenevskaja N, Bengtsson BA, Jakobsson KE, Jarfelt M, Johannsson G, Nilsson AG. Tumour recurrence and enlargement in patients with craniopharyngioma with and without GH replacement therapy during more than 10 years of follow-up. European journal of endocrinology / European Federation of Endocrine Societies 2012; 166:1061-1068
- Taguchi T, Takao T, Iwasaki Y, Pooh K, Okazaki M, Hashimoto K, Terada Y. Rapid recurrence of craniopharyngioma following recombinant human growth hormone replacement. J Neurooncol 2010; 100:321-322
- Lafferty AR, Chrousos GP. Pituitary tumors in children and adolescents. The Journal of clinical endocrinology and metabolism 1999; 84:4317-4323
- Steele CA, MacFarlane IA, Blair J, Cuthbertson DJ, Didi M, Mallucci C, Javadpour M, Daousi C. Pituitary adenomas in childhood, adolescence and young adulthood: presentation, management, endocrine and metabolic outcomes. European journal of endocrinology / European Federation of Endocrine Societies 2010; 163:515-522
- Chandrasekharappa SC, Guru SC, Manickam P, Olufemi SE, Collins FS, EmmertBuck MR, Debelenko LV, Zhuang ZP, Lubensky IA, Liotta LA, Crabtree JS, Wang YP, Roe BA, Weisemann J, Boguski MS, Agarwal SK, Kester MB, Kim YS, Heppner C, Dong QH, Spiegel AM, Burns AL, Marx SJ. Positional cloning of the gene for multiple endocrine neoplasia-type 1. Science 1997; 276:404-407
- Vierimaa O, Georgitsi M, Lehtonen R, Vahteristo P, Kokko A, Raitila A, Tuppurainen K, Ebeling TM, Salmela PI, Paschke R, Gundogdu S, De Menis E, Makinen MJ, Launonen V, Karhu A, Aaltonen LA. Pituitary adenoma predisposition caused by germline mutations in the AIP gene. Science 2006; 312:1228-1230
- Cnossen MH, Stam EN, Cooiman LC, Simonsz HJ, Stroink H, Oranje AP, Halley DJ, de Goede-Bolder A, Niermeijer MF, de Muinck Keizer-Schrama SM. Endocrinologic disorders and optic pathway gliomas in children with neurofibromatosis type 1. Pediatrics 1997; 100:667-670
- Collet-Solberg PF, Sernyak H, Satin-Smith M, Katz LL, Sutton L, Molloy P, Moshang T, Jr. Endocrine outcome in long-term survivors of low-grade hypothalamic/chiasmatic glioma. Clinical endocrinology 1997; 47:79-85
- Brauner R, Malandry F, Rappaport R, Zucker JM, Kalifa C, Pierre-Kahn A, Bataini P, Dufier JL. Growth and endocrine disorders in optic glioma. European journal of pediatrics 1990; 149:825-828
- Kim RJ, Janss A, Shanis D, Homan S, Moshang T, Jr. Adult heights attained by children with hypothalamic/chiasmatic glioma treated with growth hormone. The Journal of clinical endocrinology and metabolism 2004; 89:4999-5002
- Minkov M. Multisystem Langerhans cell histiocytosis in children: current treatment and future directions. Paediatric drugs 2011; 13:75-86
- Clayton PE, Shalet SM. Dose dependency of time of onset of radiation-induced growth hormone deficiency. The Journal of pediatrics 1991; 118:226-228
- Kirk JA, Raghupathy P, Stevens MM, Cowell CT, Menser MA, Bergin M, Tink A, Vines RH, Silink M. Growth failure and growth-hormone deficiency after treatment for acute lymphoblastic leukaemia. Lancet 1987; 1:190-193
- Ogilvy-Stuart AL, Clark DJ, Wallace WH, Gibson BE, Stevens RF, Shalet SM, Donaldson MD. Endocrine deficit after fractionated total body irradiation. Archives of disease in childhood 1992; 67:1107-1110
- Littley MD, Shalet SM, Beardwell CG, Ahmed SR, Applegate G, Sutton ML. Hypopituitarism following external radiotherapy for pituitary tumours in adults. The Quarterly journal of medicine 1989; 70:145-160
- Jadresic A, Jimenez LE, Joplin GF. Long-term effect of 90Y pituitary implantation in acromegaly. Acta endocrinologica 1987; 115:301-306
- Darzy KH, Shalet SM. Circadian and stimulated thyrotropin secretion in cranially irradiated adult cancer survivors. J Clin Endocr Metab 2005; 90:6490-6497
- Achermann JC, Brook CG, Hindmarsh PC. The GH response to low-dose bolus growth hormone-releasing hormone (GHRH(1-29)NH2) is attenuated in patients with longstanding post-irradiation GH insufficiency. European journal of endocrinology / European Federation of Endocrine Societies 2000; 142:359-364
- Robinson IC, Fairhall KM, Hendry JH, Shalet SM. Differential radiosensitivity of hypothalamo-pituitary function in the young adult rat. The Journal of endocrinology 2001; 169:519-526
- Hochberg Z, Kuten A, Hertz P, Tatcher M, Kedar A, Benderly A. The effect of single-dose radiation on cell survival and growth hormone secretion by rat anterior pituitary cells. Radiation research 1983; 94:508-512
- Duffner PK, Cohen ME, Voorhess ML, MacGillivray MH, Brecher ML, Panahon A, Gilani BB. Long-term effects of cranial irradiation on endocrine function in children with brain tumors. A prospective study. Cancer 1985; 56:2189-2193
- Samaan NA, Vieto R, Schultz PN, Maor M, Meoz RT, Sampiere VA, Cangir A, Ried HL, Jesse RH, Jr. Hypothalamic, pituitary and thyroid dysfunction after radiotherapy to the head and neck. International journal of radiation oncology, biology, physics 1982; 8:1857-1867
- Chen MS, Lin FJ, Huang MJ, Wang PW, Tang S, Leung WM, Leung W. Prospective hormone study of hypothalamic-pituitary function in patients with nasopharyngeal carcinoma after high dose irradiation. Japanese journal of clinical oncology 1989; 19:265-270
- Spoudeas HA, Hindmarsh PC, Matthews DR, Brook CG. Evolution of growth hormone neurosecretory disturbance after cranial irradiation for childhood brain tumours: a prospective study. The Journal of endocrinology 1996; 150:329-342
- Chrousos GP, Poplack D, Brown T, O'Neill D, Schwade J, Bercu BB. Effects of cranial radiation on hypothalamic-adenohypophyseal function: abnormal growth hormone secretory dynamics. The Journal of clinical endocrinology and metabolism 1982; 54:1135-1139
- Blatt J, Bercu BB, Gillin JC, Mendelson WB, Poplack DG. Reduced pulsatile growth hormone secretion in children after therapy for acute lymphoblastic leukemia. The Journal of pediatrics 1984; 104:182-186
- Brauner R, Rappaport R, Prevot C, Czernichow P, Zucker JM, Bataini P, Lemerle J, Sarrazin D, Guyda HJ. A prospective study of the development of growth hormone deficiency in children given cranial irradiation, and its relation to statural growth. The Journal of clinical endocrinology and metabolism 1989; 68:346-351
- Tillmann V, Buckler JM, Kibirige MS, Price DA, Shalet SM, Wales JK, Addison MG, Gill MS, Whatmore AJ, Clayton PE. Biochemical tests in the diagnosis of childhood growth hormone deficiency. The Journal of clinical endocrinology and metabolism 1997; 82:531-535
- Sklar C, Sarafoglou K, Whittam E. Efficacy of insulin-like growth factor binding protein 3 in predicting the growth hormone response to provocative testing in children treated with cranial irradiation. Acta endocrinologica 1993; 129:511-515
- Tillmann V, Shalet SM, Price DA, Wales JK, Pennells L, Soden J, Gill MS, Whatmore AJ, Clayton PE. Serum insulin-like growth factor-I, IGF binding protein-3 and IGFBP-3 protease activity after cranial irradiation. Horm Res 1998; 50:71-77
- Achermann JC, Hindmarsh PC, Brook CG. The relationship between the growth hormone and insulin-like growth factor axis in long-term survivors of childhood brain tumours. Clinical endocrinology 1998; 49:639-645
- Oberfield SE, Allen JC, Pollack J, New MI, Levine LS. Long-term endocrine sequelae after treatment of medulloblastoma: prospective study of growth and thyroid function. The Journal of pediatrics 1986; 108:219-223
- Shalet SM, Gibson B, Swindell R, Pearson D. Effect of spinal irradiation on growth. Archives of disease in childhood 1987; 62:461-464
- Clayton PE, Shalet SM, Price DA. Growth response to growth hormone therapy following craniospinal irradiation. European journal of pediatrics 1988; 147:597-601
- Clayton PE, Shalet SM, Price DA. Growth response to growth hormone therapy following cranial irradiation. European journal of pediatrics 1988; 147:593-596
- Sulmont V, Brauner R, Fontoura M, Rappaport R. Response to growth hormone treatment and final height after cranial or craniospinal irradiation. Acta Paediatr Scand 1990; 79:542-549
- Yakar S, Kim H, Zhao H, Toyoshima Y, Pennisi P, Gavrilova O, Leroith D. The growth hormone-insulin like growth factor axis revisited: lessons from IGF-1 and IGF-1 receptor gene targeting. Pediatric nephrology 2005; 20:251-254
- Clayton PE, Banerjee I, Murray PG, Renehan AG. Growth hormone, the insulin-like growth factor axis, insulin and cancer risk. Nature reviews Endocrinology 2011; 7:11-24
- Chen B, Liu S, Xu W, Wang X, Zhao W, Wu J. IGF-I and IGFBP-3 and the risk of lung cancer: a meta-analysis based on nested case-control studies. Journal of experimental & clinical cancer research : CR 2009; 28:89
- Rinaldi S, Cleveland R, Norat T, Biessy C, Rohrmann S, Linseisen J, Boeing H, Pischon T, Panico S, Agnoli C, Palli D, Tumino R, Vineis P, Peeters PH, van Gils CH, Bueno-de-Mesquita BH, Vrieling A, Allen NE, Roddam A, Bingham S, Khaw KT, Manjer J, Borgquist S, Dumeaux V, Torhild Gram I, Lund E, Trichopoulou A, Makrygiannis G, Benetou V, Molina E, Donate Suarez I, Barricarte Gurrea A, Gonzalez CA, Tormo MJ, Altzibar JM, Olsen A, Tjonneland A, Gronbaek H, Overvad K, Clavel-Chapelon F, Boutron-Ruault MC, Morois S, Slimani N, Boffetta P, Jenab M, Riboli E, Kaaks R. Serum levels of IGF-I, IGFBP-3 and colorectal cancer risk: results from the EPIC cohort, plus a meta-analysis of prospective studies. Int J Cancer 2010; 126:1702-1715
- Roddam AW, Allen NE, Appleby P, Key TJ, Ferrucci L, Carter HB, Metter EJ, Chen C, Weiss NS, Fitzpatrick A, Hsing AW, Lacey JV, Jr., Helzlsouer K, Rinaldi S, Riboli E, Kaaks R, Janssen JA, Wildhagen MF, Schroder FH, Platz EA, Pollak M, Giovannucci E, Schaefer C, Quesenberry CP, Jr., Vogelman JH, Severi G, English DR, Giles GG, Stattin P, Hallmans G, Johansson M, Chan JM, Gann P, Oliver SE, Holly JM, Donovan J, Meyer F, Bairati I, Galan P. Insulin-like growth factors, their binding proteins, and prostate cancer risk: analysis of individual patient data from 12 prospective studies. Annals of internal medicine 2008; 149:461-471, W483-468
- Endogenous H, Breast Cancer Collaborative G, Key TJ, Appleby PN, Reeves GK, Roddam AW. Insulin-like growth factor 1 (IGF1), IGF binding protein 3 (IGFBP3), and breast cancer risk: pooled individual data analysis of 17 prospective studies. The lancet oncology 2010; 11:530-542
- Kauppinen-Makelin R, Sane T, Valimaki MJ, Markkanen H, Niskanen L, Ebeling T, Jaatinen P, Juonala M, Finnish Acromegaly Study G, Pukkala E. Increased cancer incidence in acromegaly--a nationwide survey. Clinical endocrinology 2010; 72:278-279
- Ron E, Gridley G, Hrubec Z, Page W, Arora S, Fraumeni JF, Jr. Acromegaly and gastrointestinal cancer. Cancer 1991; 68:1673-1677
- Orme SM, McNally RJ, Cartwright RA, Belchetz PE. Mortality and cancer incidence in acromegaly: a retrospective cohort study. United Kingdom Acromegaly Study Group. The Journal of clinical endocrinology and metabolism 1998; 83:2730-2734
- Sklar CA, Mertens AC, Mitby P, Occhiogrosso G, Qin J, Heller G, Yasui Y, Robison LL. Risk of disease recurrence and second neoplasms in survivors of childhood cancer treated with growth hormone: a report from the Childhood Cancer Survivor Study. The Journal of clinical endocrinology and metabolism 2002; 87:3136-3141
- Swerdlow AJ, Reddingius RE, Higgins CD, Spoudeas HA, Phipps K, Qiao Z, Ryder WD, Brada M, Hayward RD, Brook CG, Hindmarsh PC, Shalet SM. Growth hormone treatment of children with brain tumors and risk of tumor recurrence. The Journal of clinical endocrinology and metabolism 2000; 85:4444-4449
- Blethen SL, Allen DB, Graves D, August G, Moshang T, Rosenfeld R. Safety of recombinant deoxyribonucleic acid-derived growth hormone: The National Cooperative Growth Study experience. The Journal of clinical endocrinology and metabolism 1996; 81:1704-1710
- Maneatis T, Baptista J, Connelly K, Blethen S. Growth hormone safety update from the National Cooperative Growth Study. Journal of pediatric endocrinology & metabolism : JPEM 2000; 13 Suppl 2:1035-1044
- Wyatt D. Lessons from the national cooperative growth study. European journal of endocrinology / European Federation of Endocrine Societies 2004; 151 Suppl 1:S55-59
- Ergun-Longmire B, Mertens AC, Mitby P, Qin J, Heller G, Shi W, Yasui Y, Robison LL, Sklar CA. Growth hormone treatment and risk of second neoplasms in the childhood cancer survivor. The Journal of clinical endocrinology and metabolism 2006; 91:3494-3498
- Crompton MR. Hypothalamic lesions following closed head injury. Brain : a journal of neurology 1971; 94:165-172
- Benvenga S, Campenni A, Ruggeri RM, Trimarchi F. Clinical review 113: Hypopituitarism secondary to head trauma. The Journal of clinical endocrinology and metabolism 2000; 85:1353-1361
- Kelly DF, Gonzalo IT, Cohan P, Berman N, Swerdloff R, Wang C. Hypopituitarism following traumatic brain injury and aneurysmal subarachnoid hemorrhage: a preliminary report. Journal of neurosurgery 2000; 93:743-752
- Lieberman SA, Oberoi AL, Gilkison CR, Masel BE, Urban RJ. Prevalence of neuroendocrine dysfunction in patients recovering from traumatic brain injury. The Journal of clinical endocrinology and metabolism 2001; 86:2752-2756
- Bondanelli M, De Marinis L, Ambrosio MR, Monesi M, Valle D, Zatelli MC, Fusco A, Bianchi A, Farneti M, degli Uberti EC. Occurrence of pituitary dysfunction following traumatic brain injury. Journal of neurotrauma 2004; 21:685-696
- Leal-Cerro A, Flores JM, Rincon M, Murillo F, Pujol M, Garcia-Pesquera F, Dieguez C, Casanueva FF. Prevalence of hypopituitarism and growth hormone deficiency in adults long-term after severe traumatic brain injury. Clinical endocrinology 2005; 62:525-532
- Agha A, Rogers B, Sherlock M, O'Kelly P, Tormey W, Phillips J, Thompson CJ. Anterior pituitary dysfunction in survivors of traumatic brain injury. The Journal of clinical endocrinology and metabolism 2004; 89:4929-4936
- Tanriverdi F, Senyurek H, Unluhizarci K, Selcuklu A, Casanueva FF, Kelestimur F. High risk of hypopituitarism after traumatic brain injury: a prospective investigation of anterior pituitary function in the acute phase and 12 months after trauma. The Journal of clinical endocrinology and metabolism 2006; 91:2105-2111
- Acerini CL, Tasker RC, Bellone S, Bona G, Thompson CJ, Savage MO. Hypopituitarism in childhood and adolescence following traumatic brain injury: the case for prospective endocrine investigation. European journal of endocrinology / European Federation of Endocrine Societies 2006; 155:663-669
- Einaudi S, Matarazzo P, Peretta P, Grossetti R, Giordano F, Altare F, Bondone C, Andreo M, Ivani G, Genitori L, de Sanctis C. Hypothalamo-hypophysial dysfunction after traumatic brain injury in children and adolescents: a preliminary retrospective and prospective study. Journal of pediatric endocrinology & metabolism : JPEM 2006; 19:691-703
- Khadr SN, Crofton PM, Jones PA, Wardhaugh B, Roach J, Drake AJ, Minns RA, Kelnar CJ. Evaluation of pituitary function after traumatic brain injury in childhood. Clinical endocrinology 2010; 73:637-643
- Poomthavorn P, Maixner W, Zacharin M. Pituitary function in paediatric survivors of severe traumatic brain injury. Archives of disease in childhood 2008; 93:133-137
- Heather NL, Jefferies C, Hofman PL, Derraik JG, Brennan C, Kelly P, Hamill JK, Jones RG, Rowe DL, Cutfield WS. Permanent hypopituitarism is rare after structural traumatic brain injury in early childhood. The Journal of clinical endocrinology and metabolism 2012; 97:599-604
- Buxton N, Robertson I. Lymphocytic and granulocytic hypophysitis: a single centre experience. British journal of neurosurgery 2001; 15:242-245, discussion 245-246
- Carmichael JD. Update on the diagnosis and management of hypophysitis. Current opinion in endocrinology, diabetes, and obesity 2012; 19:314-321
- Gellner V, Kurschel S, Scarpatetti M, Mokry M. Lymphocytic hypophysitis in the pediatric population. Child's nervous system : ChNS : official journal of the International Society for Pediatric Neurosurgery 2008; 24:785-792
- Cemeroglu AP, Blaivas M, Muraszko KM, Robertson PL, Vazquez DM. Lymphocytic hypophysitis presenting with diabetes insipidus in a 14-year-old girl: case report and review of the literature. European journal of pediatrics 1997; 156:684-688
- Papanastasiou L, Pappa T, Tsiavos V, Tseniklidi E, Androulakis I, Kontogeorgos G, Piaditis G. Azathioprine as an alternative treatment in primary hypophysitis. Pituitary 2011; 14:16-22
- Tubridy N, Saunders D, Thom M, Asa SL, Powell M, Plant GT, Howard R. Infundibulohypophysitis in a man presenting with diabetes insipidus and cavernous sinus involvement. Journal of neurology, neurosurgery, and psychiatry 2001; 71:798-801
- Ward L, Paquette J, Seidman E, Huot C, Alvarez F, Crock P, Delvin E, Kampe O, Deal C. Severe autoimmune polyendocrinopathy-candidiasis-ectodermal dystrophy in an adolescent girl with a novel AIRE mutation: response to immunosuppressive therapy. The Journal of clinical endocrinology and metabolism 1999; 84:844-852
- Selch MT, DeSalles AA, Kelly DF, Frighetto L, Vinters HV, Cabatan-Awang C, Wallace RE, Solberg TD. Stereotactic radiotherapy for the treatment of lymphocytic hypophysitis. Report of two cases. Journal of neurosurgery 2003; 99:591-596
- Abe T, Tara LA, Ludecke DK. Growth hormone-secreting pituitary adenomas in childhood and adolescence: features and results of transnasal surgery. Neurosurgery 1999; 45:1-10
- Bhansali A, Upreti V, Dutta P, Mukherjee KK, Nahar U, Santosh R, Das S, Walia R, Pathak A. Adolescent acromegaly: clinical parameters and treatment outcome. Journal of pediatric endocrinology & metabolism : JPEM 2010; 23:1047-1054
- Katznelson L, Atkinson JL, Cook DM, Ezzat SZ, Hamrahian AH, Miller KK, American Association of Clinical E. American Association of Clinical Endocrinologists medical guidelines for clinical practice for the diagnosis and treatment of acromegaly--2011 update. Endocrine practice : official journal of the American College of Endocrinology and the American Association of Clinical Endocrinologists 2011; 17 Suppl 4:1-44
- Chandrasekharappa SC, Guru SC, Manickam P, Olufemi SE, Collins FS, Emmert-Buck MR, Debelenko LV, Zhuang Z, Lubensky IA, Liotta LA, Crabtree JS, Wang Y, Roe BA, Weisemann J, Boguski MS, Agarwal SK, Kester MB, Kim YS, Heppner C, Dong Q, Spiegel AM, Burns AL, Marx SJ. Positional cloning of the gene for multiple endocrine neoplasia-type 1. Science 1997; 276:404-407
- Pellegata NS, Quintanilla-Martinez L, Siggelkow H, Samson E, Bink K, Hofler H, Fend F, Graw J, Atkinson MJ. Germ-line mutations in p27Kip1 cause a multiple endocrine neoplasia syndrome in rats and humans. Proceedings of the National Academy of Sciences of the United States of America 2006; 103:15558-15563
- Melmed S, Colao A, Barkan A, Molitch M, Grossman AB, Kleinberg D, Clemmons D, Chanson P, Laws E, Schlechte J, Vance ML, Ho K, Giustina A, Acromegaly Consensus G. Guidelines for acromegaly management: an update. The Journal of clinical endocrinology and metabolism 2009; 94:1509-1517
- Colao A, Ferone D, Marzullo P, Di Sarno A, Cerbone G, Sarnacchiaro F, Cirillo S, Merola B, Lombardi G. Effect of different dopaminergic agents in the treatment of acromegaly. The Journal of clinical endocrinology and metabolism 1997; 82:518-523
- Abs R, Verhelst J, Maiter D, Van Acker K, Nobels F, Coolens JL, Mahler C, Beckers A. Cabergoline in the treatment of acromegaly: a study in 64 patients. The Journal of clinical endocrinology and metabolism 1998; 83:374-378
- Maiza JC, Vezzosi D, Matta M, Donadille F, Loubes-Lacroix F, Cournot M, Bennet A, Caron P. Long-term (up to 18 years) effects on GH/IGF-1 hypersecretion and tumour size of primary somatostatin analogue (SSTa) therapy in patients with GH-secreting pituitary adenoma responsive to SSTa. Clinical endocrinology 2007; 67:282-289
- Bevan JS. Clinical review: The antitumoral effects of somatostatin analog therapy in acromegaly. The Journal of clinical endocrinology and metabolism 2005; 90:1856-1863
- Minniti G, Jaffrain-Rea ML, Osti M, Esposito V, Santoro A, Solda F, Gargiulo P, Tamburrano G, Enrici RM. The long-term efficacy of conventional radiotherapy in patients with GH-secreting pituitary adenomas. Clinical endocrinology 2005; 62:210-216
- Weinstein LS, Shenker A, Gejman PV, Merino MJ, Friedman E, Spiegel AM. Activating mutations of the stimulatory G protein in the McCune-Albright syndrome. The New England journal of medicine 1991; 325:1688-1695
- Akintoye SO, Chebli C, Booher S, Feuillan P, Kushner H, Leroith D, Cherman N, Bianco P, Wientroub S, Robey PG, Collins MT. Characterization of gsp-mediated growth hormone excess in the context of McCune-Albright syndrome. The Journal of clinical endocrinology and metabolism 2002; 87:5104-5112
- Akintoye SO, Kelly MH, Brillante B, Cherman N, Turner S, Butman JA, Robey PG, Collins MT. Pegvisomant for the treatment of gsp-mediated growth hormone excess in patients with McCune-Albright syndrome. The Journal of clinical endocrinology and metabolism 2006; 91:2960-2966
- Kirschner LS, Carney JA, Pack SD, Taymans SE, Giatzakis C, Cho YS, Cho-Chung YS, Stratakis CA. Mutations of the gene encoding the protein kinase A type I-alpha regulatory subunit in patients with the Carney complex. Nature genetics 2000; 26:89-92
- Stratakis CA, Kirschner LS, Carney JA. Clinical and molecular features of the Carney complex: diagnostic criteria and recommendations for patient evaluation. The Journal of clinical endocrinology and metabolism 2001; 86:4041-4046
- Horvath A, Stratakis CA. Clinical and molecular genetics of acromegaly: MEN1, Carney complex, McCune-Albright syndrome, familial acromegaly and genetic defects in sporadic tumors. Reviews in endocrine & metabolic disorders 2008; 9:1-11
- Pack SD, Kirschner LS, Pak E, Zhuang Z, Carney JA, Stratakis CA. Genetic and histologic studies of somatomammotropic pituitary tumors in patients with the "complex of spotty skin pigmentation, myxomas, endocrine overactivity and schwannomas" (Carney complex). The Journal of clinical endocrinology and metabolism 2000; 85:3860-3865