preg-fig8

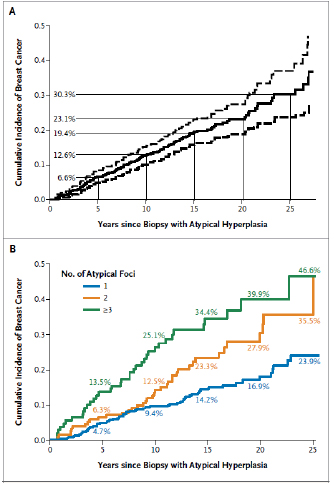
Figure 8. Incidence of breast cancer in cohort of patients with a histologic diagnosis of atypical hyperplasia. Top panel: mean (solid line) and 95% confidence limits (dashed lines). Bottom panel: Incidence in patients with 1, 2, or 3 or more independent lesions. Reprinted with the permission of the authors and publisher from Hartmann LC et al (23).

Figure 8. Incidence of breast cancer in cohort of patients with a histologic diagnosis of atypical hyperplasia. Top panel: mean (solid line) and 95% confidence limits (dashed lines). Bottom panel: Incidence in patients with 1, 2, or 3 or more independent lesions. Reprinted with the permission of the authors and publisher from Hartmann LC et al (23).